Article Text

Abstract
Objectives Multiomics study was conducted to elucidate the crucial molecular mechanisms of primary Sjögren’s syndrome (SS) pathology.
Methods We generated multiple data set from well-defined patients with SS, which includes whole-blood transcriptomes, serum proteomes and peripheral immunophenotyping. Based on our newly generated data, we performed an extensive bioinformatic investigation.
Results Our integrative analysis identified SS gene signatures (SGS) dysregulated in widespread omics layers, including epigenomes, mRNAs and proteins. SGS predominantly involved the interferon signature and ADAMs substrates. Besides, SGS was significantly overlapped with SS-causing genes indicated by a genome-wide association study and expression trait loci analyses. Combining the molecular signatures with immunophenotypic profiles revealed that cytotoxic CD8 T cells were associated with SGS. Further, we observed the activation of SGS in cytotoxic CD8 T cells isolated from patients with SS.
Conclusions Our multiomics investigation identified gene signatures deeply associated with SS pathology and showed the involvement of cytotoxic CD8 T cells. These integrative relations across multiple layers will facilitate our understanding of SS at the system level.
- Sjgren's Syndrome
- Gene Polymorphism
- Disease Activity
This is an Open Access article distributed in accordance with the Creative Commons Attribution Non Commercial (CC BY-NC 4.0) license, which permits others to distribute, remix, adapt, build upon this work non-commercially, and license their derivative works on different terms, provided the original work is properly cited and the use is non-commercial. See: http://creativecommons.org/licenses/by-nc/4.0/
Statistics from Altmetric.com
Introduction
Primary Sjögren’s syndrome (SS) is a chronic autoimmune disorder characterised by the destruction of lacrimal and salivary glands, and it is often accompanied by systemic manifestations. Existing therapies for SS are symptomatic treatments, and there are no disease-modifying treatments that can change the natural course of SS. Recently, open-label studies of biologics targeting CD201 and BAFF2 have been conducted. Although these studies demonstrated some promise, their therapeutic effects were not dramatic with respect to the response rate or the magnitude of symptomatic improvements. Thus, there is an enormous need to develop novel therapies that can remedy the pathophysiological components of SS.
To elucidate the crucial disease mechanisms of SS, considerable effort has been made toward the comprehensive characterisation of molecular and cellular components. These efforts include genome-wide association studies (GWAS)3 4 and studies on transcriptomes in peripheral blood5 and affected glands,6 epigenomes,7 serum proteomes,8 metabolomes9 and high-dimensional immunophenotyping.10 For instance, interferon-responsive genes (IRGs) are dysregulated in peripheral blood5 and aberrantly DNA methylated.7 In addition, our serum proteome analysis8 identified the serum biomarkers for SS progression. Despite the success in identifying disease components of SS, there is a substantial lack of understanding regarding how each component connects and relates to SS development.
In this study, we performed transcriptome profiling and immunophenotyping for the identical blood samples previously used for the serum proteome.8 Our integrative analysis identified SS gene signatures (SGS) disrupted in widespread layers, including whole-blood transcriptomes, whole-blood DNA methylation and serum proteomes. We further showed that the SGS are related to SS GWAS variants and immune cell subsets.
Results
Identification of SS disease signatures
Our multiomics cohort was composed of 30 patients with SS and 30 healthy controls (HCs) (online supplementary figure 1). We measured whole-blood transcriptomes using genome-wide microarrays (n=60), 1100 serum proteins based on the SOMAmer technology (n=60) as previously described,8 and the abundance of 24 peripheral immune cell populations (n=49–50).
To identify gene signatures that were highly dysregulated in SS, we integrated the SS molecular aberrations with correlation networks built from transcriptome and proteome data (figure 1A). The correlation networks were used to identify the group of genes or proteins, which were regulated similarly in SS. We used the Weighted Correlation Network Analysis (WGCNA) method11 and the affinity propagation method12 to identify such groups in transcriptional networks and protein networks, respectively. We identified 32 transcript coexpression modules and 52 protein coabundance modules (online supplementary table 1). Then, these modules were prioritised based on the relevance to SS.
The disease relevance of each module was quantified based on four metrics, differentially expressed gene (DEG), differentially expressed protein (DEP), disease activity-related index (DAI), differentially correlated genes or protein (DCOR) and differentially methylated region (DMR) (figure 1B). DEG(P) evaluates whether module memberships are differentially expressed between SS and HC (online supplementary table 1). We overlaid upregulated genes (SS-HC_Up) and downregulated genes (SS-HC_Dw) separately with each module. DAI assesses whether module eigenvalues are correlated with disease activity-related indexes. DCOR quantifies the enhancement of correlation among module memberships in SS compared with the healthy condition. We only focused on the gain of correlation in SS (SS-HC_Up), because the loss of correlation occurs unlikely for the modules identified in SS. DMR evaluates whether the cis-regulatory elements of module memberships are hypermethylated (SS-HC_Up) or hypomethylated (SS-HC_Dw). The DMRs in whole blood in SS includes 5615 hypermethylated and 6159 hypomethylated regions.7

Study design and analytical strategy. (a) Data integration workflow. Correlation networks based on transcripts and proteins in primary Sjögren’s syndrome (SS) were built separately and clustered into gene groups referred as modules. Disease relevance of modules was assessed based on molecular aberration measures. The prominent SS modules were further investigated their functions and associations with immunophenotypes. (b) Molecular aberration measures used for selecting disease modules. Four measures were used to assess disease relevance of module. Differentially expressed gene (DEG) measure corresponds to the magnitude of overlap between module memberships and differentially expressed genes between SS and healthy control (HC). Disease activity-related index (DAI) quantifies the association between module eigenvalues and DAIs of SS using the limma R package. Differentially correlated genes or protein (DCOR) evaluates whether the module is specifically present in SS based on the enrichment of pairs of differentially correlated genes between SS and HC. Differentially correlated genes were identified based on Spearman’s correlation. Differentially methylated region evaluates that the cis-regulatory elements of module memberships are differentially methylated.
We found that transcriptional module1 (TR1) that contained 271 genes showed significant associations with all four metrics (figure 2A) (online supplementary table 3). Specifically, most genes in TR1 were upregulated in patients with SS compared with HC. The eigenvalues of TR1 were positively correlated with the levels of autoantibodies, including anti-Ro/SSA and anti-La/SSB antigen–antibodies and serum IgG levels, both of which are serologic features of SS. Furthermore, the correlation strength among genes in TR1 increased in SS, indicating that TR1 reflected the reorganisation of transcriptional networks. Moreover, the genomic regions that code genes in TR1 were predominantly hypomethylated in SS and thus presumed to be transcriptionally activated. Accumulating evidence strongly indicated that the TR1 was highly dysregulated in SS.
The same data integration procedure was applied to the 52 protein coabundance modules. We identified one protein module (PR1) that contained 83 proteins and showed a remarkable accumulation of molecular aberrations concerning all the metrics evaluated (figure 2B).

Identification of disease modules. (a) Disease association landscapes of transcriptional modules and (b) protein modules. The strength of overlap between module memberships and differentially expressed genes (DEGs) or differentially expressed proteins (DEPs), differentially correlated genes or proteins (DCOR) and differentially methylated regions (DMRs) and the association between module eigenvalues and Disease Activity-Related Indexes (DAIs) were depicted as heatmaps; their statistical significance is indicated as asterisks (p<0.05, false discovery rate (FDR) <0.05, ratio >0.15 and fold >2). The bar graphs located at the top of the heatmaps represent the number of significant categories tested for each module, namely, DEG, DEP, DAI, DCOR and DMR.
Disease signatures involve IRGs, GWAS genes and ADAM substrates
The overall association trends against the molecular aberrations were quite similar for TR1 and PR1 (figure 2). The levels of these two modules were significantly concordant regarding the rank orders (Spearman’s rho: 0.71; p: 1.86×10⁻⁵) (figure 3A), but the relation was non-linear. PR1 exhibited more obvious associations with the European League Against Rheumatism (EULAR) Sjögren’s Syndrome Disease Activity Index (ESSDAI) (Spearman’s rho: 0.62; p: 3.32×10⁻⁴) than TR1 (Spearman’s rho: 0.44; p: 0.017) (figure 3B). Besides, the pairwise associations of TR and PR modules revealed PR1 had many significant connections with higher ranked TR modules (online supplementary figure 4).
We next investigated the gene memberships of the two SS-related modules and their similarity. Two genes, granulin (GRN) and complement component (C1QA), were commonly involved in TR1 and PR1. The number of overlap was not statistically significant. To examine the similarity of two modules further, we performed pathway analysis for TR1 and PR1 using the Broad hallmark gene sets.13 Interestingly, these two modules were both associated (p<0.05, FDR<0.25) with IRGs (figure 3C; online supplementary table 4). TR1 captured a major component of IRGs including HERC5, EPSTI1 and CMPK2 that have been used for monitoring IRGs.14 PR1 covered different members of IRGs, for instance, interferon-induced chemokines such as CXCL10 and CXCL11. The result indicated a robust association of IRGs with SS pathology at both transcriptional and protein levels.
Next, we assessed the etiological relevance of the modules by overlaying the GWAS result of SS. In Han Chinese population, nine SNPs reaches genome-wide or suggestive significance levels.3 Then, each SNP was assigned to genes based on physical location and cis-/trans-expression quantitative trait loci (eQTL) information (online supplementary table 5). We found significant overlaps with TR1 and SS GWAS genes, especially when trans-eQTL information was incorporated (figure 3D). This observation indicates the contribution of TR1 to SS development, and thus further strengthens the importance of TR1.
The serum proteome panel was designed to detect the subset of genes including cytokines and soluble forms of their receptors, such as sTNFR1. Ectodomain shedding by a disintegrin and metalloproteinase (ADAM) family or matrix metalloproteinase 9 (MMP9) is recognised as the major mechanism for generating soluble cytokine receptors.15 16 Therefore, we hypothesised that a sheddase substrate signature might be present in the serum protein coabundance modules. We obtained substrate information of ADAM10, ADAM17 and MMP9 from the CutDB17 and examined their overrepresentation in the modules. Strikingly, PR1 included a greater number of ADAM substrates, whereas no enrichments were observed for MMP9 (figure 3E). The enrichment of ADAM substrates was specific to PR1 (online supplementary table 4). Most ADAM substrates in PR1 showed significant positive correlations with ESSDAI (figure 3F). Intriguingly, this trend did not hold at transcript levels (figure 3F). The result suggests that ADAM’s activity might increase as the SS severity progresses.

Functional characterisation of disease-associated modules. (a) The eigenvalues of transcriptional module1 (TR1) and protein module (PR1) show significant positive relationships (Spearman’s rho: 0.71; p: 1.86×10⁻⁵). (b) ESSDAI is correlated with the eigenvalues of TR1 (Spearman’s rho: 0.44; p: 0.017) and PR1 (Spearman’s rho: 0.62; p: 3.32×10⁻⁴). (c) The significant overrepresentation of interferon-responsive genes in both TR and PR1. The inner parts of the circles represent the normalised significance for TR1, and the outer regions of the circles represent that of PR1. Nodes are connected if there are shared gene memberships. (d) primary Sjögren’s syndrome (SS) genome-wide association studies (GWAS) genes were enriched in TR1. The number of the GWAS gene in the module is indicated above the bar. (e) ADAM substrates were specifically enriched in PR1. The number of the substrate in the module is indicated above the bar. (f) ADAM substrates were correlated with ESSDAI only in protein level. Spearman’s correlation test was employed.
SS disease signatures are associated with common cell types
To reveal the cell populations associated with TR1 and PR1, we correlated immunophenotyping data obtained from the same blood samples with the levels of TR1 or PR1. The ratio of immune cell counts within white blood cells (WBC) was primarily used for the correlation analysis because we found that the WBC-normalised cell counts were associated with the transcriptome stronger than the absolute counts (online supplementary figure 2A). Both TR1 and PR1 were positively correlated with terminally differentiated effector memory CD8 T cells (TEMRA) and HLADR+CD8 T cells (FDR<0.25, p<0.05). Regulatory B cells (BREG), basophils and naive CD4 T cells were correlated with either TR1 or PR1. These associations in HCs were not evident (p>0.05) (figure 4A). A formal differential correlation test18 19 indicated that the associations between the modules and the both CD8 T cells subsets were highly SS specific (figure 4B). Interestingly, TEMRA, HLADR+CD8 T cells and BREG were also correlated with other higher ranked modules (online supplementary figure 5 and supplementary figure 6), suggesting further relevance with disease signatures. Finally, the examination of the cell types with disease activity-related traits revealed that TEMRA, HLADR+CD8 T cells, BREG and basophils were significantly correlated with at least one of them (FDR<0.25, p<0.05) (figure 4c). The same tendencies were also seen when absolute cell counts were used (online supplementary figure 7 and supplementary figure 8). The association result for other cell types will be found in online supplementary figure 9. Together, our results suggested that the SS omics SGS were related to common cell types and, the most notably, their connections with activated cytotoxic CD8 T cells were SS specific, which may reflect the disease characteristics.

Primary Sjögren’s syndrome (SS)-specific association of transcriptional module1 (TR1) and protein module (PR1) with activated CD8 T cells. (a) Peripheral immune cells associated with the eigenvalues of TR1 or PR1 in SS. The p-value in each panel corresponds to the significance based on Spearman’s correlation test. (b) Activated CD8 T cells showed SS-specific associations with both TR1 and PR1. The p-value in each panel corresponds to the significance of the differential correlations between the groups. (c) Clinical traits associated with the module-related cell types. The asterisks represent the p-value based on the limma method with age as a covariate (*p<0.05, FDR<0.05).
Enhanced activity of TR1 in CD8 T cells in SS
What drives the SS-specific correlations between CD8 T cells and SS-associated modules? The cells might produce molecules in the modules, or conversely, the modules act on cell abundance. We focused on the former scenario with TR1 in this study, but other possibilities are also plausible (see Discussion section). To investigate whether TR1 is present and elevated in the CD8 T cells from patients with SS, we conducted transcriptome experiments. The peripheral CD8 T-cell subsets in four major differentiation stages from six patients with SS and six HCs were analysed (online supplementary figure 10). We also profiled CD4 T cells subsets from six patients with SS and six HCs to examine the TR1 in the cell types negatively correlated with TR1. Principal component analysis revealed that cell differentiation steps contributed to major transcriptome variations (online supplementary figure 11), indicating reasonable biological signals were embedded in the data. Then, we evaluated the module presence in the CD8 T-cell and CD4 T-cell transcriptomes using the composite metric that quantifies the similarity of correlation structure.20 Strikingly, TR1 in CD8 T cells was present specifically in SS (figure 5A). TR1 was also present in CD4 T cells, but which was not SS specific. The levels of the TR1 in CD8 T cells were overall higher in SS and TEMRA reached statistical significance (figure 5B), whereas CD4 T cells did not show significant activations of TR1. These results demonstrated that CD8 T-cell, especially TEMRA, produces the TR1 signature observed in the whole-blood transcriptome. To further characterise the CD8 T cells in SS, we performed gene set enrichment analysis21 using the CD8 T-cell signatures treated with interferons (GSE17301) from the MSigDB.13 The gene signature induced by simultaneous T-cell receptor (TCR) activation and stimulation of interferon-alpha2 was highly enhanced in TEMRA in SS (figure 5C). This suggests that the synergistic cross-talk of TCR and interferon pathway might be activated in TEMRA in SS and targeting the cross-talk might be effective for suppressing transcriptional dysregulations in the CD8 T cells.

The presence and activation of transcriptional module1 (TR1) in CD8 T cells. (a) TR1 preservations in CD8 and CD4 T cells. Zsummary score corresponds to the statistical significance of module preservation measures. Zsummary above two is significant. The number attached to each bar corresponds to the median rank of preservation measures among 32 transcriptional modules. (b) TR1 was differentially expressed in TEMRA in primary Sjögren’s syndrome (SS). The eigenvalue of TR1 was calculated and compared between healthy control (HC) and SS using Welch’s t-test. (c) TEMRA in SS exhibited the gene signatures activated by TCR and interferon-alpha. Gene set enrichment analysis was conducted using public CD8 T-cell signatures based on Gene Set Variation Analysis (GSVA) method. The difference of enrichment score between HC and SS was evaluated using the limma.
TR1 is associated with cytotoxic CD8 T cells in minor salivary glands
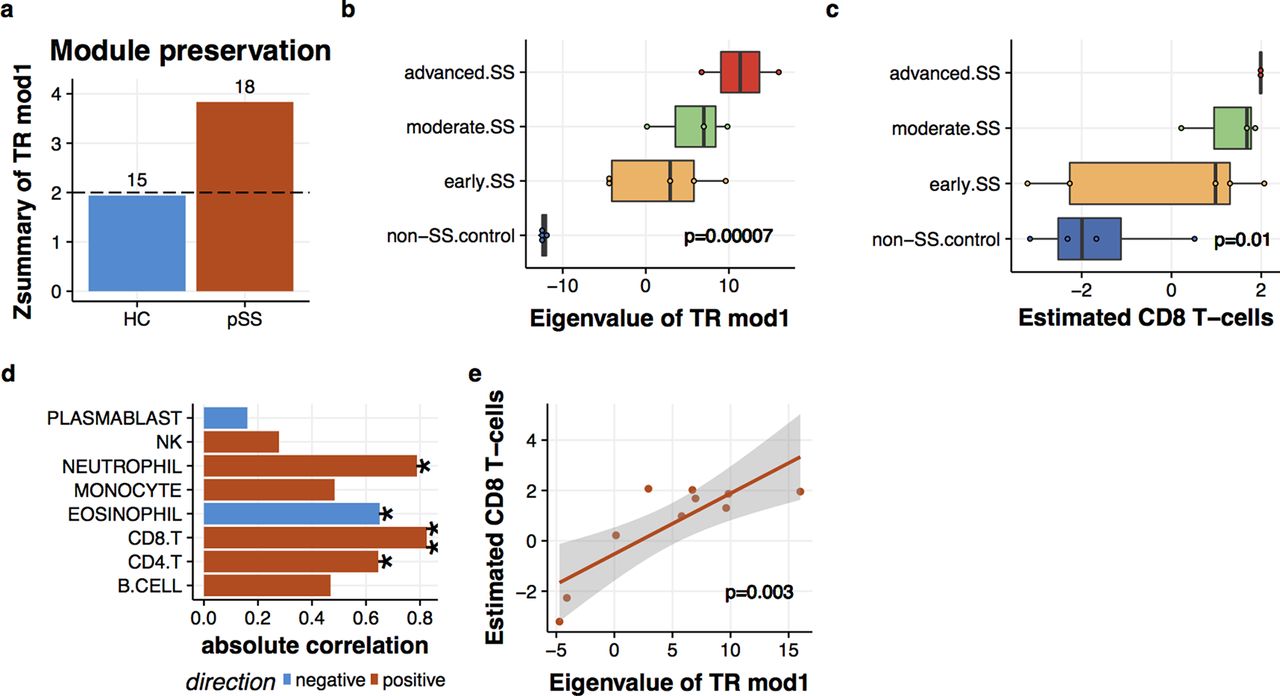
Our last question involved whether the connection between disease signature and cytotoxic CD8 T cells also existed in the salivary glands of patients with SS. To gain implication for this question, we reanalysed the gene expression profiles of minor salivary glands (MSGs) from patients with SS.6 The module preservation analysis revealed that TR1 in MSG was present specifically in SS (figure 6A). Also, the levels of TR1 exhibited apparent enhancements as the magnitude of lymphocytic aggregates (Tarpley score) increased (figure 6B). To examined the relationship between TR1 and CD8 T cells, we inferred the cell abundance based on the gene expression profiles (see online supplementary methods and supplementary figures 2 and 3). The estimated CD8 T cells also elevated along with Tarpley score (figure 6C). TR1 and estimated CD8 T cells in MSG were positively correlated (Pearson’s correlation=0.82, p=0.003) to the greatest extent among the estimated cell populations (figure 6D, E). Thus, this result suggests that the link between TR1 and CD8 T cells is present in both the peripheral blood and MSG tissues of patients with SS.

![[figS1.jpg]](https://ard.bmj.com/content/annrheumdis/76/8/1458/DC1/embed/inline-supplementary-material-1.jpg?download=true)
![[figS4.jpg]](https://ard.bmj.com/content/annrheumdis/76/8/1458/DC4/embed/inline-supplementary-material-4.jpg?download=true)
![[figS2.jpg]](https://ard.bmj.com/content/annrheumdis/76/8/1458/DC7/embed/inline-supplementary-material-7.jpg?download=true)
![[figS5.jpg]](https://ard.bmj.com/content/annrheumdis/76/8/1458/DC8/embed/inline-supplementary-material-8.jpg?download=true)
![[figS6.jpg]](https://ard.bmj.com/content/annrheumdis/76/8/1458/DC9/embed/inline-supplementary-material-9.jpg?download=true)
![[figS7.jpg]](https://ard.bmj.com/content/annrheumdis/76/8/1458/DC10/embed/inline-supplementary-material-10.jpg?download=true)
![[figS8.jpg]](https://ard.bmj.com/content/annrheumdis/76/8/1458/DC11/embed/inline-supplementary-material-11.jpg?download=true)
![[figS9.jpg]](https://ard.bmj.com/content/annrheumdis/76/8/1458/DC12/embed/inline-supplementary-material-12.jpg?download=true)
![[figS10.jpg]](https://ard.bmj.com/content/annrheumdis/76/8/1458/DC13/embed/inline-supplementary-material-13.jpg?download=true)
![[figS11.jpg]](https://ard.bmj.com/content/annrheumdis/76/8/1458/DC14/embed/inline-supplementary-material-14.jpg?download=true)
![[figS3.jpg]](https://ard.bmj.com/content/annrheumdis/76/8/1458/DC15/embed/inline-supplementary-material-15.jpg?download=true)
Interplay of transcriptional module1 (TR1) and CD8 T cells in salivary glands. (a) TR1 was preserved in the MSG under primary Sjögren’s syndrome (SS) condition. Zsummary score corresponds to the statistical significance of module preservation measures. Zsummary above two is significant. The number attached to each bar corresponds to the median rank of preservation measures among 32 transcriptional modules. (b) Enhanced TR1 expression in the MSG of SS. The histopathologic lesion grades were defined in the original report6 based on Tarpley score (TS) as control (TS=1), early (TS=1), moderate (TS=2) and severe (TS=3–4). Expression levels of TR1 were calculated by principal component analysis (PCA) and correlated with TS by the limma. (c) Enhanced estimated CD8 T-cell levels in the MSG of SS. CD8 T-cell amounts in the MSG were inferred based on the CD8 T-cell signature probes and correlated with TS by the limma. (d) Estimated CD8 T-cell levels were highly correlated with TR1 in the MSG. Pearson’s correlation was used (*p<0.05, **p<0.005). (e) A scatter plot of estimated CD8 T-cell levels and TR1 expression in the MSG.
Discussion
In this study, we report a multiomics cohort of SS with an extensive bioinformatic investigation. Our integrative framework allowed us to discriminate the molecular aberrations into pieces of disease-associated gene signatures and further connect them with cell types.
PR1 comprised the substrates shed by ADAM family proteases (figure 3E). The ADAM substrates observed in this study were also detected in other disease conditions. For instance, there are high levels of soluble TNF-R1 and TNF-R2 in the serum in Crohn’s disease and ulcerative colitis.22 In addition, sepsis elicits an increase in the soluble adhesion molecules shed by ADAMs in the serum, such as ICAM1 and VCAM1.23 Furthermore, the activation of ADAMs, especially ADAM17 has been implicated in a variety of inflammatory disorders, as reviewed in.24 Our observations also suggest that SS might ramp up ADAM shedding activity and PR1 can be used to monitor its activity.
Although we focused on TR1 and PR1, the next place modules also provided us some implications for SS pathology. For instance, TR2 contained the molecules related with lymphotoxin beta-receptor (LTBR) signalling (online supplementary table 4). The beneficial effect of LTBR antagonist has been shown in the non-obese diabetic (NOD) mouse model.25 However, the blockage of LTBR could not improve salivary functions in human.26 A recent report indicates the specificity of the effect of LTBR antagonist on CD4 T-cell subsets in mice,27 which might relate to its limited efficacy in human. Further analysis of TR2 with immunophenotypes might advance our understanding of LTBR pathway in patients with SS. PR2 included Wnt antagonists, DKK1 and DKK4 (online supplementary table 4), suggesting Wnt signalling dysfunctions in SS as seen in many autoimmune diseases.28
We showed that CD8 T cells were one of the sources for TR1 activation in SS. What are other hypotheses for the correlations between activated CD8 T cells and SS-associated modules? First, the production of PR1 proteins from CD8 T cells have been reported. For instance, TCR-activated CD8 T cells can produce soluble TNF-R2,29 Tim-330 and LAG-331 by ADAMs. Second, both interferons and PR1 can increase the abundance of CD8 T cells. The exposure to type-I interferon allows CD8 T cells to escape from NK cell cytotoxicity.32 33 Also, type-I interferons directly work as the third signal for naive CD8 T-cell maturation.34 Alternatively, CXCL10 and CXCL11 in the PR1 enhance antigen-specific CD8 T-cell responses and memory T-cell formation.35 The above factors may work in combination, which will be investigated further to untangle the mechanisms in detail.
The roles of CD8 T cells in SS have not been explored extensively. Previously, we found that CD8 T cells-expressing αEβ7 integrin colocalised with acinar epithelial cells in the lacrimal glands of patients with .36 The acinar epithelial cells around CD8 T cells showed apoptotic characteristics accompanied by high levels of cytotoxic molecules, including perforin, granzyme B. Besides, deep immunophenotyping of salivary gland tissue and peripheral blood from SS showed that the amount of HLADR+CD8 T cells was positively correlated with ESSDAI at both sites.10 These reports strengthen the findings from our multiomics analysis. Therefore, we hypothesise that CD8 T cells might be the key cell type that contributes to tissue disruption in SS.
In this study, we successfully built pathways from molecules to macrophenotypes in SS based on multiomics data from well-defined patients. This depth of understanding cannot be obtained using mono-omic data, showing the promising utility of multilayer data to understand disease mechanisms. We believe the molecules and their connections highlighted from our analysis will smooth the path to developing future novel therapies and biomarkers for SS.
Methods
Cohorts
Thirty-six patients with SS and 36 HCs who did not suffer from autoimmune diseases or were not receiving any drugs were enrolled from March 2012 to May 2013. Patients who were being treated with moderate to high doses of corticosteroids, immunosuppressants or biological agents were excluded. All procedures were approved by the medical ethics committee of Keio University Hospital and followed the tenets of the Declaration of Helsinki. All samples and information were collected after patients and HCs provided written informed consent.
Transcriptome measurements
Blood samples were collected from healthy and SS human donors in PAXgene tubes. Total RNA was isolated with the PAXgene Blood RNA Kit (Qiagen, Valencia, California, USA) after freezing and storage. Ambion GLOBINclear (Ambion, Austin Texas, USA) was applied to total RNA samples to remove globin transcripts.
Peripheral CD8 T cell and CD4 T cell were purified with the CD8 T-Cell Isolation Kit and the CD4 T-Cell Isolation Kit (Miltenyi Biotec, Bergisch Gladbach, Germany), respectively. After staining with antibodies, each subset was isolated with the FACSAriaIII (BD Biosciences, San Jose, California, USA). Total RNA from the sorted cells was extracted (miRCURY RNA Isolation Kit, Exiqon, Vedbaek, Denmark), purified (RNeasy MinElute Cleanup KitTM, Qiagen, Hilden, Germany) and amplified (Ovation Pico WTA System V2 NuGEN Technologies, San Carlos, California, USA).
RNA samples were run on an Agilent 2100 BioAnalyzer using the RNA NanoChip (Agilent, Palo Alto, California, USA), and we confirmed that the RNA Integrity Numbers (RINs) were all above 7.0. All RNA samples were hybridised to the Affymetrix Human Genome U133 plus 2.0 arrays (Affymetrix, Santa Clara, California, USA). Quality control procedures for probe intensities are described in the online supplementary methods.
Serum proteome
Serum protein concentrations were measured using a Slow Off-Rate Modified DNA Aptamer (SOMAmer)-based capture array (SOMAscanTM; SomaLogic, Boulder, Colarado, USA) as previously described.8 The level of relative fluorescence units (RFUs) corresponding to 1100 serum protein concentration was log2-transformed and used for the analysis.
Immunophenotyping
Human whole-blood was collected using heparin blood collection tubes (TERUMO, Shibuya, Tokyo, Japan) and mixed with fluorochrome-conjugated monoclonal antibodies to human cell surface antigens. To lyse and fix erythrocytes, the FACS Lysing Solution (BD Biosciences) was used. Flow cytometer data were obtained with the FACSAriaIII (BD Biosciences). We followed standard immunophenotyping protocols from the Human Immunology Project37 and the ONE Study.38 The antibodies used for sorting TEMRA, HLADR+CD8 T cells and BREG,39 naive CD4 T cells and basophils are listed in the online supplementary methods.
Disease phenotyping
Disease activity in SS was quantified based on the ESSDAI score. The ESSDAI score evaluates 12 domains. Each domain is divided into three to four levels according to the degree of activity and scored as 0 (no activity), 1 (low activity), 2 (moderate activity) or 3 (high activity) as described previously.8
Bioinformatic analysis
Correlation modules were identified using the WGCNA11 and the affinity propagation algorithm.12 The detailed protocols for bioinformatic analysis are described in the online supplementary methods.
Acknowledgments
We thank to YY, YO and HK for helping experiments; TA, YN for analytical implications; MH for critical reading of the manuscript.
References
Footnotes
Contributors Study design: KS, AN, YK, TM, AY, HT and TT. Data acquisition: KS, AN, YK, MT, RK, MT, KYo, HY, Kya, KI, KT and RM. Data analysis and interpretation: ST, YO and TM. Manuscript drafting: ST, KS and TM. All authors have critically reviewed the manuscript and approved the
final manuscript.
Provenance and peer review Not commissioned; externally peer reviewed.
Data sharing statement mRNA microarray, protein array and immunophenotyping data have been deposited in the Gene Expression Omnibus (GEO) Data Bank (www.ncbi.nlm.nih.gov/geo/) under accession code IDs GSE84844, GSE93683 and GSE94510, and the Synapse (www.synapse.org) under doi:10.7303/syn8483276.