Article Text

Statistics from Altmetric.com
Adalimumab, an anti-TNF-α monoclonal antibody, is effective in active rheumatoid arthritis (RA), but the response is highly variable between patients. Good responders have significantly higher adalimumab serum concentrations than non-responders.1 In a recent issue of the Annals, Pouw et al2 have proposed a therapeutic cut-off concentration for adalimumab that is predictive of clinical response at a population level but, as for other TNF-α antagonists, no individualised target concentration has been defined to adjust the dose in RA.3
In a post hoc analysis we measured adalimumab concentrations in 127 samples from 30 patients with RA who received 40 mg adalimumab subcutaneously every other week.4 Concomitantly to blood sampling, disease activity score in 28 joints (DAS28) was recorded at baseline and at 6 weeks, 12 weeks, 24 weeks and 52 weeks after treatment initiation. Then, we studied the relationship between adalimumab concentration and DAS28 with a direct Emax inhibition pharmacokinetic-pharmacodynamic model, using Monolix V.3.1 (INRIA, Saclay, France). Emax models are often used to describe the concentration-response relationship, where the ‘quantity’ of response is monotonically related to drug concentration.5 With such a model, the relationship reaches an asymptote for high adalimumab concentrations when DAS28 reaches its minimal value. Estimated baseline DAS28 and adalimumab IC50, that is, adalimumab concentration leading to 50% decrease of baseline DAS28, were 5.7 (coefficient of variation=10%) and 11.8 mg/L (coefficient of variation=75%), respectively. Therefore, for a patient with a median baseline DAS28=5.7, with an adalimumab concentration of 11.8 mg/L, the baseline DAS28 would be decreased twofold (figure 1). The adalimumab target concentration necessary to achieve a decrease in DAS28 from baseline to 3.2, that is, low disease activity, was obtained with the estimated parameters of the Emax inhibition model as follows: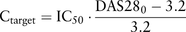 where Ctarget is the adalimumab concentration needed to achieve DAS28=3.2 and DAS280 the DAS28 at baseline. A graph expressing Ctarget as a function of DAS280 and IC50 was constructed to define the individual target adalimumab concentration associated with treatment-induced low disease activity according to disease activity at baseline (figure 2). The large interindividual variability in IC50 reflects the between-subject variability in sensitivity to adalimumab. Indeed, for a given adalimumab concentration, a high adalimumab IC50 value results in low clinical response and vice versa. Also, given a median adalimumab IC50 value, high baseline DAS28 is less associated with achieving low disease activity than moderate baseline DAS28. This finding is consistent with Aletaha et al,6 who showed that the probability of achieving remission or low disease activity decreases with increasing baseline disease activity.

Relationship between disease activity score in 28 joints (DAS28) and adalimumab concentration. Each dot represents a time-point assessment of adalimumab concentration and DAS28. The open circles denote baseline (adalimumab concentrations=0), week 6, week 12 and week 24 time points. Closed circles denote week 52 time point. The solid line represents the model-predicted concentration–DAS28 relationship in an average patient. The dotted lines delineate the 5% to 95% interval.

Adalimumab concentration needed to achieve low disease activity according to baseline DAS28. This graph provides an estimation of the target concentration (Ctarget) on the X axis by baseline DAS28 (DAS280) on the Y axis, in patients with an average adalimumab IC50 (solid line). The dotted lines delineate the 25% to 75% interval. For example, the Ctarget for a patient with a DAS280 of 6.45 is 12 mg/L (squares), the Ctarget for a patient with a DAS280 of 4.55 is 5 mg/L (dots). The same approach was used to achieve clinical remission, that is, DAS28<2.6 (data not shown).
The present model points out that individual disease activity at baseline is an essential factor in determining the target concentration to achieve a clinical objective. Indeed, the target concentration will be proportional to the baseline DAS28: increased in patients with very active disease and decreased in patients with moderate disease activity (figure 2). Apart from disease activity, other factors may influence the relationship between adalimumab concentration and clinical response. Hence, further studies are needed to explain the interindividual variability in IC50.
We provide a tool to select an individual target concentration of adalimumab according to disease activity at baseline. This approach is hypothetical and must be replicated in a larger study before being used as a tool for therapeutic drug monitoring of adalimumab in RA.
Acknowledgments
The authors thank Céline Desvignes for organising the material transfer and managing samples, Anne-Claire Duveau and Caroline Brochon for measuring adalimumab concentrations, Karim Lalouche for providing clinical data and Laura Smales for the kind assistance with the manuscript.
Footnotes
-
Contributors ED helped create the model and drafted the manuscript. DT created the model and drafted the manuscript. TL co-initiated this work and helped improve the manuscript. PF helped to create the model. XLL and OV provided the data and samples (ClinicalTrials.gov Identifier: NCT00234234) and helped improve the manuscript. HW and PG helped improve the manuscript. GP helped create the model and also improve the manuscript. DM co-initiated this work and drafted the manuscript. All authors read and approved the final manuscript.
-
Funding The study was supported by the French National Research Agency under the programme “Investissements d'avenir” Grant Agreement LabEx MAbImprove: ANR-10-LABX-53. Measurement of serum adalimumab concentrations was performed within the platform Centre Pilote de suivi Biologique des traitements par Anticorps/Pilot centre for Therapeutic Antibodies Monitoring (CePiBAc/PiTAM). CePiBAc/PiTAM is co-financed by the FEDER European Union programme (Fonds Européen de développement régional—European funding for regional development).
-
Competing interests ED was invited to attend international congresses by Roche and UCB; she has acted as a consultant and given lectures on behalf of her institution for BMS and Abbvie. DT declared no conflict of interest. TL participated on behalf of his institution in clinical trials sponsored by BMS, Lilly, MSD, Novartis, Novo-Nordisk, Pfizer, Roche-Chugai, UCB; he has been a consultant for BMS, Pfizer, Roche-Chugai, SOBI, UCB; he has been invited to attend international congresses by MSD and Pfizer. PF was invited to attend congresses by BMS and Roche. XLL participated on behalf of his institution in clinical trials sponsored by Abbvie, AB Science, BMS, MSD, Novartis, Pfizer, Roche-Chugai, Schering Plough and UCB; he had been a consultant for Abbvie, Amgen, Novartis, Pfizer, Roche-Chugai and Schering Plough; he has been invited to attend international congresses by MSD, Pfizer and Roche Chugai; he has obtained on behalf of his institution grants for research projects from Abbvie, Amgen, MSD, Pfizer, Roche Schering Plough and UCB. HW declared no conflict of interest. PG participated on behalf of his institution in clinical trials sponsored by Abbott, Roche, BMS, Lilly, Novartis, Pfizer, UCB and MSD; he has been a consultant and given lectures on behalf of his institution for Abbott, BMS, MSD, Pfizer, UCB; he has been invited to attend international congresses by MSD, Roche, BMS and Abbott. GP is involved in clinical studies sponsored by Genzyme, Novartis and Roche Pharma; his research team has received financial support from Abbott Pharma, Chugai, Janssen, LFB (Laboratoire Français des Biotechnologies), Pierre-Fabre Laboratories, Wyeth and Merck Serono. OV participated on behalf of his institution in clinical trials sponsored by BMS, Roche, Roche-Chugai, Pfizer, UCB, AB Science, Schering Plough and Abbott; he is a member of the French advisory boards of BMS, SOBI and UCB; he has given lectures for BMS, Pfizer, MSD and Roche and has obtained on behalf of his institution grants for research projects from Pfizer, Roche and UCB. DM participated on behalf of his institution in clinical trials sponsored by Abbott, Roche, BMS, Pfizer, UCB and MSD; his hospital received a grant for research from Abbott in 2004; he has been a consultant and given lectures on behalf of his institution for MSD and Pfizer; he has been invited to attend international congresses by MSD, Roche, BMS and Abbott.
-
Provenance and peer review Not commissioned; externally peer reviewed.