Article Text

Abstract
Purpose To determine high resolution computed tomography (HRCT) patterns and pulmonary function indices which are associated with increased mortality in patients with connective tissue disease related fibrotic lung disease (CTD-FLD).
Methods HRCTs from 168 patients with CTD-FLD were scored by 2 observers for a variety of HRCT patterns and traction bronchiectasis. A radiological diagnosis of usual interstitial pneumonia (UIP), fibrotic non-specific interstitial pneumonia (NSIP) or indeterminate was also assigned. Using Cox regression analysis, associations with mortality were identified. Honeycombing and traction bronchiectasis scores were converted to binary absence/presence scores and also tested. A subgroup analysis of patients with biopsy material (n=51) was performed by classifying patients according to radiological and histopathological diagnoses, as concordant UIP, discordant UIP and fibrotic NSIP. The prognostic separation of this classification was also evaluated.
Results Severity of traction bronchiectasis (HR 1.10, p=0.001, 95% CIs 1.04 to 1.17), increasing extent of honeycombing (HR 1.08, p=0.021, 95% CI 1.03 to 1.13) and reduction in DLco (HR 0.97, p=0.013, 95% CI 0.95 to 0.99) were independently associated with increased mortality. Interobserver agreement and prognostic strength were higher for binary traction bronchiectasis scores (weighted κ (κw)=0.69, HR 4.00, p=0.001, 95%CI 1.19 to 13.38), than binary honeycombing scores (κw=0.50, HR 2.87, p=0.022, 95% CI 1.53 to 5.43). The radiological-histopathological classification was strongly associated with increased mortality (HR 2.74, p<0.001, 95% CI 1.57 to 4.77) and patients with discordant UIP had a better prognosis than concordant UIP but worse prognosis than fibrotic NSIP.
Conclusions Severity of traction bronchiectasis, extent of honeycombing and DLco are strongly associated with mortality in CTD-FLD. Interobserver agreement for traction bronchiectasis is higher than for honeycombing. In CTD-FLD, radiological diagnosis has survival implications in biopsy proven UIP.
- Connective tissue disease associated lung disease
- Interstitial Fibrosis
Statistics from Altmetric.com
Key messages
What is the key question?
-
Survival differences exist between idiopathic fibrotic lung disease (fibrotic IIP) and connective tissue disease related fibrotic lung disease (CTD-FLD) and therefore it is unclear if prognostic determinants in fibrotic IIP can be directly translated to CTD-FLD.
What is the bottom line?
-
Severity of traction bronchiectasis and extent of honeycombing on HRCT as well as reduction in DLco are the strongest determinants of mortality in CTD-FLD. For patients with connective tissue disease and biopsy proven usual interstitial pneumonia (UIP), survival differences exist between those presenting with a UIP pattern of disease on HRCT, than those without typical features of UIP on HRCT.
Why read on?
-
As most patients with CTD-FLD do not undergo lung biopsy, identification of prognostic determinants using available clinical and radiological data is important for stratification of clinical risk and the enrolment of patients into clinical trials.
Introduction
Pulmonary complications are common in patients with connective tissue disease and pulmonary fibrosis in particular is an important cause of mortality.1 ,2 Connective tissue disease related fibrotic lung disease (CTD-FLD) most frequently presents as one of two radiological-histopathological phenotypes—usual interstitial pneumonia (UIP) or fibrotic non-specific interstitial pneumonia (NSIP). As most patients with CTD-FLD do not undergo surgical lung biopsy, other clinical parameters such as pulmonary function and computed tomography (CT) data maybe the only tools available on which to base management decisions. The prognostic role of CT has been extensively studied in idiopathic fibrotic lung disease,3–7 however the number of studies reporting on the role of CT in predicting prognosis in CTD-FLD is comparatively small.8 ,9 Despite radiological-histopathological similarities between CTD-FLDs and idiopathic fibrotic lung disease, applying prognostic data derived in one group to another may be inappropriate for a number of reasons. CTD-FLD does not exactly replicate fibrotic idiopathic interstitial pneumonias (IIP) in terms of histopathological presentation, and several studies suggest that prognosis in CTD-FLD is better than in fibrotic IIP.10–12 In idiopathic fibrotic lung disease several studies have reported on prognostic CT patterns, which are applicable to this group as a whole, that is, idiopathic pulmonary fibrosis (IPF) and fibrotic NSIP.3 ,13 An advantage of this approach is that prognosis can be predicted without the need to separate these two entities on CT, which can often be problematic.14
Until now, there are no studies which have evaluated the prognostic impact of CT patterns in a large group of patients with CTD-FLD. As individual CTD subsets often overlap clinically15 and on CT16 and most frequently present as either UIP or fibrotic NSIP on CT, the identification of prognostic patterns applicable across a variety of CTDs would be clinically useful. The purpose of this study was to investigate high resolution computed tomography (HRCT) patterns that may predict prognosis in a variety of connective tissue diseases characterised by pulmonary fibrosis.
Methods
Study population and clinical evaluation
Pulmonary function tests and HRCTs were clinically indicated in all cases, and for the purposes of retrospective examination of this data, informed patient consent was not required by the institutional review board. Patients who did not have a HRCT and lung function tests performed within three months of each other were excluded. The diagnosis of CTD-FLD was made following a clinical, radiological and when biopsy material was available, pathological review of the patient data using the relevant society's diagnostic criteria.17–22 The presence of pulmonary fibrosis was determined on HRCT by two radiologists of 9 years’ and 25 years’ experience, respectively.
A diagnosis of pulmonary arterial hypertension (PAH), if established by right heart catheterisation was also recorded. Survival period was calculated starting from the date of the baseline HRCT to the date of death, or in the case of survivors, to the last known point of contact. In cases where patients were lost to follow-up, status at the end of the study period was confirmed by contacting the respective family practitioners.
HRCT protocol and image evaluation
A detailed description of the HRCT protocol, scoring method and definitions of HRCT patterns can be found in the online repository. Briefly, two thoracic radiologists of 9 years’ and 10 years’ experience scored HRCTs for each patient on the extent of four interstitial patterns (ground glass opacification, reticulation, honeycombing and consolidation) and emphysema, at six levels. A traction bronchiectasis score was also assigned. Honeycombing was defined as air-filled cystic spaces with irregular walls deemed not representing traction bronchiectasis, and traction bronchiectasis was defined as irregular bronchial dilatation caused by surrounding retractile pulmonary fibrosis. Lastly, observers provided a radiological diagnosis for each case selecting from UIP, fibrotic NSIP and indeterminate. This radiological diagnosis was based upon current clinical guidelines.23 Example scores with images are given in figures 1–3.
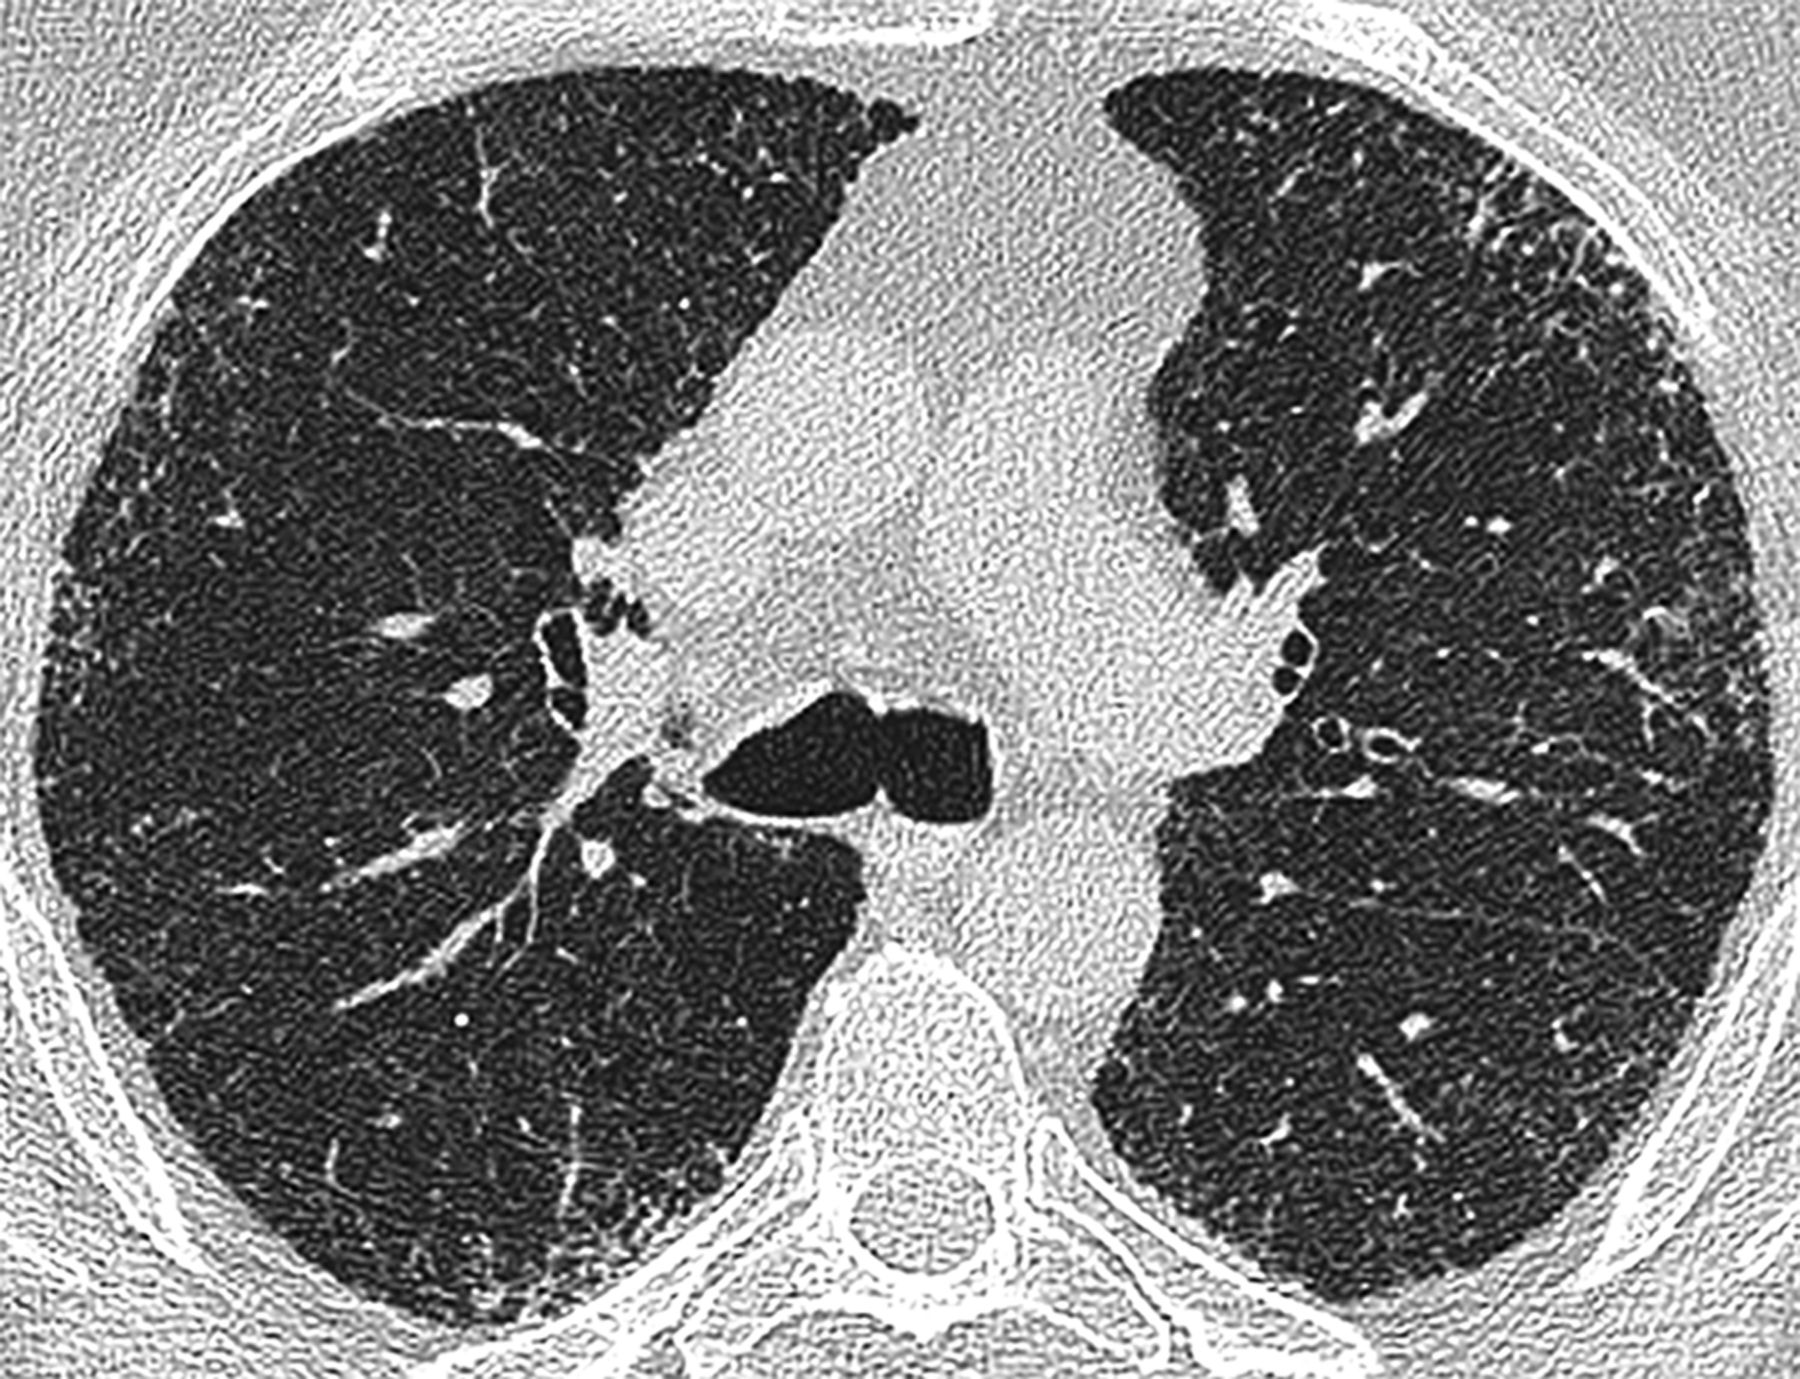
Axial high resolution computed tomography image at the level of the carina in a patient with systemic sclerosis related fibrotic lung disease. There is subpleural fine reticulation. Consensed scores at this level were: total disease extent=20%, reticulation=100%. Traction bronchiectasis was grade=0.

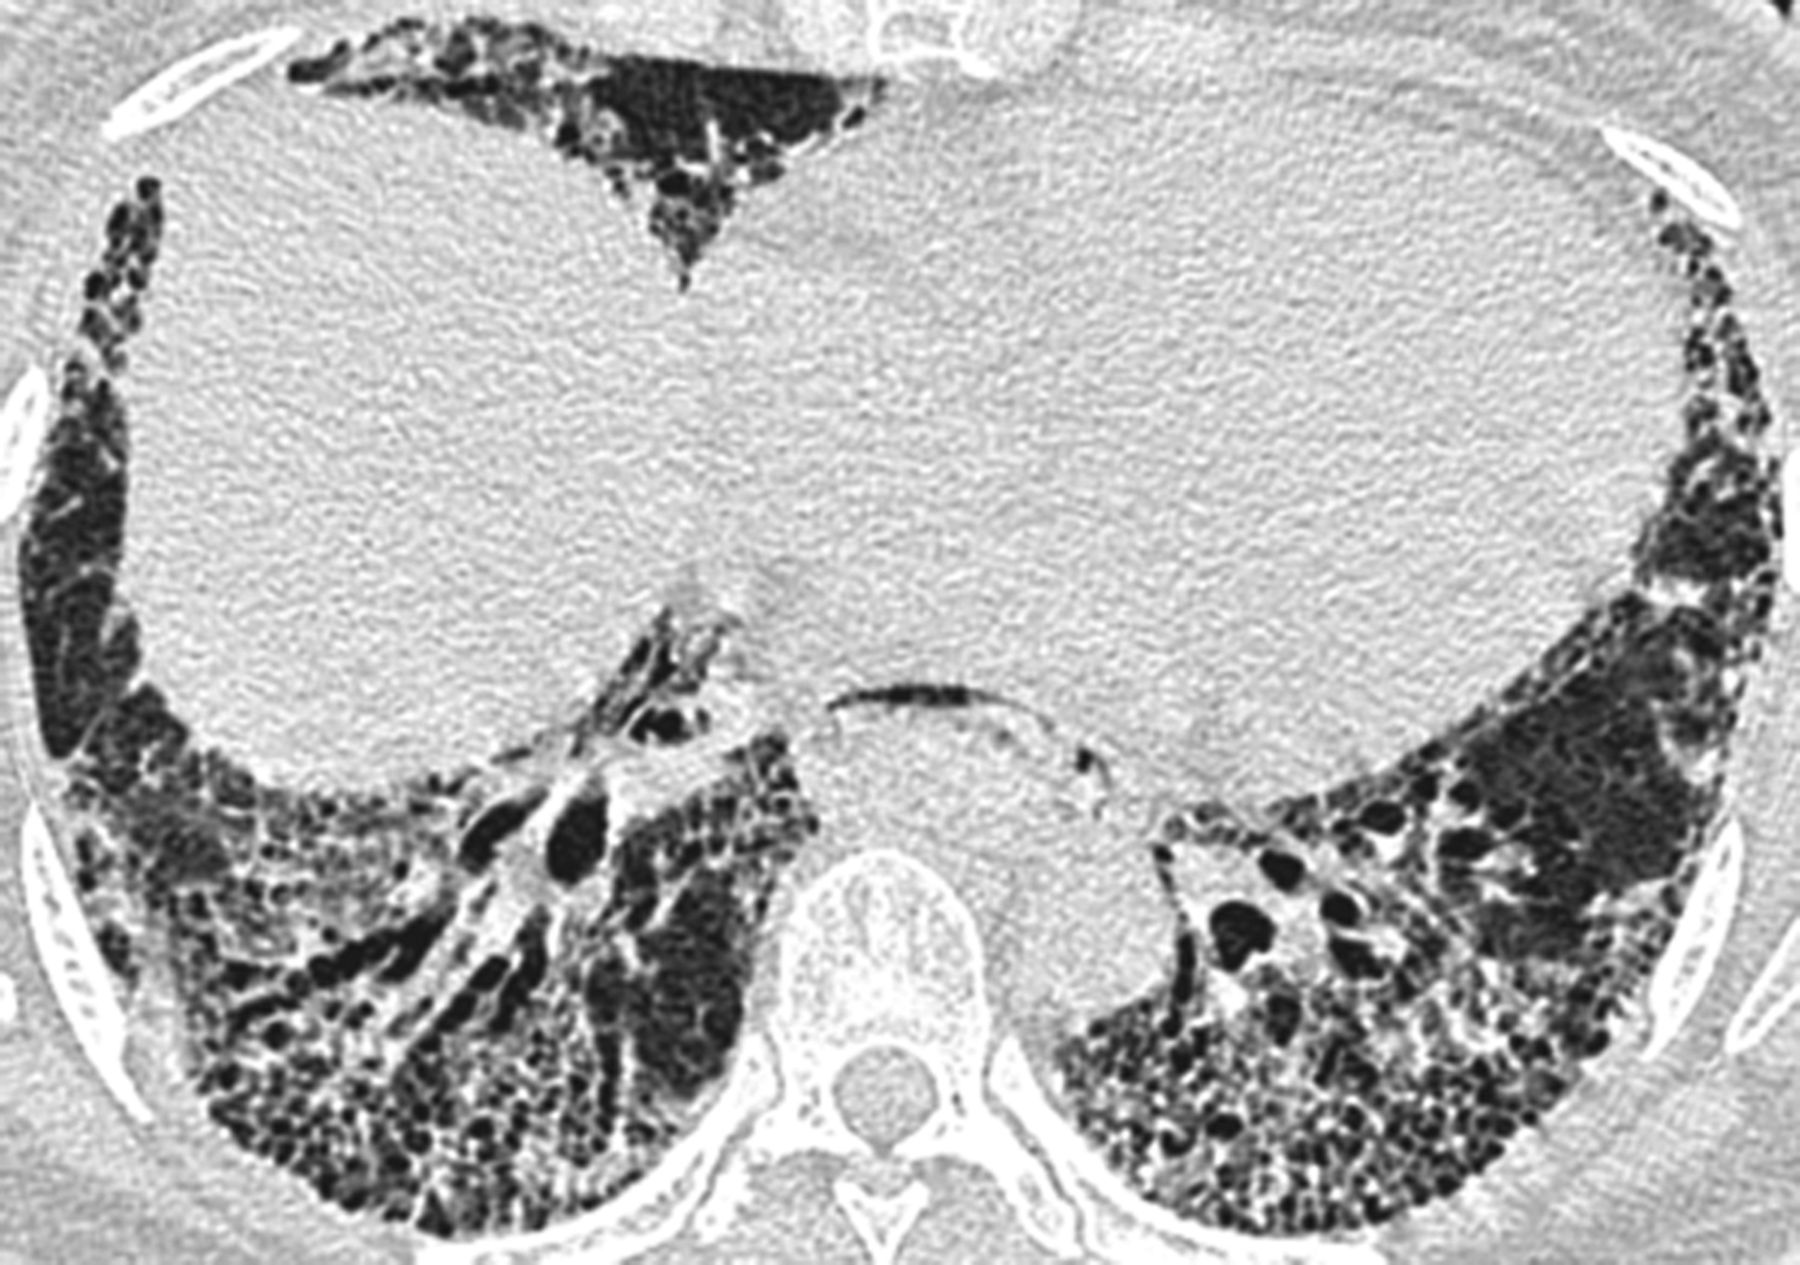
Axial thin section computed tomography image 1cm below the dome of the right hemidiaphragm in a patient with mixed connective tissue disease fibrotic lung disease. There is patchy ground glass opacification and subpleural honeycombing, both containing areas of traction bronchiectasis. Consensed scores were at this level: total disease extent=85%, ground glass opacification=60%, honeycombing=40%. Traction bronchiectasis was grade=2 in both parenchymal patterns.

Axial thin section computed tomographic image in a patient with rheumatoid arthritis related fibrotic lung disease. There is diffuse ground glass opacification containing areas of marked traction bronchiectasis. Subpleural honeycombing is also present. Consensed scores at this level were: total disease extent=90%, ground glass opacification=80% and honeycombing=20%. Traction bronchiectasis was grade=3 within the ground-glass opacification in the right middle lobe and grade 2 in the honeycombing.
Pulmonary function tests
Spirometry (Jaeger Master screen PFT, Carefusion, Warwick, UK), plethysmographic lung volumes (Jaeger Master screen Body, Carefusion, Warwick, UK) and diffusion capacity for carbon monoxide (DLco) (Jaeger Master screen PFT, Carefusion, Warwick, UK) were used to measure lung function according to established protocols. The following indices were recorded: FEV1, FVC, total lung capacity and single breath carbon dioxide diffusing capacity corrected for haemoglobin concentration (DLco). These values were expressed as a percentage of the predicted values for the patient's age, sex and height.24
Statistical analysis
Data are given as means with SDs, medians with IQR, or as number of patients and percentage where appropriate. Statistical analyses were performed using STATA (V.12, StataCorp, College Station, Texas). The single determination SD was used to evaluate interobserver agreement for continuous variables (total interstitial disease extent, ground-glass opacification, fine and coarse reticulation, honeycombing, consolidation and emphysema).25 The weighted κ statistic (κw) was used to evaluate interobserver agreement for categorical variables (traction bronchiectasis) and was categorised as follows: poor (0<κw≤0.20), fair (0.20<κw≤0.40), moderate (0.40<κw≤0.60), good (0.60<κw≤0.80) and excellent (0.80<κw≤1.00).25 Cox regression analysis was used to identify associations between mortality and HRCT variables and pulmonary function indices. One univariable model was built for total interstitial disease extent, traction bronchiectasis, each HRCT pattern score, FVC, FEV1 and DLco and a single multivariable model was built using a backward elimination procedure for terms found statistically significant (p<0.05) on univariable analysis. The assumptions of linearity and proportional hazards were assessed by visual inspection of Martingale residuals and scaled Schoenfeld residuals.
Results
A total of 205 patients were identified. Of these, 47 patients were excluded because: (1) on detailed evaluation of clinical data, a multidisciplinary diagnosis of CTD had not been secured (n=25) and (2) HRCT not performed within 3 months of lung function test (n=22). The remaining 168 patients made up the study population. This group consisted of patients with a diagnosis of rheumatoid arthritis (RA, n=39), scleroderma (SScl, n=32), mixed connective tissue disease (MCTD, n=33), polymyositis (PM, n=33), systemic lupus erythematosus (SLE, n=17) and Sjögren's disease (n=14). Excluded patients did not differ significantly in terms of functional impairment from the final study population. Histopathological confirmation of the specific subtype of fibrosis (UIP/fibrotic NSIP) was available in 51 cases. During the study period, 48/168 patients died. Causes of death were documented as progression of their interstitial lung disease (n=44) and sepsis (n=3) and lung cancer (n=1). Of the 120/168 remaining patients, 105 were confirmed as alive at the end of the study period by reviewing the clinical records. Fifteen patients were lost to follow-up but subsequently confirmed as alive at the end of the study period by contacting the respective patients’ family practitioners.
Of the 168 patients enrolled in the study, 103 were female. The mean age at the time of presentation was 55.9 years (SD=10.9 years). Median follow-up time was 64 months (IQR=38.4). The median interval between HRCT and baseline lung function was 6 days (IQR=1.0). There were 20 patients with an established diagnosis of pulmonary arterial hypertension (RA-FLD=2, SScl=10, MCTD=5, PM=3, SLE=0, Sjögren's disease=0). A summary of patient demographics, radiological scores and pulmonary function tests are given in table 1. Observer agreement for each of the HRCT patterns and traction bronchiectasis are shown in table 2. Interobserver agreement for radiological diagnosis assignment was good (κw=0.74). Assigned diagnoses were fibrotic NSIP (85.7%, 144/168), indeterminate (5.3%, 9/168) and UIP (8.9%, 15/168). Patients assigned a radiological diagnosis of UIP had more extensive reticulation and honeycombing and more severe traction bronchiectasis when compared with patients assigned a diagnosis of fibrotic NSIP or deemed to have an indeterminate HRCT pattern of disease (table 3). Honeycombing was identified in 21 cases (RA=10, SScl=3, MCTD=4, PM=0, SLE=3, Sjögren's disease=1) and was the least frequent pattern identified overall. Traction bronchiectasis was identified in 125 cases (RA=33, SScl=22, MCTD=27, PM=26, SLE=8, Sjögren's disease=9). All 15 cases assigned a radiological diagnosis of UIP had honeycombing and traction bronchiectasis on HRCT.
Demographic data for the connective tissue disease related fibrotic lung disease (CTD-FLD) cohort (n=168), HRCT and selected pulmonary indices at time of CT
Interobserver agreement for HRCT parenchymal patterns expressed as the single determination SD for continuous variables and the weighted κ coefficient for categorical variables* (n=168)
Observers’ HRCT scores for patients with CTD-FLD assigned a radiological diagnosis of fibrotic NSIP, UIP or indeterminate (n=168)
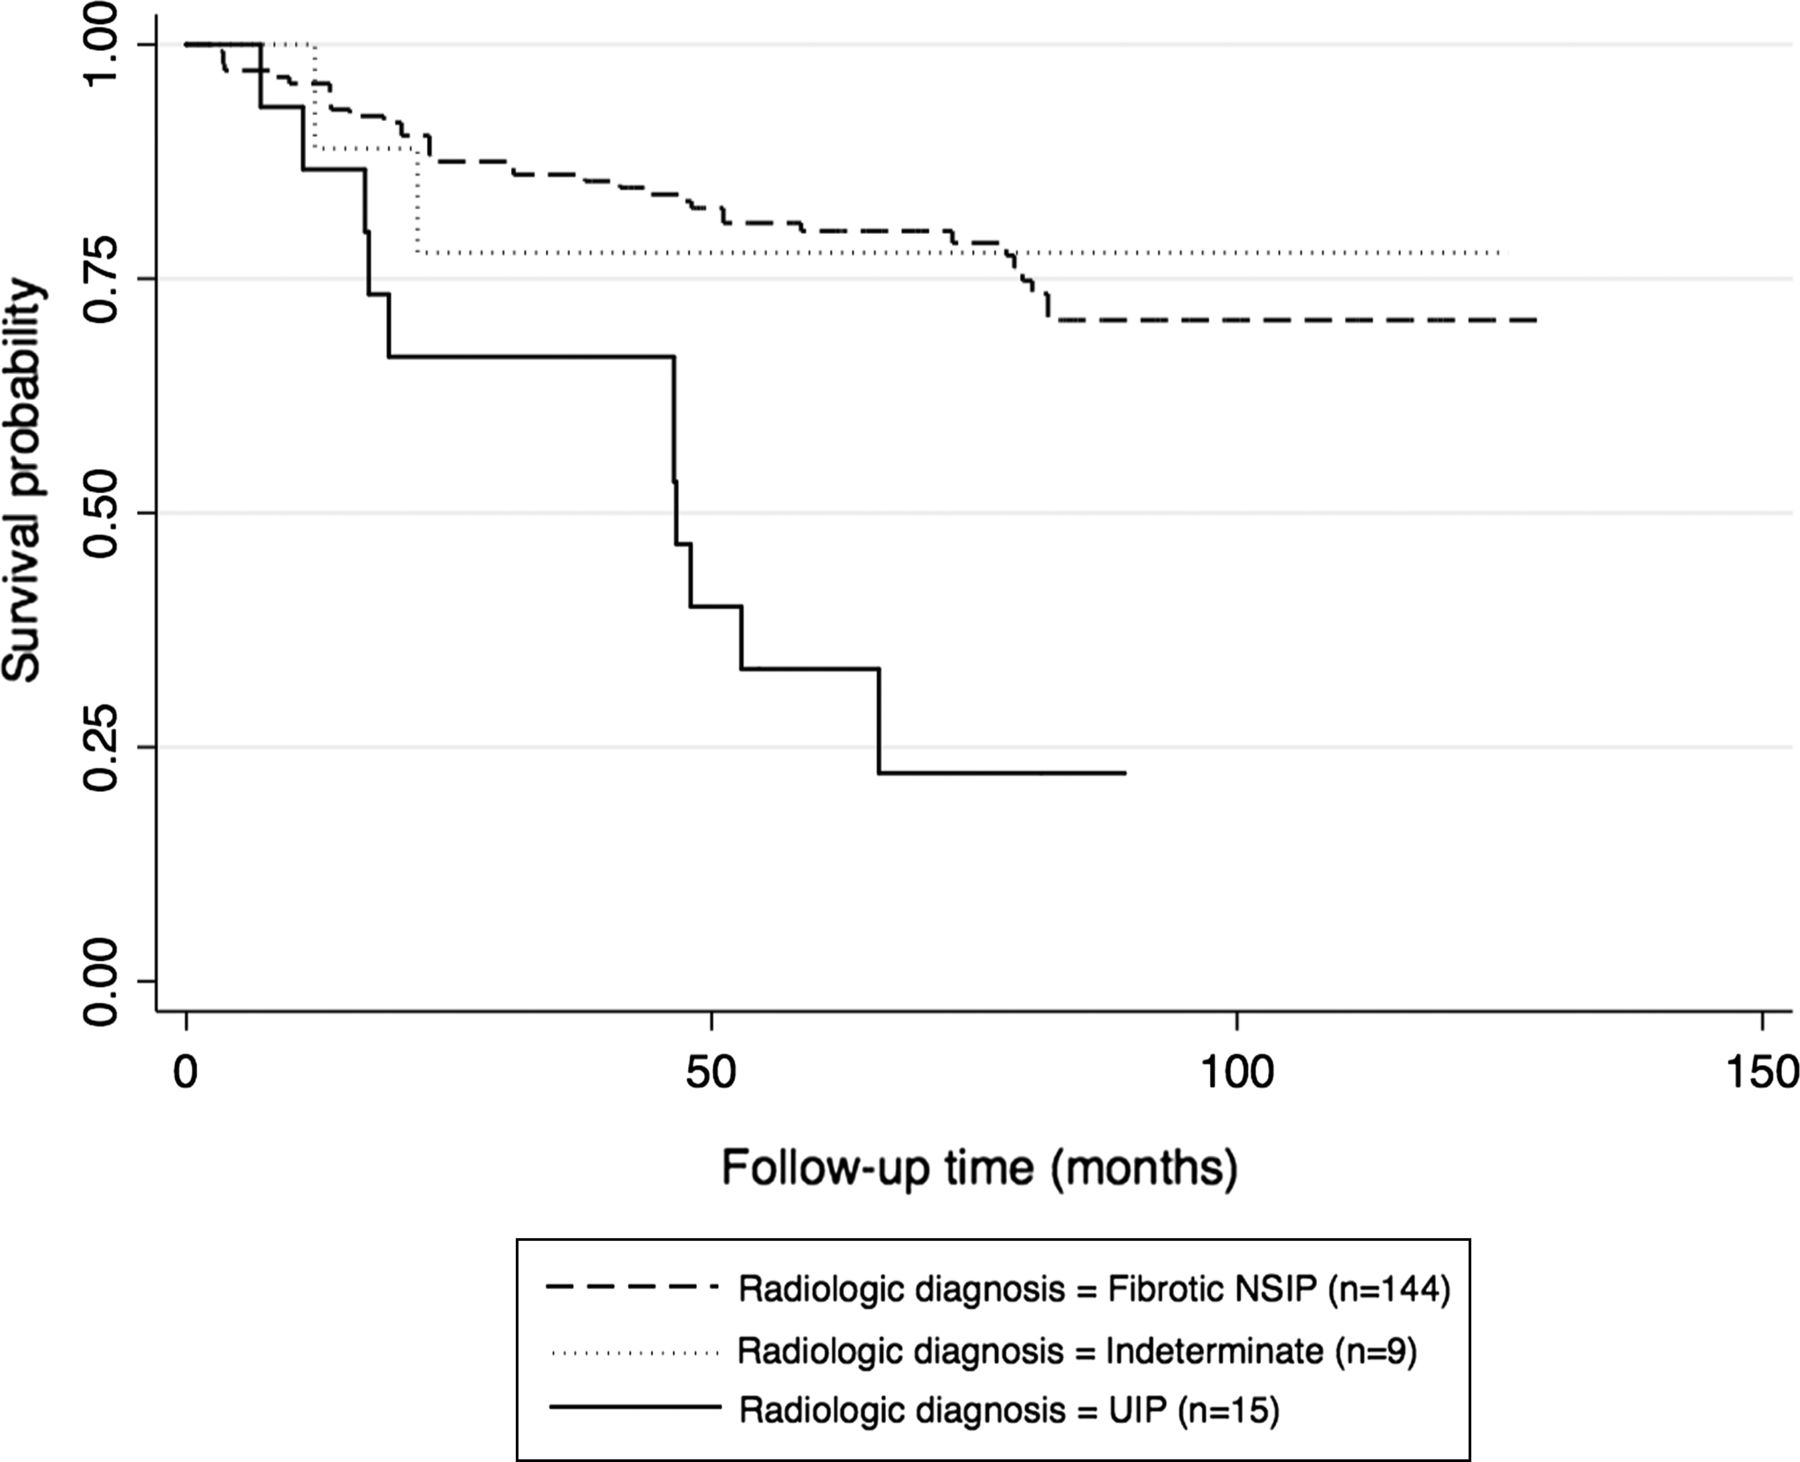
On univariable analysis, ground glass opacification was the only parenchymal pattern, which was not associated with increased mortality (table 4). Radiological diagnosis was strongly associated with mortality (table 4, figure 4). On multivariable analysis, increasing severity of traction bronchiectasis, increasing extent of honeycombing and reduction in DLco independently associated with increased mortality (table 5). These results remained independently associated with increased mortality on subgroup analysis in patients with a radiological diagnosis of NSIP (and those with a radiological diagnosis of UIP (see online supplementary appendix, table 1)). On the basis of these results, the continuous traction bronchiectasis scores and honeycombing scores for each patient were converted to a simple binary absence/presence score. Interobserver agreement for the absence/presence of traction bronchiectasis was good (κw=0.69) and for the absence/presence of honeycombing was moderate (κw=0.50). A multivariable analysis, substituting the continuous traction bronchiectasis and honeycombing scores for these binary scores again demonstrated that the binary scores and DLco were the only variables independently associated with increased mortality (traction bronchiectasis absent/present=HR 4.00, p=0.001, 95% CI 1.19 to 13.38, honeycombing absent/present=HR 2.87, p=0.022, 95% CI 1.53 to 5.43, DLco=HR 0.97, p=0.013. 95% CI 0.95 to 0.99). The prognostic strength of these binary scores was preserved on subgroup analysis of the entire cohort with each CTD subgroup removed in turn, (see online supplementary appendix, tables 2 and 3). Two further analyses were performed: first, all analyses were repeated after censoring of non-respiratory deaths (n=4). Second, as vasculopathy with PAH may occur in patients with SScl (SScl-PAH) or SLE (SLE-PAH), which already confers a particularly poor prognosis, a second analysis of all variables was performed, censoring patients with SScl-PAH (n=10) or SLE-PAH (SLE-PAH=0). These analyses resulted in no appreciable changes in significance of predictors or magnitude of their impact on survival time estimates.
Crude HRs for mortality according to HRCT and pulmonary indices in CTD-FLD (n=168)
Multivariable HRs for mortality according to HRCT and pulmonary indices in CTD-FLD (n=168)

Kaplan-Meier survival curve for connective tissue disease related fibrotic lung disease (CTD-FLD) patients based upon radiological presentation (n–168).
Subgroup analysis in patients with surgical lung biopsy data (n=51)
Patients with biopsy proven UIP (n=25) had more severe disease in terms of extent of disease as well as extent of reticulation, honeycombing and severity of traction bronchiectasis when compared with those with biopsy proven fibrotic NSIP (n=26) (table 6). Patients for whom a histopathological diagnosis was available were divided into four categories based upon a combination of the assigned radiological and established histopathological diagnoses; (1) radiological and histopathological diagnosis of UIP (n=13—concordant UIP), (2) radiological diagnosis of fibrotic NSIP or indeterminate, with histopathological diagnosis of UIP (n=12—discordant UIP) (3) radiological diagnosis of UIP or indeterminate, with histopathological diagnosis of NSIP (n=9, discordant NSIP) and (4) radiological and histopathological diagnosis of fibrotic NSIP (n=17, concordant NSIP) This radiological-histopathological distinction was strongly associated with increased mortality (HR 2.65, p<0.001, 95% CI 1.67 to 4.99). Patients with concordant UIP had the highest mortality, while concordant NSIP was associated with the lowest mortality. Discordant NSIP and discordant UIP were associated with lower mortality than those with concordant UIP, but greater mortality than those with concordant fibrotic NSIP (figure 5). Multivariable analysis demonstrated that severity of traction bronchiectasis (HR 1.07, p=0.001, 95% CI 1.01 to 1.13) and extent of honeycombing (HR 1.21, p=0.031, 95% CI 1.08 to 1.35) were the only independent variables independently associated with increased mortality in patients who underwent lung biopsy.
Observers’ radiological diagnoses and HRCT scores in patients with CTD-FLD and fibrotic NSIP or UIP on biopsy (n=51)

Kaplan-Meier survival curve for connective tissue disease related fibrotic lung disease (CTD-FLD) patients who under went surgical lung biopsy (n–41/168). Patients are separated according to radiological-histopathological diagnosis. See text for definitions.
Discussion
Our study has demonstrated three novel findings in patients with CTD-FLD. First, honeycombing and traction bronchiectasis are important HRCT predictors of mortality and traction bronchiectasis is the more powerful of the two. Second, the clinical utility of this finding is enhanced by the superior level of interobserver agreement associated with an absent/present determination for traction bronchiectasis when compared with the same determination for honeycombing. Lastly, our results suggest that in CTD-FLD, patients with a histopathological diagnosis of UIP, but discordant radiological features, have a more favourable prognosis when compared with those with radiological and histopathological UIP.
Although there is a paucity of data on HRCT patterns, which predict prognosis in CTD-FLD, several studies have identified prognostic HRCT patterns in the fibrotic (non-CTD related) IIPs.4 ,5 ,7 ,26 ,27 Many of these have demonstrated that increasing reticulation, honeycombing or a combination of both as a ‘fibrosis’ score, are associated with increasing mortality.4 ,5 ,7 ,26 More recently, two studies have demonstrated that increasing severity of traction bronchiectasis also predicts increased mortality in fibrotic IIP.3 ,5 Although it is generally accepted that the predominant histopathological patterns seen in CTD-FLD are UIP and fibrotic NSIP, for a number of reasons it is unclear if CT data derived from patients with idiopathic fibrotic lung disease can be directly applied to CTD-FLD. First, CTD-FLD does not exactly replicate idiopathic fibrotic lung disease on histopathological analysis. Fewer fibroblastic foci, prominent lymphoid germinal centres, lymphoplasmacytic infiltrates and distinctive myofibroblast morphology are distinguishing features of CTD-FLD.10 ,11 ,28 ,29 Second and most importantly, CTD-FLD appears to have a more favourable prognosis than fibrotic IIP.12 ,15 ,30 Despite these differences, our study has shown that traction bronchiectasis and honeycombing are also important predictors of mortality in CTD-FLD.
The prognostic strength of traction bronchiectasis in our study is an important finding. Honeycombing is a cardinal fibrotic pattern on CT and most studies have focused the prognostic impact of this pattern4 ,26 rather than traction bronchiectasis. However, the interobserver agreement for the identification of honeycombing is surprisingly poor,31 ,32 best highlighted by Lynch et al who reported observer agreement levels for honeycombing among expert thoracic radiologists in a cohort of 315 patients with IPF as scarcely acceptable for clinical practice (weight κ coefficient of agreement no greater than 0.31).4 More recently, Watadani et al specifically quantified interobserver agreement for the presence of honeycombing among a large group of thoracic and non-thoracic radiologists as moderate (weighted κ coefficient of agreement=0.40–0.58).33 Disagreement was in most cases due to the presence of subpleural pathology mimicking honeycombing such as traction bronchiolectasis, paraseptal emphysema and subpleural cysts. These findings raise doubts as to whether honeycombing can always be relied upon as a prognostic CT pattern in routine clinical practice. The results of our study support those of others confined to IIPs3 ,5 ,9 and suggest that traction bronchiectasis may be a superior alternative CT sign for prognostication purposes in the CTD-FLDs
Clinical applicability is an important consideration in a study of this kind. The continuous traction bronchiectasis and honeycombing scores are not easily applied to clinical practice and this led to the testing of a simplified binary absent/present score of these two patterns. Our study shows that simply the presence of traction bronchiectasis was a significantly more powerful prognostic index than the presence of honeycombing. Importantly, determining the absence or presence of traction bronchiectasis had a higher level of observer agreement than determining the absence or presence of honeycombing. In addition, the strength of these observations was preserved when each CTD individually was removed in turn, suggesting that they are applicable to all CTD-FLD regardless of the histopathological subtype of pulmonary fibrosis.
Current guidelines for the diagnosis of definite UIP on HRCT specify among other radiological criteria, that honeycombing, with or without traction bronchiectasis must be present.34 It is therefore not surprising that all patients assigned a radiological diagnosis of UIP had honeycombing on HRCT. This also explains why radiological diagnosis was a strong predictor of mortality on univariable analysis, but failed to independently predict mortality once honeycombing was accounted for. Flaherty et al demonstrated that HRCT adds prognostic information to the histopathological classification of idiopathic fibrotic lung disease into IPF and idiopathic fibrotic NSIP.27 In that study, patients with confirmed UIP on histopathology, but an indeterminate or fibrotic NSIP pattern on HRCT, had a more favourable prognosis than patients with radiological-histopathological concordant IPF. In our study, we have shown for the first time that this also holds true for patients with CTD-FLD and suggests an important prognostic role for HRCT, even when UIP has been confirmed on biopsy specimen. Furthermore, it suggests that for patients without a definite UIP pattern on HRCT, lung biopsy may be needed to provide accurate prognostic information.
We did not censor patients dying from causes other than their respiratory disease, as it has be argued that ‘all-cause mortality’ is a more clinically meaningful end point for outcome studies.35 If only patients whose death was directly related to their CTD-FLD were included, then the results of our study would only be applicable to patients who die directly as a result of their pulmonary disease, meaning that our results could not be applied to patients in clinical practice. Nevertheless, to assess the impact of non-respiratory deaths on our findings, we repeated the analysis, censoring death from other causes. This resulted in no appreciable changes in significance of predictors or magnitude of their impact on survival time estimates.
Not all patients included in this study underwent surgical lung biopsy to obtain a histospecific diagnosis. However, the central aim of this study was ‘intention to prognosticate’ in patients with a variety of connective tissue diseases and evidence of pulmonary fibrosis on HRCT. As most patients with CTD-FLD do not undergo lung biopsy for diagnostic confirmation, exclusion of these patients from the study would introduce significant selection bias and make our conclusions inapplicable to the majority of patients with CTD-FLD. Therefore we necessarily included all patients with a collaborative multidisciplinary diagnosis of CTD and evidence of fibrosis on HRCT. Furthermore, our results were preserved, regardless of which CTD subset was removed suggesting that our findings are robust in CTD-UIP and CTD-NSIP.
In conclusion, we have shown that increasing extent of honeycombing and severity of traction bronchiectasis are independently associated with increasing mortality in CTD-FLD. When expressed as a binary absent/present evaluation traction bronchiectasis provides shaper prognostic information than honeycombing and a higher level of interobserver agreement. Furthermore, for patients with CTD-FLD whose histopathological diagnosis is UIP, survival differences exist between those with a UIP pattern of disease on HRCT and those without classic UIP features on HRCT.
References
Supplementary materials
Supplementary Data
This web only file has been produced by the BMJ Publishing Group from an electronic file supplied by the author(s) and has not been edited for content.
Files in this Data Supplement:
- Data supplement 1 - Online appendix
Footnotes
-
Correction notice This article has been corrected since it was published Online First. The sentence ‘A detailed description of the HRCT protocol, scoring method and definitions of HRCT patterns can be found in the online suppository’ has been updated to read ‘A detailed description of the HRCT protocol, scoring method and definitions of HRCT patterns can be found in the online repository.’
-
Contributors Data collection, statistical analysis, MS drafting and proofing—SLFW. Data collection—GJK. Patient data analysis/HRCT scoring—NS and AD. Proofing—DMH, NS, and AUW. Statistical analysis—AUW.
-
Funding This study was supported by the NIHR Respiratory Disease Biomedical Research Unit at the Royal Brompton and Harefield NHS Foundation Trust and Imperial College London.
-
Competing interests None.
-
Ethics approval Institutional review board, Imperial College, London.
-
Provenance and peer review Not commissioned; externally peer reviewed.
-
Data sharing statement We are happy to share our data should the journal deem it necessary.