Article Text

Abstract
Objective To evaluate cardiac involvement in patients with ankylosing spondylitis using cardiac magnetic resonance (CMR).
Methods Patients with ankylosing spondylitis without cardiovascular symptoms or known cardiovascular disease were screened by transthoracic echocardiography (TTE) for participation in this exploratory CMR study. We prospectively enrolled 15 ankylosing spondylitis patients with an abnormal TTE for further tissue characterisation using late gadolinium enhancement (LGE) and T1 mapping. T1 mapping was used to calculate myocardial extracellular volume (ECV). Disease activity was assessed by C reactive protein (CRP) and erythrocyte sedimentation rate (ESR) measurements.
Results In the total of 15 included patients, 14 had a complete CMR exam (mean age 62 years, 93% male and mean disease duration 21 years). Left ventricular (LV) diastolic dysfunction was the most common finding on TTE (79%), followed by aortic root dilatation (14%), right ventricular (RV) dilatation (7%) and RV dysfunction (7%). CMR revealed focal hyperenhancement in three patients (21%), all with a particular pattern of enhancement. LV dysfunction, as defined by a LV ejection fraction below 55%, was observed in five patients (36%). Myocardial ECV was correlated with the CRP concentration (R=0.78, p<0.01) and ESR level (RS=0.73, p<0.01).
Conclusions In patients with ankylosing spondylitis, CMR with cine imaging and LGE identified global LV dysfunction and focal areas of hyperenhancement. Myocardial ECV, quantified by CMR T1 mapping, was associated with the degree of disease activity. These results may suggest the presence of cardiac involvement in ankylosing spondylitis and may show the potential of ECV as a marker for disease monitoring.
Statistics from Altmetric.com
Introduction
Ankylosing spondylitis is a chronic rheumatic inflammatory disease that affects predominantly the sacroiliac joints and spinal column. Ankylosing spondylitis is associated with increased cardiovascular mortality, with standardised mortality ratios ranging from 1.3 to 2.1 in previous studies.1 ,2 Epidemiological studies have described a higher prevalence of cardiovascular disease in patients with ankylosing spondylitis compared with the general population, especially congestive heart failure (prevalence ratio of 1.8) and ischaemic heart disease (prevalence ratio of approximately 1.3).3 In addition, several echocardiography studies have shown an increased prevalence of diastolic left ventricular (LV) dysfunction and aortic valve regurgitation in ankylosing spondylitis.4 ,5 The exact pathophysiological mechanism behind LV diastolic dysfunction in ankylosing spondylitis is not fully understood. However, it can be speculated that myocardial tissue changes, in particular diffuse inflammation and/or fibrosis, may underlie impaired LV diastolic filling and relaxation, possibly as a result of ankylosing spondylitis disease activity.
Cardiovascular magnetic resonance (CMR) is currently the gold standard for measurements of global and regional ventricular function.6 More importantly, CMR permits accurate and non-invasive characterisation of the myocardial tissue through assessment of regional oedema with T2-weighted imaging and regional fibrosis with late gadolinium enhancement (LGE) imaging.7 ,8 Recent advances in CMR also allow for objective detection of diffuse fibrosis and diffuse oedema using respectively extracellular volume (ECV) quantification and native T1 mapping or T2 mapping.9 ,10
Since echocardiography is limited in the ability to characterise the myocardial tissue, and studies using CMR have not been conducted yet, it remains uncertain whether and to what extent the myocardium is involved in ankylosing spondylitis. Therefore, we performed the first prospective CMR study to evaluate cardiac involvement in patients with ankylosing spondylitis.
Materials and methods
Patient population
Patients were recruited from a cross-sectional cohort study at the Amsterdam Rheumatology and Immunology Center, Amsterdam, The Netherlands. In this cohort, patients with ankylosing spondylitis, between 50 and 75 years old and fulfilling the modified New York criteria for ankylosing spondylitis, undergo transthoracic echocardiography (TTE).11 Patients with ankylosing spondylitis without cardiovascular symptoms or known cardiovascular disease were screened by TTE for participation in this exploratory CMR study. Between January 2015 and November 2015, we prospectively and consecutively enrolled 15 patients with ankylosing spondylitis with an abnormal TTE for further tissue characterisation using CMR.
Abnormal TTE was defined by diastolic or systolic ventricular dysfunction, ventricular dilatation, valvular disease or aortic root dilatation. LV systolic function and left atrial volume index (LAVI) were determined by two-dimensional TTE (2D-TTE) using the biplane method of discs. In agreement with previous recommendations, LV diastolic dysfunction was diagnosed by the presence of at least two of the following three echocardiographic criteria: LAVI ≥34 mL/m2; E′ septal <8 cm/s or E′ lateral <10 cm/s. In addition, diastolic dysfunction severity was graded according to transmitral E/A ratio, deceleration time and average E/e′.12 The aortic root was considered dilated if the maximal diameter at the sinuses of Valsalva was 4.1 cm or greater.13
Ankylosing spondylitis disease characteristics
Medical history was obtained of ankylosing spondylitis, including age at diagnosis, human leucocyte antigen-B27 status and medication use. Cardiovascular risk factors including hypertension, hypercholesterolaemia, diabetes mellitus and smoking were assessed. Disease activity was measured with the Ankylosing Spondylitis Disease Activity Score–C reactive protein (ASDAS–CRP).14 Quantification of spinal mobility was assessed with the Bath Ankylosing Spondylitis Metrology Index, on a 10-point scale.15 Erythrocyte sedimentation rate (ESR) and CRP were measured in blood samples that were obtained around the time of cardiovascular evaluation, and were averaged over the last five blood measurements.
CMR protocol
All patients underwent CMR imaging on a 1.5 Tesla clinical MR system (Avanto, Siemens, Erlangen, Germany). Functional imaging was performed using a balanced steady-state free precession (SSFP) sequence with retrospective gating in four-chamber, three-chamber and two-chamber long-axis and short-axis orientations (typical parameters: TR/TE 3.2/1.5 ms, flip angle 60°, voxel size 1.4×1.4×5.0 mm, temporal resolution 35–50 ms). T1 mapping was performed using a Shortened Modified Look-Locker Inversion recovery (ShMOLLI) sequence.16 T2 mapping was performed using T2-prepared SSFP images, with three different T2 preparation times, with automatic non-rigid motion correction.17 The acquisitions were performed within a breath-hold and obtained in a single midventricular purely transverse plane, with identical position for both T1 and T2 maps. At the scanner, pixel-wise T2 maps were generated by fitting to a single exponential curve, after automatic non-rigid motion registration of the three images. T1 maps were generated using the ShMOLLI algorithms.18 LGE images were acquired 10–15 min after intravenous administration of a bolus of 0.15 mmol/kg Gd-DOTA (Guerbet, Villepinte, France), in identical orientations as the cine images, using a 2D segmented inversion-recovery gradient-echo pulse sequence (typical parameters: voxel size 1.4×1.4×5.0 mm, typical inversion time 300–450 ms). T1 mapping was repeated using identical slice locations as the native T1 maps, at approximately 15 min after contrast injection for postcontrast analyses.
CMR image analysis
All analyses were performed offline in a blinded fashion using dedicated software (QMass V.7.6, Medis, Leiden, The Netherlands). Epicardial and endocardial borders were manually traced on cine short-axis slices for the measurement of LV volume, LV mass and LV ejection fraction (LVEF). Impaired LV function was defined as a LVEF <55%. For segmental analysis, the left ventricle was divided into 16 segments (according to the 17-segment American Heart Association (AHA) model, excluding the apex). Systolic wall thickening (SWT) was calculated as the percentage difference between the end-diastolic wall thickness and end-systolic wall thickness.
LGE images were evaluated by consensus agreements of two experienced CMR readers (PSB and RN). Hyperenhancement was defined as present when myocardial high signal intensity was visible in both short-axis and matching long-axis views. The extent of hyperenhancement was quantified by applying the full-width at half-maximum algorithm on LGE short-axis slices with manual tracings of epicardial and endocardial borders, and is expressed as percentage of LV mass.
T1 and T2 maps were assessed for the presence of artefacts, diaphragmatic movement and variation in cardiac cycle by examining the raw images first. In addition, the goodness-of-fit was assessed for each T1 map by using the R2 maps. On native T1 maps, a region of interest (ROI) was manually drawn within the LV septum and lateral wall, excluding any regions with focal hyperenhancement using matching LGE images. Apical segments were excluded for ROIs’ placement, because apical T1 and T2 measurements were considered to be less reliable due to partial volume effect. Another ROI was placed in the blood pool, excluding papillary muscles and trabeculae. ROIs were subsequently copied to the postcontrast T1 maps and T2 maps. Figure 1 illustrates a typical example of the different MR sequences and the size and location of the ROIs. Myocardial T1 and T2 values were derived from the mean of the septum and lateral LV wall, and also the average values were calculated. ECV was calculated from native and postcontrast T1 measurements using a correction for synthetic haematocrit, according to a previously described method.19
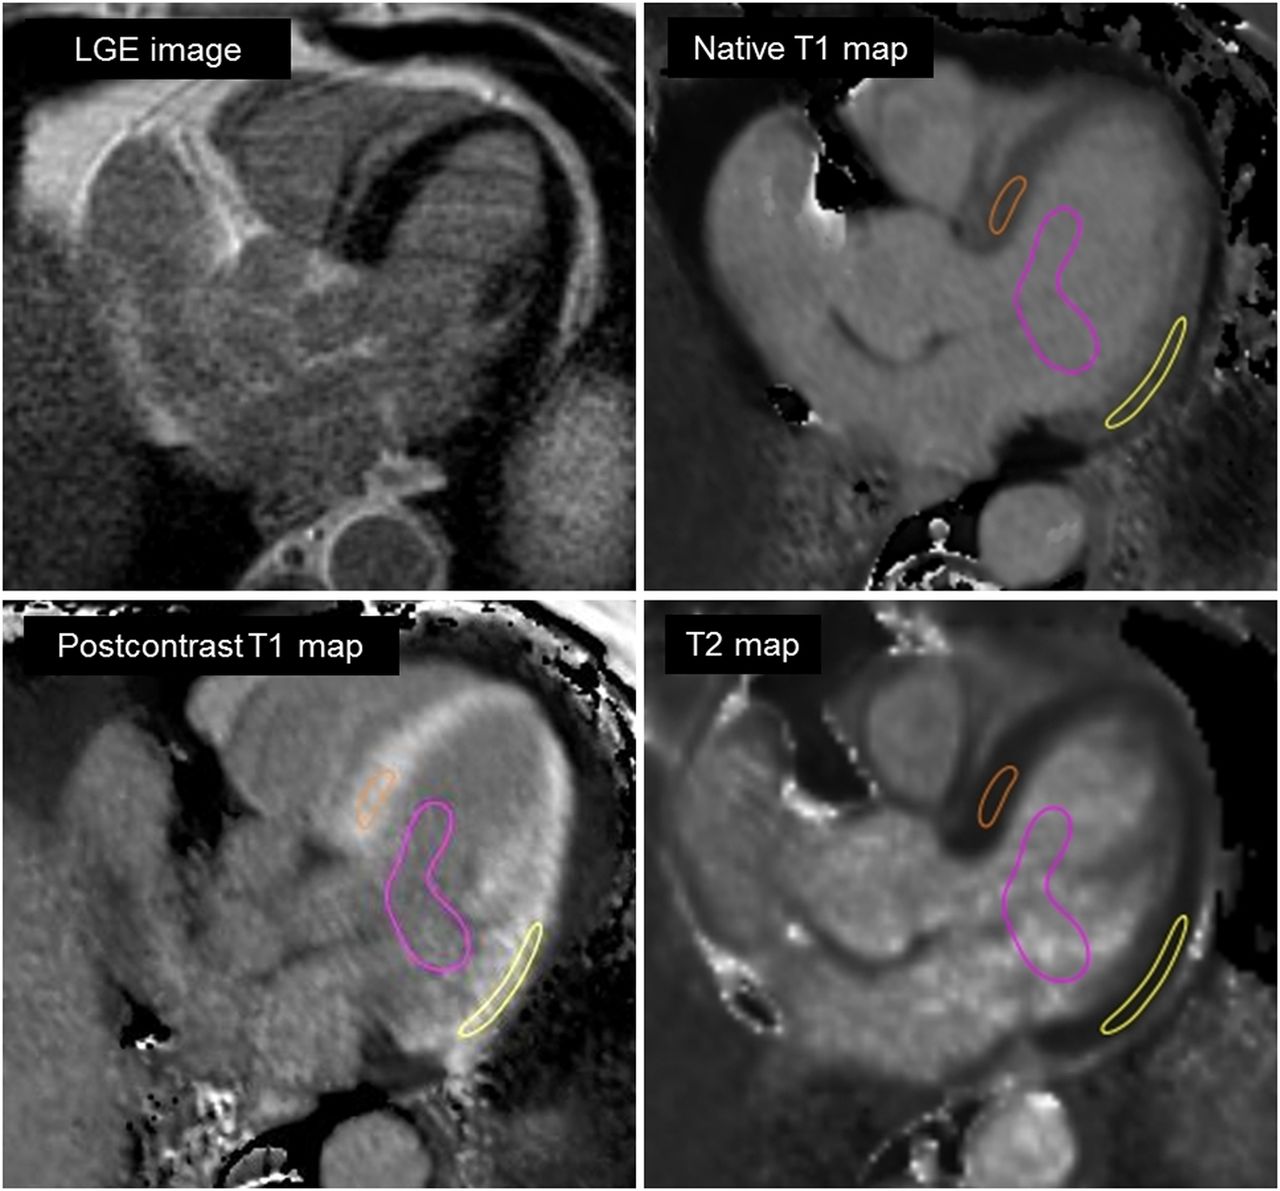
Typical location and size of the regions for T1 and T2 relaxation times assessment. LGE, late gadolinium enhancement.
Statistics
Continuous variables are presented as mean±SD for normally distributed variables, median and IQR for non-normally distributed variables. Categorical data are presented as frequencies and percentages. Histograms were used to determine if continuous data were normally distributed. CRP was log-transformed to obtain a normal distribution. Categorical values were compared between subgroups of patients using a Fisher's exact test. Differences in mean values were compared between subgroups of patients, using an independent sample’s t-test, and Mann-Whitney U test was used when data were not normally distributed. Associations between continuous variables and CRP were quantified using Pearson's correlation (R). Spearman's rank correlation (RS) was used to quantify associations with ESR, as this variable showed a skewed distribution despite log-transformation. A value of p<0.05 was considered statistically significant. All statistical analyses were performed using SPSS statistics (IBM SPSS Statistics V.22, Chicago, Illinois, USA).
Results
Patient characteristics and ankylosing spondylitis disease activity
Sixty-three patients with ankylosing spondylitis were screened by TTE when the predefined number of fifteen participants was reached. One patient was excluded from further analysis because of an incomplete CMR exam due to increasing back pain and discomfort during scanning. Ultimately, 14 patients with ankylosing spondylitis underwent a complete CMR exam and were included in the present study.
Table 1 provides the patient characteristics. The mean age of the population was 62±7 years, and the mean disease duration was 21±10 years. On TTE, 11 patients had LV diastolic dysfunction grade II, and 3 had aortic root dilatation, right ventricular (RV) dilatation or RV dysfunction, respectively. One patient with LV diastolic dysfunction also had aortic root dilatation.
Characteristics of patients with ankylosing spondylitis, overall and in subgroups with and without myocardial abnormalities
In total, six patients (43%) were currently using biologics, with a mean duration of 7.4±1.9 years. Median time-averaged CRP concentration and median time-averaged ESR level were respectively 7 mg/L (3–13 mg/L) and 5 mm/hour (3–15 mm/hour), and mean ASDAS score was 2.5±0.9.
CMR cine imaging and LGE
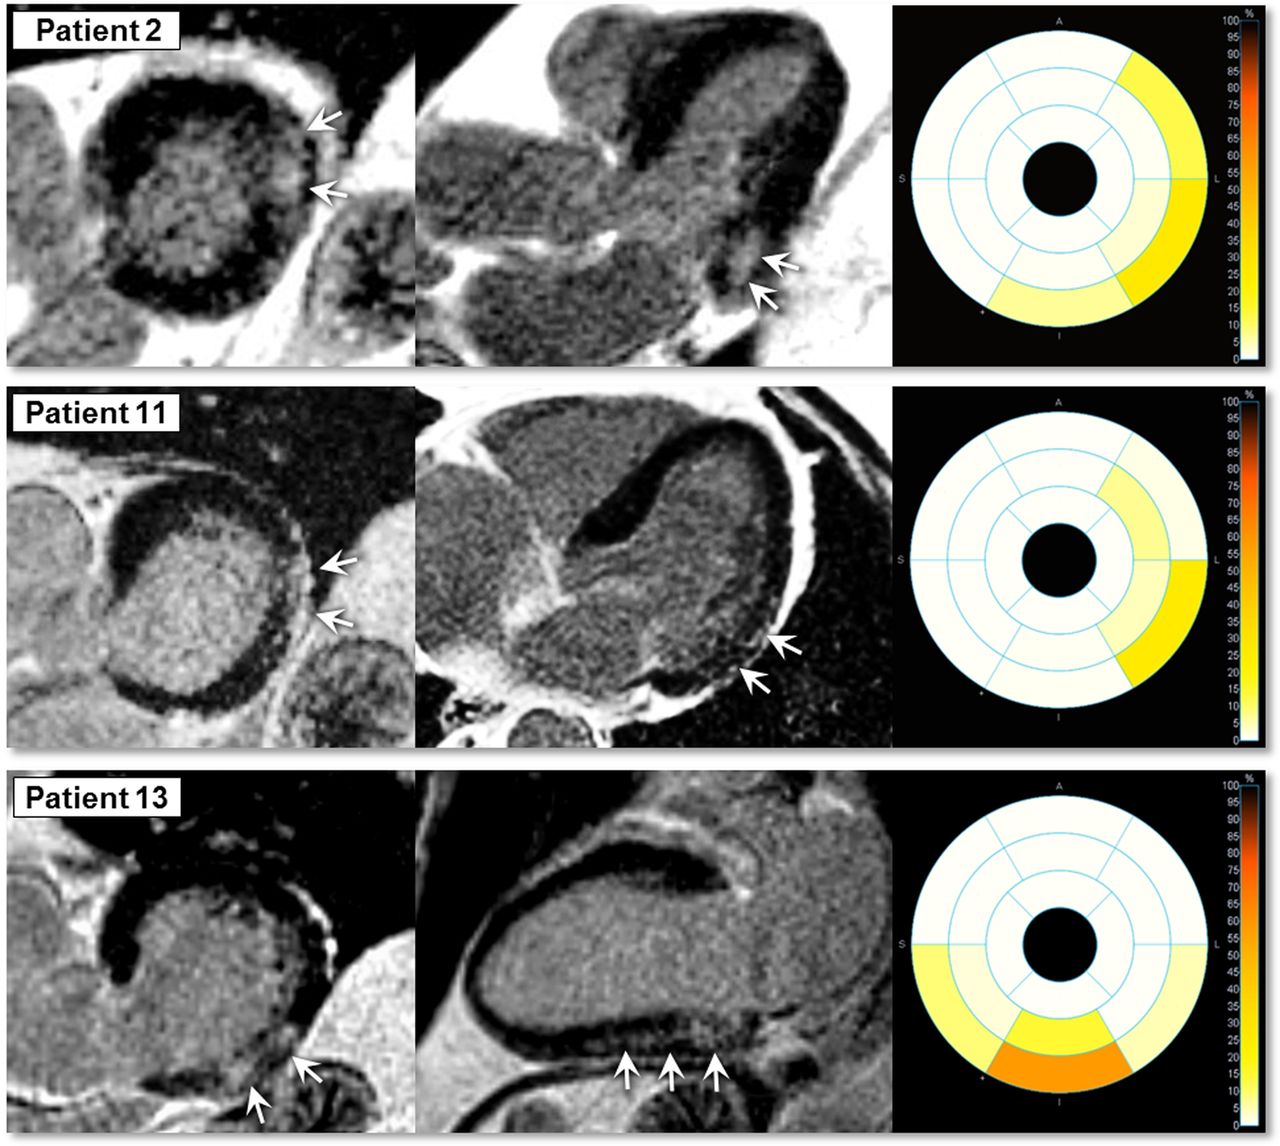
CMR findings are summarised in table 2. Mean LVEF was 54±6%, and was impaired in five patients (36%). Hyperenhancement was found on the LGE images in three patients (21%). All three had a particular pattern of myocardial enhancement, with midwall to subepicardial hyperenhancement localised in the basal inferior and inferolateral LV walls (figure 2). The size of the hyperenhancement ranged from 2.6% to 5.4% of the total LV mass.
Cardiovascular magnetic resonance findings

Late gadolinium enhancement images in three patients with hyperenhancement. Top panel (patient 2): a 70-year-old male, diagnosed with ankylosing spondylitis since 24 years; second panel (patient 11): a 74-year-old male, diagnosed with ankylosing spondylitis since 16 years; third panel (patient 13): a 65-year-old male, diagnosed with ankylosing spondylitis since 42 years.
Of the five patients with impaired global LV function, two were LGE-positive. LVEF was significantly lower in LGE-positive patients (47±8%) than in LGE-negative patients (56±5%, p=0.03). Within the group of patients with hyperenhancement, SWT was lower in myocardial segments with hyperenhancement, but did not reach significance in comparison with segments without hyperenhancement (66±21 vs 76±21%, respectively, p=0.19).
Table 1 shows the comparison of patient characteristics between patients with and without myocardial abnormalities as detected by cine imaging and LGE. Mean disease duration was higher in patients with LGE and/or LV dysfunction than in patients without LGE and LV dysfunction (respectively 27±11 vs 18±8 years), but the difference was not statistically significant (p=0.11).
CMR tissue relaxation mapping
Myocardial tissue parameters are summarised in table 2. Although hyperenhancement was predominantly observed in the basal lateral wall, there were no significant differences found in mean native T1, T2 and ECV between the LV septum and lateral wall (p=0.52, p=0.29 and p=0.28, respectively) in areas without hyperenhancement. Furthermore, LGE-positive and LGE-negative patients showed comparable average values of native T1 (922±27 vs 930±32, p=0.79), T2 (53±1 vs 52±3, p=0.19) and ECV (29.6±1.7 vs 28.3±2.7, p=0.46).
To explore whether ankylosing spondylitis disease activity was related to cardiac involvement, myocardial tissue parameters were correlated to time-averaged CRP concentration and time-averaged ESR level. Myocardial native T1 and T2 values did not show significant correlations with CRP concentration (native T1: R=0.20, p=0.49; T2: R=0.36, p=0.20) or ESR level (native T1: RS=0.49, p=0.08; T2: RS=0.28, p=0.33), suggesting a lack of correlation between ankylosing spondylitis disease activity and potential inflammatory-related myocardial oedema.
In contrast, however, myocardial ECV values were significantly correlated with CRP concentration (R=0.78, p<0.01) and ESR level (RS=0.73, p<0.01) (figures 3 and 4), suggesting that ankylosing spondylitis disease activity is related to expansion of the myocardial ECV, possible due to diffuse fibrosis. The significant associations of ECV with CRP and ESR were found for ECV both at the septum (CRP: R=0.67, p<0.01; ESR: RS=0.60, p=0.02) and at the lateral LV wall (CRP: R=0.76, p<0.01; ESR: RS=0.72, p<0.01). Moreover, ECV remained independently associated with CRP and ESR even after correcting for the presence of hyperenhancement on the LGE images (p<0.01).
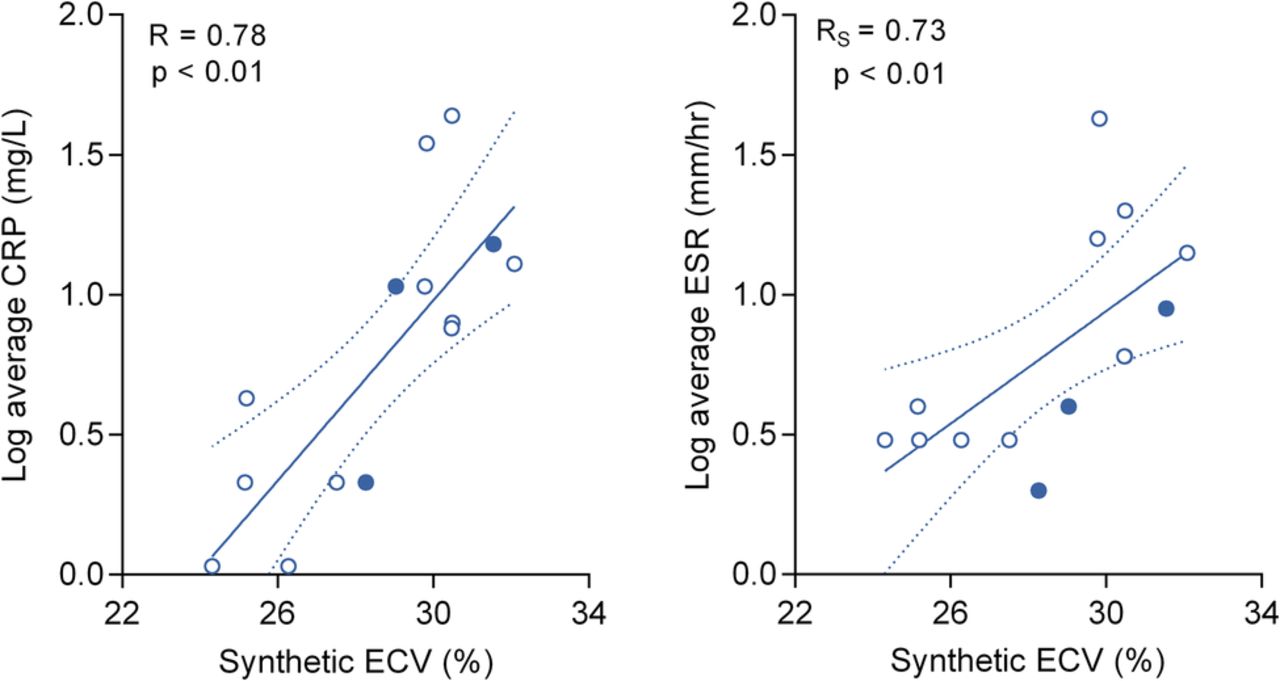
Correlation of myocardial ECV to the log of C reactive protein (CRP) and the log of erythrocyte sedimentation rate (ESR). Open dots indicate late gadolinium enhancement (LGE)-negative patients. Filled dots indicate LGE-positive patients. Dotted lines represent 95% confidence band. ECV, extracellular volume.

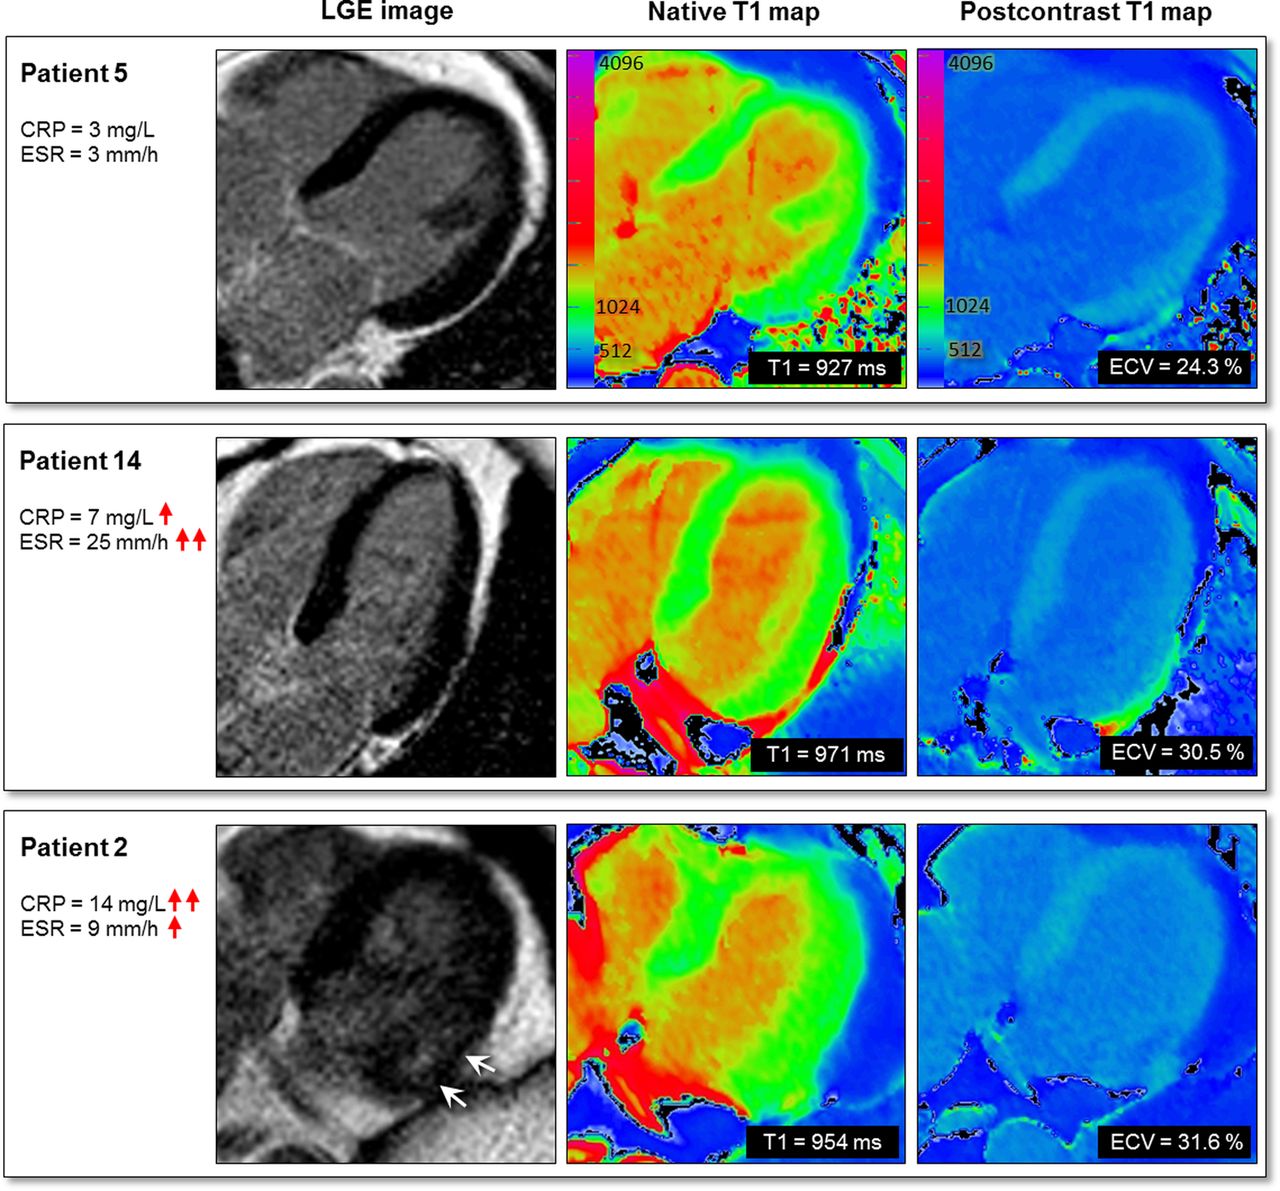
Representative examples of matching late gadolinium enhancement (LGE) images and T1 maps with corresponding disease activity in patients with ankylosing spondylitis. Top panel (patient 5): patient with low disease activity (C reactive protein (CRP) 3 mg/L, erythrocyte sedimentation rate (ESR) 3 mm/hour), no hyperenhancement on the LGE images, native T1 927 ms, postcontrast T1 510 ms, extracellular volume (ECV) 24.3%; second panel (patient 14): patient with increased disease activity (CRP 7 mg/L, ESR 25 mm/hour), no hyperenhancement on the LGE images, native T1 971 ms, postcontrast T1 490 ms, ECV 30.5%; third panel (patient 2): patient with increased disease activity (CRP 14 mg/L, ESR 9 mm/hour), hyperenhancement in the basal lateral wall, native T1 954, postcontrast T1 508 ms, ECV 31.6% (measured outside the hyperenhanced area).
Comparison of TTE and CMR findings
Table 3 demonstrates the comparison of TTE findings and CMR findings for each patient. Three patients had normal LV diastolic function on TTE. Interestingly, CMR revealed both an impaired LV function and hyperenhancement in one patient, and impaired LV function without hyperenhancement in another. The third patient showed no myocardial abnormalities. In four patients, LVEF could not be determined by 2D-TTE because of poor echocardiographic windows. In two of these patients, CMR revealed impaired LV function. In addition, CMR revealed impaired LV function in two of seven patients (29%) with normal LV function according to 2D-TTE. Two patients had aortic root dilatation (4.1 cm) according to TTE, but normal aortic root dimensions measured by CMR. Three patients had echocardiographically measured normal aortic dimensions, but either aortic root dilatation or ascending aorta dilatation according to CMR.
Comparison of echocardiographic and cardiovascular magnetic resonance findings
Discussion
This explorative study was conducted to determine the presence and extent of cardiac involvement in patients with ankylosing spondylitis, using CMR. We have shown for the first time in patients with ankylosing spondylitis that CMR with cine imaging and LGE can identify global LV dysfunction and particular areas of myocardial hyperenhancement, and that myocardial ECV, quantified by CMR T1 mapping, was associated with the degree of disease activity.
CMR with LGE identified focal areas of hyperenhancement in ankylosing spondylitis
In the present study, hyperenhancement was found on the LGE images in three patients (21%). Hyperenhancement on a LGE image is caused by accumulation of Gd-based contrast within areas of ECV expansion, which, in most chronic diseases, reflects focal fibrosis. The LGE-positive patients in our study all demonstrated a typical pattern of LGE, with hyperenhancement localised in the midwall to subepicardial layer. This pattern closely resembles previous findings in other autoimmune diseases such as rheumatoid arthritis,20 systemic lupus erythematosus21 and systemic sclerosis,22 and can also be seen in other inflammatory cardiomyopathies.23 In addition to the diagnostic significance, LGE might also have important prognostic implications. Previous studies in patients with non-ischaemic cardiomyopathies show that the presence and extent of LGE can predict adverse cardiac outcomes.24 Considering the small sample size, further studies within a larger patient group and with long-term follow-up are needed to determine the prognostic implications of LGE in ankylosing spondylitis.
Association between myocardial ECV and disease activity
In addition to LGE imaging, we performed T1 and T2 mapping to characterise the myocardium more quantitatively. Conventional CMR methods, including LGE imaging, only show differences between affected and non-affected tissues, and may therefore fail to detect global myocardial disease. In contrast, T1 and T2 mapping permits measuring the myocardial relaxation times at a pixel level. We expected to find a correlation between ankylosing spondylitis disease activity and inflammatory-related myocardial oedema, as assessed by native T1 and T2 measurements. Although native T1 and T2 values were higher with increasing disease activity, their correlation was not statistically significant. This lack of significance might be caused by the sample size. On the other hand, we did show that myocardial ECV, a marker of diffuse interstitial fibrosis, is indeed correlated to ankylosing spondylitis disease activity. Myocardial ECV values were strongly correlated to inflammatory markers. Possibly, ankylosing spondylitis disease activity is related to diffuse interstitial fibrosis as suggested by our ECV measurements. This is supported by a previous study showing a diffuse increase of interstitial connective tissue in postmortem hearts of patients with ankylosing spondylitis.25 Also, there is increasing evidence indicating that interstitial fibrosis can develop as a complication of inflammation.26 During pathological conditions, inflammatory cells can invade into the heart and may release cytokines that activate fibroblasts, ultimately leading to myocardial fibrosis.27 One of the most important known cytokines in the development of inflammation-driven fibrosis is transforming growth factor β, which has been shown to exert synergistic effects on the induction of collagen gene expression and inhibition of the collagen degradation system.28 Furthermore, the high prevalence of LV diastolic dysfunction in our study population, and in patients with ankylosing spondylitis in general, also supports the presence of diffuse interstitial fibrosis.4 It is currently believed that myocardial fibrosis can contribute to high LV diastolic stiffness, which can ultimately lead to impairment of ventricular relaxation and filling.29 Future research with appropriate study size is required to investigate the contribution of myocardial inflammation and fibrosis to changes in LV diastolic function in ankylosing spondylitis.
Clinical implications
The present study has several clinical implications. First, findings of our study may suggest the presence of cardiac involvement in ankylosing spondylitis. Ankylosing spondylitis affects up to 32 in 10 000 adults worldwide, and it is estimated that, in Europe alone, over 1.3 million people are currently suffering from ankylosing spondylitis.30 It is known that patients with ankylosing spondylitis have overall an increased mortality rate, primarily due to an increase in cardiovascular disease, including cardiomyopathy. Early diagnosis and treatment of cardiac involvement could therefore potentially reduce cardiac mortality in this patient group. Second, our study shows a high prevalence of myocardial abnormalities in patients with ankylosing spondylitis who were referred for CMR because of abnormal echocardiography findings, of which LV diastolic dysfunction was the primary abnormality. Even more interestingly, also patients without LV diastolic dysfunction showed myocardial abnormalities on CMR imaging, suggesting that CMR has incremental value compared with TTE for evaluating cardiac involvement in ankylosing spondylitis.
Study limitations
Due to the explorative nature of this study, the sample size of our study population was relatively small. As a consequence, we cannot rule out that non-significant differences or correlations were caused by a lack of statistical power. Despite the limited sample size, we found global LV dysfunction and focal areas of hyperenhancement in patients with ankylosing spondylitis using CMR. Second, only patients with echocardiographic signs of myocardial disease are included in the present study, and therefore the results might not be extrapolated to the total population with ankylosing spondylitis. Nevertheless, results from this first CMR study in ankylosing spondylitis may suggest the presence of cardiac involvement, which warrants further studies with larger sample sizes to determine the prevalence of cardiac involvement in the total group of patients with ankylosing spondylitis.
Conclusions
In asymptomatic patients with ankylosing spondylitis, CMR with cine imaging and LGE identified global LV dysfunction and focal areas of hyperenhancement. Myocardial ECV, quantified by CMR T1 mapping, was associated with the degree of disease activity. Results from this first CMR study in ankylosing spondylitis may suggest the presence of cardiac involvement in the disease. Future larger studies with follow-up are needed to establish the prevalence and significance of cardiac pathology in ankylosing spondylitis and to establish the potential of ECV as a marker for disease monitoring.
Key messages
What is already known on this subject?
Patients with ankylosing spondylitis have an overall increased mortality rate, primarily due to an increase in cardiovascular disease.
What might this study add?
In patients with ankylosing spondylitis, cardiac magnetic resonance (CMR) with cine imaging and LGE identified global left ventricular dysfunction and focal areas of hyperenhancement. Myocardial extracellular volume (ECV), quantified by CMR T1 mapping, was associated with the degree of disease activity.
How might this impact on clinical practice?
Results from this study may suggest the presence of cardiac involvement in ankylosing spondylitis and may show the potential of ECV as a marker for disease monitoring.
Acknowledgments
The authors would like to thank Dr Andreas Greiser (Siemens AG, Erlangen, Germany) for providing works in progress packages for T2 imaging, and Dr Stefan Piechnik (University of Oxford) for providing the ShMOLLI sequence.
References
Footnotes
PSB and SCH contributed equally to this paper.
Contributors All authors made substantial contributions to the work, critically reviewed the manuscript for important intellectual content and gave approval for its final version to be published. Specifically, PSB, SCH, MJLP, YMS, MTN and RN made substantial contributions to the conception or design of the work. PSB and SCH wrote the manuscript. SCH recruited study participants from the outpatient clinic and collected disease characteristics. PSB scheduled patients for CMR and supervised the CMR exams. PSB and RN analysed CMR data. TCK and OK acquired and analysed echocardiographic data. PSB, SCH, PMvdV and RN interpreted the data.
Funding Dutch Arthritis Foundation (Reumafonds).
Competing interests None declared.
Ethics approval Ethics Committee of the Slotervaart Hospital and Reade, Amsterdam, The Netherlands.
Provenance and peer review Not commissioned; externally peer reviewed.
Patient consent Obtained.