Article Text

Abstract
Objectives For most gout patients, excruciatingly painful gout attacks are the major clinical burden of the disease. The goal of this study was to assess the association of frequent gout flares with healthcare burden, and to quantify how much lower gout-related costs and resource use are for those with infrequent flares compared to frequent gout flares.
Design Retrospective cohort study.
Setting Administrative claims data from a large US health plan.
Participants Patients aged 18 years or above, and with evidence of gout based on medical and pharmacy claims between January 2009 and April 2012 were eligible for inclusion. Patient characteristics were assessed during a 12-month baseline period.
Outcome measures Frequency of gout flares, healthcare costs and resource utilisation were assessed in the 12 months following the first qualifying gout claim. Generalised linear models were employed to assess the impact of flare frequency on cost outcomes after adjusting for covariates.
Results 102 703 patients with gout met study inclusion criteria; 89 201 had 0–1 gout flares, 9714 had 2 flares, and 3788 had 3+ flares. Average counts of gout-related inpatient stays, emergency room visits and ambulatory visits were higher among patients with 2 or 3+ flares, compared to those with 0–1 flares (all p<0.001). Adjusted annual gout-related costs were $1804, $3014 and $4363 in those with 0–1, 2 and 3+ gout flares, respectively (p<0.001 comparing 0–1 flares to 2 or 3+ flares).
Conclusions Gout-related costs and resource use were lower for those with infrequent flares, suggesting significant cost benefit to a gout management plan that has a goal of reducing flare frequency.
- gout
- flares
- costs
- resource use
- managed care
This is an Open Access article distributed in accordance with the Creative Commons Attribution Non Commercial (CC BY-NC 4.0) license, which permits others to distribute, remix, adapt, build upon this work non-commercially, and license their derivative works on different terms, provided the original work is properly cited and the use is non-commercial. See: http://creativecommons.org/licenses/by-nc/4.0/
Statistics from Altmetric.com
Strengths and limitations of this study
A large managed care population was used to examine the association between frequent gout flares and healthcare burden.
We found that follow-up gout-related healthcare costs and counts of gout-related inpatient stays, emergency room visits and ambulatory visits were higher among patients with ≥2 flares (vs those with <2 flares).
These findings demonstrate the importance of gout management from a health-economics perspective.
Medical claims data are valuable for examining healthcare costs and resource use in a real-world setting; however, the claims-based algorithms used here should be validated in future studies.
Introduction
Gout is the most common inflammatory arthritis in the USA, with a prevalence of about 3.9%, or 8.3 million individuals.1 For most patients, excruciatingly painful gout attacks are the major clinical burden of the disease. Approximately 60% of patients experience a recurrent gout flare within 1 year after an initial event, and 78% experience a recurrent flare within 2 years.2 It is recommended that patients should be treated to achieve an serum uric acid (sUA) goal of <6.0 mg/dL to manage symptoms and reduce acute gout attacks.3 ,4 sUA levels higher than this goal have been associated with increased risk of flares, and compliance with gout medication has been associated with achieving lower sUA levels.5 ,6
Findings from several studies suggest that gout is associated with a substantial economic burden in the USA. Total annual direct medical costs related to gout in the USA have been estimated at about $4 billion, and total annual indirect costs at $2.6 billion.7 It has been shown that patients with gout have higher average medical costs and healthcare utilisation than patients without gout.8 ,9 Further, gout patients with poorly controlled sUA levels incur on average higher healthcare costs than patients whose sUA levels are better controlled, and patients with higher sUA levels incur higher average medical costs related to gout flares, compared to patients with lower sUA levels.5 ,10 Given the heavy societal burden of gout, there is a need to accurately understand the impact of acute gout attacks on health service utilisation and costs. The objective of the present study was to quantify the association between frequent flares and healthcare burden among patients with gout.
Methods
Data source and patient identification
This was a retrospective study using medical claims, pharmacy claims and enrolment information from a large national health plan database. Laboratory results for blood-based tests were linked to claims data in the research database for a subset of the study population. The data have been used previously for the analysis of care patterns, drug treatment, costs of care and outcomes in gout. This study included commercial and Medicare Advantage health plan members with claims indicating gout between 1 January 2009 and 30 April 2012. Patients were eligible for study inclusion if they met the criteria for any one of the following claims-based identification algorithms. Algorithm 1: A patient had ≥1 medical claim with an The International Classification of Diseases, Ninth Revision, Clinical Modification (ICD-9-CM) diagnosis code for gout (274.xx) in any position and ≥1 pharmacy prescription or medical claim for a urate-lowering medication (allopurinol, febuxostat, probenecid, colchicine, probenecid/colchicine, sulfinpyrazone or pegloticase). Algorithm 2: A patient had ≥2 medical claims on separate dates with a diagnosis code for gout in any position. Algorithm 3: A patient had ≥1 medical claim with a diagnosis code for gout in any position and ≥1 pharmacy or medical claim for non-steroidal anti-inflammatory drugs (NSAIDs) or corticosteroids within 7 days of the gout diagnosis.
Patients were identified with the above algorithms hierarchically. For patients who met the criteria for the first algorithm, the index date was defined as the date of the first qualifying claim for either gout diagnosis or medication. For patients who did not meet the criteria for the first algorithm, the index date was defined similarly by the second or third algorithm. To be included in the study, all patients were required to be aged ≥18 years as per the index year, and patients were required to have 12 months of continuous enrolment in the health plan prior to the index date (baseline period) and following the index date (follow-up period). Patients were excluded if they had evidence of cancer or transplant during the baseline or follow-up period.
Patient characteristics
Age was defined by index year, and gender and geographic region were captured from enrolment information. Patients with missing demographic data were not included in the study. Comorbid conditions were identified based on the presence of diagnosis codes on medical claims in the baseline period, and the Quan-Charlson comorbidity score was calculated.11 ,12 Evidence of renal impairment was identified based on diagnosis codes, procedure codes, and/or revenue codes appearing in the baseline period (including claims for kidney failure, end-stage renal disease or chronic kidney disease). Alternatively, in patients with available baseline serum creatinine laboratory results, evidence of renal impairment was determined using a glomerular filtration rate calculation.13 Baseline sUA level was defined as the sUA laboratory result on or preceding and closest chronologically to the index date. Patient ethnicity and net worth information were captured from linked socioeconomic status data, licensed from a commercial firm (KBM Group, Richardson, Texas, USA). Ethnicity was assigned based on imputation using Census data specific to geographic location and name recognition algorithms incorporating the first, middle and last names (eg, certain names or prefixes or suffixes of surnames are unique to a given ethnicity). Net worth data were determined using self-report, modelling, and census data. Use of urate-lowering medications in the follow-up period and new initiation of urate-lowering medications in the follow-up period were assessed using claims data.
Identification of flares
For patients included in the study, flares were counted during the follow-up period (including the index date) using either of the two following algorithms. Flare Algorithm 1: Presence of a flare was defined if a patient had ≥1 medical claim with a diagnosis for gout in any position from a physician office, outpatient hospital or emergency department (ED) visit or inpatient hospital stay followed within 7 days by one of the following: a pharmacy claim for an oral or non-oral NSAID; a pharmacy claim for oral or injected colchicine (excluding probenecid/colchicine combination therapy, which is indicated for chronic gout); a pharmacy claim for an oral or non-oral corticosteroid; a medical claim with a procedure code for NSAIDs, colchicine, or a corticosteroid; or a medical claim with a procedure code for joint aspiration/drainage. Flare Algorithm 2: Presence of a flare was defined if a patient had ≥1 medical claim with an ICD-9-CM diagnosis code for joint pain (719.4×) in any position from a physician office, outpatient hospital, or ED visit or inpatient hospital stay, followed within 7 days by a prescription drug claim or medical claim with a procedure code for oral or injected colchicine (excluding probenecid/colchicine combination therapy). Once a gout flare was established it was assumed that it could last for up to 30 days and thus, no other flares were counted during this 30-day period.14 The total count of flares in the 12-month follow-up period was calculated for each patient.
Healthcare costs and resource use
Healthcare costs were computed using medical and pharmacy claims data as the combined health plan and patient paid amounts during the baseline and follow-up periods. Additionally, payments from Medicare (and other payers) were estimated based on coordination of benefits information obtained by the health plan and incorporated into the study. Costs were adjusted using the annual medical care component of the Consumer Price Index to reflect inflation. Healthcare resource utilisation was calculated for ambulatory visits (office and outpatient), emergency room visits, and inpatient admissions. Costs and resource utilisation were defined as ‘gout-related’ if the claim had a diagnosis for gout in any position, or (in the calculation of costs) if a pharmacy claim was for allopurinol, febuxostat, probenecid, pegloticase, colchicine, probenecid/colchicine, sulfinpyrazone, corticosteroids or NSAIDS.
Statistical analysis
Data extraction and statistical analysis were performed using SAS V.9.2 (SAS Institute Inc., Cary, North Carolina, USA). All patient characteristics and study outcomes were compared descriptively between a cohort of patients with 0–1 gout flares, and cohorts of patients with 2 gout flares or 3 or more gout flares using t tests or χ2 tests.15 The relationship between patient characteristics and the count of gout flares was assessed using a negative binomial regression model. Total all-cause and gout-related follow-up costs were assessed using generalised linear models with a γ distribution and a log link, which avoids potential difficulties introduced by transformation and retransformation of the dependent variable.16 ,17 For ease of interpretation, the average predicted costs were calculated for each cohort.
Results
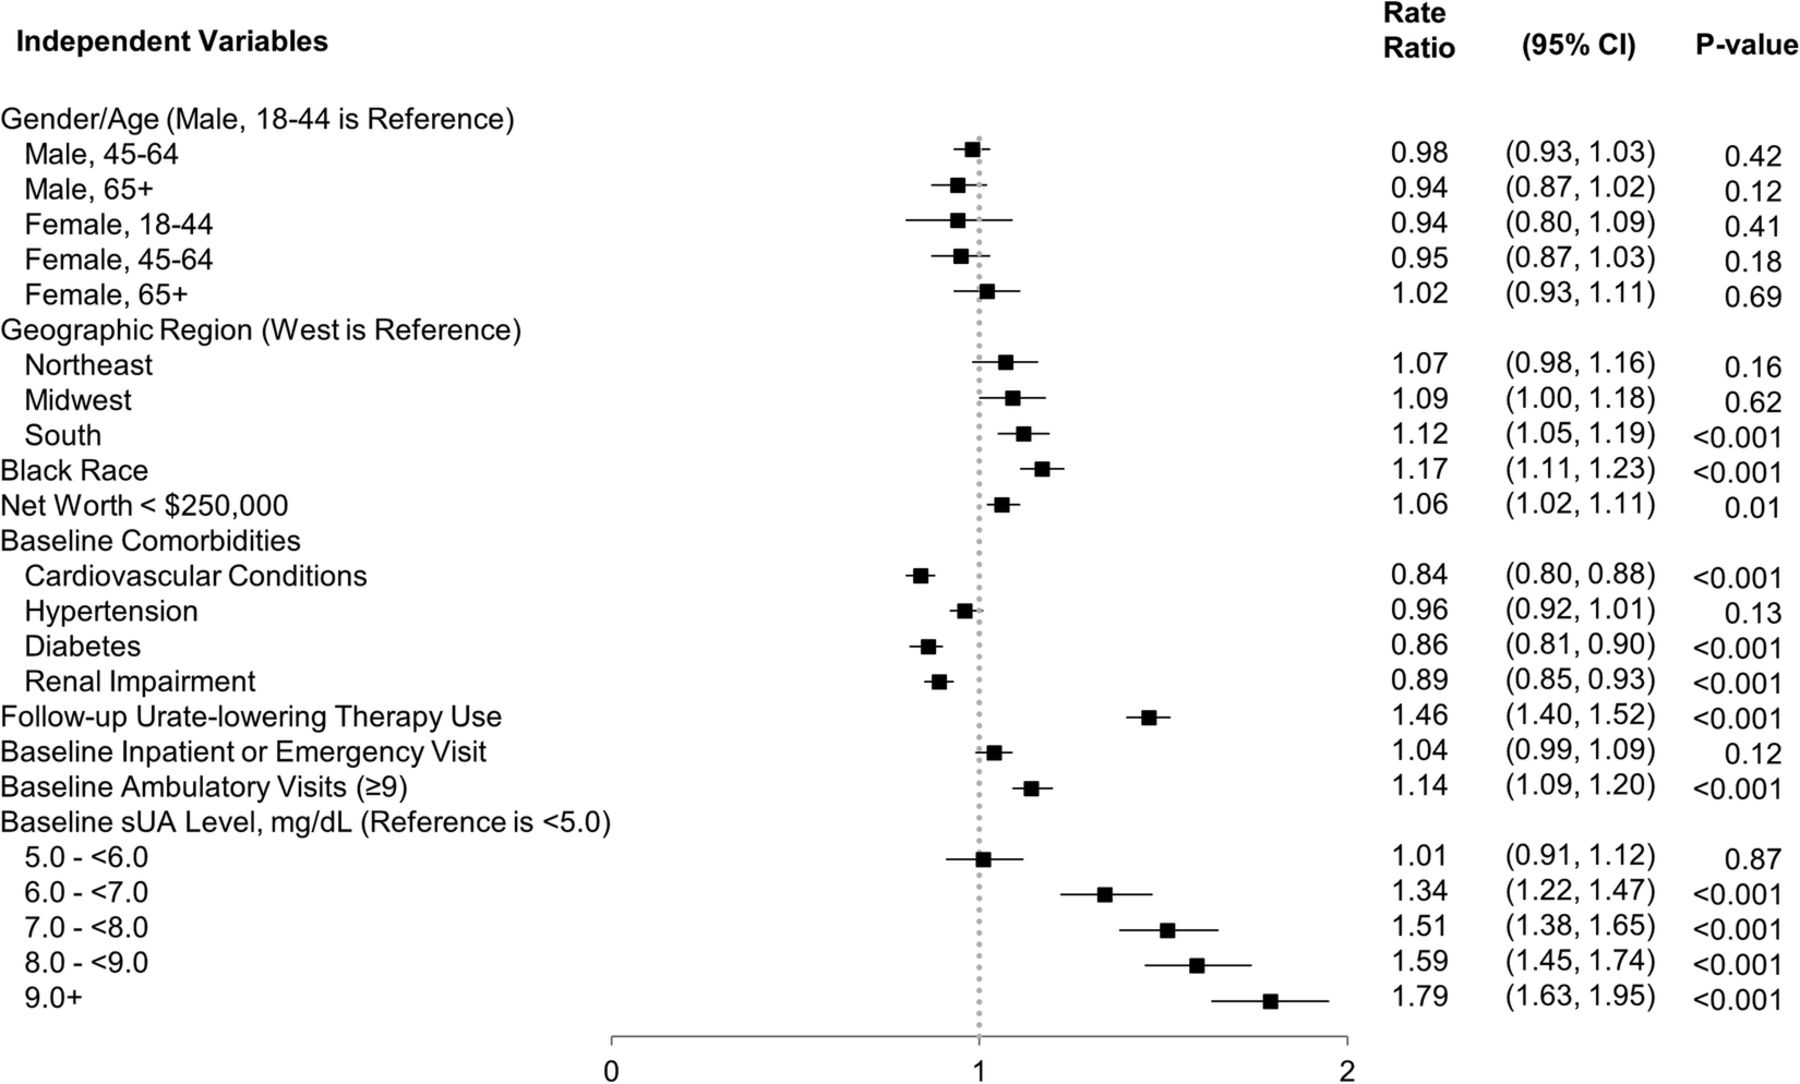
Of the 23 619 150 commercial and Medicare enrollees in the database from 1 January 2009 to 30 April 2012, 280 555 met the gout identification criteria. Of these, 127 296 had continuous health plan enrolment during the baseline and follow-up periods. Another 24 593 patients were lost due to incomplete demographic information or evidence of cancer or transplant during the baseline or follow-up periods, resulting in a final sample of 102 703 gout patients, who were selected for study inclusion. The mean age of patients was 58 years, and 77% of patients were male (table 1). In total, 55.1% of the population had flares during the follow-up period. The number of flares per patient during the 1 year follow-up period ranged from 0 flares to 9 flares, and on average patients had 0.73 flares. Patients were grouped into three cohorts based on the number of flares they experienced during the follow-up period: 0–1 flares (89 201 patients); 2 flares (9714 patients); and 3 or more flares (3788 patients). For patients with more than one flare, the average time between flares was 115 days. Table 1 displays the distribution of demographics and characteristics according to the frequency of flares in the follow-up period. In a negative binomial regression model, several characteristics were independently associated with higher flare frequency in the follow-up period, including residing in the South region (vs the West or Other geographic regions); Black ethnicity (vs all other races); a net worth of less than $250 000; baseline sUA≥6.0 mg/dL; initiation of urate-lowering therapy during the follow-up period; and frequent all-cause ambulatory visits (over 8) during the baseline period (figure 1). However, presence of renal impairment, cardiovascular disease (other than hypertension) or diabetes during the baseline period was associated with a lower number of follow-up flares (figure 1).
Baseline characteristics of 102 703 patients with gout

Generalised linear model of follow-up flare count.
All-cause healthcare resource utilisation and costs were calculated for the cohorts during the follow-up period. Proportions of patients with all-cause inpatient stays, emergency room (ER) visits and ambulatory visits, and average counts of stays and visits per patient were all significantly higher among patients in the 3+ flares cohort or 2 flares cohort than in the 0–1 flares cohort (table 2). Average follow-up all-cause total costs among patients in the 3+ flares, 2 flares, and 0–1 flares cohorts were $14 824, $12 101 and $11 839, respectively (table 2). The cost difference was significant for patients in the 3+ flares cohort versus the 0–1 flares cohort (p<0.001).
Follow-up all-cause health care resource utilisation and costs
Gout-related healthcare resource utilisation and costs were compared among the cohorts during the follow-up period. Measures of follow-up gout-related healthcare utilisation for inpatient stays, ER visits and ambulatory visits were all significantly higher among patients in the 3+ flares cohort or 2 flares cohort versus the 0–1 flares cohort (all p<0.001) (table 3). Average follow-up gout-related total costs were significantly higher among patients with 3+ flares versus those with 0–1 flares ($4490 vs $1792, p<0.001), and among patients with 2 flares versus those with 0–1 flares ($2939 vs $1792, p<0.001) (table 3). Most subcategories of costs (ambulatory, ER, inpatient and pharmacy costs) were also higher among patients with 3+ flares or 2 flares versus those with 0–1 flares (table 3). In a subgroup analysis, we found that average follow-up gout-related total costs were slightly higher among patients with 0 flares compared to patients with 1 flare ($2022 vs $1545, p<0.001), but median follow-up gout-related total costs were lower among patients with 0 vs 1 flare ($175 vs $242, p<0.001). In comparisons to patients with frequent flares (2 or more), patients with either 0 flares or 1 flare had significantly lower average and median follow-up gout-related total costs (all p values<0.001).
Follow-up gout-related health care resource utilisation and costs
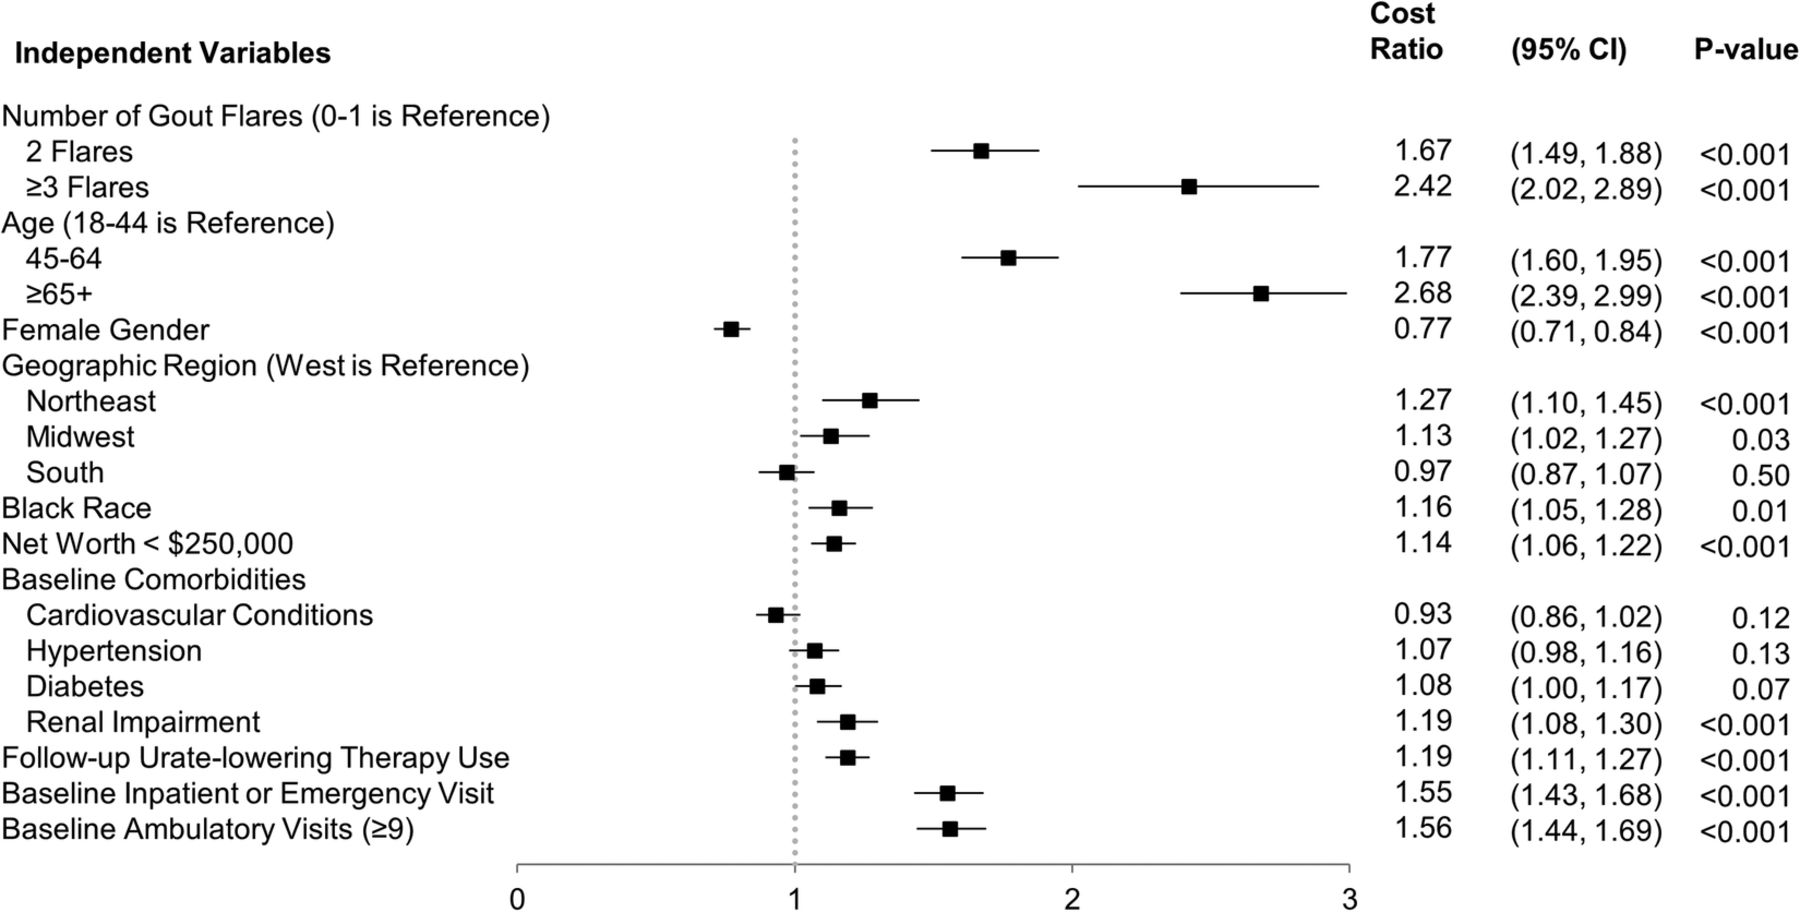
In a generalised linear model, patients with 3+ flares (cost ratio=2.418, p<0.001) and 2 flares (cost ratio=1.671, p<0.001) had significantly higher follow-up gout-related total healthcare costs than patients with 0–1 flares (figure 2). Characteristics associated with significantly higher follow-up gout-related total healthcare costs were older age; male gender; residing in the Northeast or Midwest regions (vs the West or Other geographic regions); Black ethnicity (vs all other races); a net worth of less than $250 000; baseline renal impairment; use of urate-lowering therapy during the follow-up period; any baseline occurrence of all-cause inpatient or ER visits; and frequent ambulatory visits (over 8) during the baseline period (figure 2). Mean adjusted gout-related costs were $1804, $3014 and $4363 in patients with 0–1, 2 or 3+ flares, respectively (p<0.001 comparing 0–1 flares to 2 or 3+ flares). Adjusted gout-related healthcare costs were 67% higher in those with 2 flares and over 140% higher in those with 3 or more flares compared to those with infrequent flares (0–1).
Generalised linear model of follow-up gout-related total health care costs.
Discussion
In this study, we examined the relationship between frequent gout flares and healthcare costs/resource utilisation in a commercially insured and Medicare Advantage population. Although it might be assumed that patients with frequent flares would have higher costs, our study sought to quantify the healthcare costs and compare these among different cohorts to understand the magnitude of the difference. We found that average annual gout-related total healthcare costs (unadjusted) were higher among patients with either 3+ flares ($4490) or 2 flares ($2939) versus those with 0–1 flares ($1792, both comparisons p<0.001). Also, as expected, counts of gout-related inpatient stays, ER visits and ambulatory visits were significantly higher among patients in the 3+ flares and 2 flares cohort versus the 0–1 flares cohort. In a subgroup analysis, average annual gout-related total healthcare costs were slightly higher among patients with 0 flares compared to patients with 1 flare ($2022 vs $1545, p<0.001), but median costs were lower ($175 vs $242, p<0.001). However, average costs for each of these groups (0 or 1) were significantly lower than costs for patients with frequent flares. These findings suggest that the cost of gout disease management for patients who experience just 1 flare annually is similar to those who do not experience a flare. In comparison, average annual gout-related total healthcare costs were about twofold to threefold higher among those with 3+ flares compared to those with 0 or 1 flares, demonstrating that the economic burden of disease for patients with frequent flares is substantially higher than for those with infrequent flares.
We observed a high flare count (three or more during the follow-up period) among 3.7% of patients in the study population. This is consistent with previous studies that used claims-based algorithms to identify gout patients and flares, which found that only 2–3% of patients with gout had 3 or more flares over a 1-year period.18 ,19 Thus, although the proportion of patients with frequent gout flares (3 or more per year) was small in this population, these patients have a high burden in terms of healthcare costs and resource use. In this study, average all-cause healthcare costs among patients in the 3+ flares cohort was $14 824 during the 1 year follow-up period. In comparison, prior studies using claims data have reported average annual all-cause healthcare costs of $11 182 for patients with irritable bowel syndrome,20 $13 548 among type 2 diabetes patients,21 and $15 487 for patients with prevalent adult systemic lupus erythematosus.22Therefore, we found that all-cause healthcare costs for gout patients with frequent flares were within the vicinity of other major chronic conditions.
Importantly, we observed some differences in characteristics among cohorts (eg, for age, gender, ethnicity, geographic distribution and comorbidities). To adjust for differences in patient characteristics, the relationship between flare frequency and healthcare costs was examined using a multivariate regression model. In the multivariate analysis, gout-related costs for patients in the 3+ flares cohort and the 2 flares cohort remained higher than costs for patients in the 0–1 flares cohort. Mean adjusted gout-related total costs were $1804, $3014 and $4363 in patients with 0–1, 2 or 3+ flares, respectively (p<0.001 comparing 0–1 flares to 2 or 3+ flares). A number of patient characteristics were associated with higher gout-related costs in the multivariate analysis, including older age; baseline renal impairment; baseline inpatient, ER, or ambulatory visits; and follow-up use of urate-lowering therapy. It is likely some of these characteristics are markers for more severe disease or challenging cases with worse health status, and thus are unsurprisingly associated with higher healthcare costs.
Additionally, a number of factors associated with increased flare count were identified in a separate multivariate analysis. Some of these associations were expected. For example, baseline sUA levels predicted a higher risk of flares, and it may be expected that patients with higher baseline sUA have more poorly controlled gout.5 The observation that a baseline sUA level of ≥6 or higher was predictive for an increased risk of flares underscores the importance of an sUA goal of <6.0 mg/dL. However, the reasons for some associations were not entirely clear, such as the finding that cardiovascular-renal impairment and diabetes had a protective effect against future gout flares. This finding may be related to the identification of flares in the claims using medications (NSAIDs, steroids) that are often contraindicated with these conditions, respectively. Additional research is needed to further validate the predictive value of this model and to better understand the observed associations.
Some previous studies have examined the relationship between frequency of gout flares and healthcare utilisation/costs using medical claims data. Lynch et al18 found that although annual medical costs were higher among gout patients with 3 or more flares versus those with fewer than 3 flares over a 1 year period, this difference was not statistically significant ($8640 vs $7332, p=0.2037). Unlike the present study, Lynch et al measured only annual all-cause costs, not gout-related costs. However, when measuring medical costs during the time of the gout attack (defined as the 14 days before to 14 days after the start of the attack), Lynch et al18 found that medical costs during an episode were on average higher for patients with 3 or more flares versus those with under 3 flares ($707 vs $570, as measured over a 28-day gout attack timeframe). Another claims-based study by Saseen et al19 compared costs of patients with ≥3 gout attacks to costs of patients with <3 gout attacks. Costs and flares were both counted during a 1 year follow-up period. Consistent with the present study, Saseen et al19 found higher gout-related medical costs for the ≥3 gout attacks group versus the <3 gout attacks group ($834 vs $176, p<0.0001). They also found significantly higher rates of gout-related inpatient visits, outpatient visits and EM visits for the ≥3 gout attacks group versus the <3 gout attacks group (all p<0.0001), which is consistent with the trend we observed in the present study.19 Our results serve as a valuable confirmation of these previous observations using a different study population, but we note that it may be difficult to make direct comparisons for gout-related cost estimates between the present study and these previous studies due to differences in patient or flare identification algorithms and differences in definitions for cohort assignments.
Some limitations should be considered when interpreting the results from this study. Claims data may be subject to possible coding errors, and the presence of a medical claim may not always indicate disease (eg, it may be included as rule-out criteria). The claims-based algorithms used in this study to identify gout patients were not validated with a medical chart review, and it is possible that some patients selected for study inclusion did not have gout. However, the algorithms required presence of either multiple gout diagnoses or presence of a gout diagnosis and a medication, and we expect this approach increased the specificity of patient selection. Also, in a sensitivity analysis where more restrictive criteria were used for patient selection (use of patient identification algorithms 1 and 2, but not 3), we observed similar trends when comparing costs among cohorts (data not shown). No specific ICD-9-CM code was widely used to identify gout flares during the study period, and the specificity and sensitivity of the flare identification algorithms used here are not known. Therefore, undercounting or overcounting of flares may have occurred for some patients, resulting in an inappropriate cohort assignment. However, we note that previously published studies have used similar claims-based approaches to identify gout and flares in administrative databases.5 Finally, the analyses in this study were performed using patients enrolled in a managed care plan, and the results may not be applicable to other patient populations.
In conclusion, the results from this study demonstrate that presence of frequent gout flares (2 or more annually) is associated with a substantial economic burden. Further, we observed that baseline sUA levels of ≥6.0 mg/dL predicted higher flare counts. Therefore, it would be expected that managing sUA levels should help to control frequency of gout flares. We observed that gout-related healthcare costs were 67% higher in patients with 2 flares and over 140% higher in patients with 3 or more flares, compared to patients with 0–1 flares. This suggests significant cost benefit to a gout disease management plan that has a goal of reducing flare frequency to fewer than 2 flares per year, and underscores the importance of prophylactic therapy to control sUA levels and reduce flares.
Acknowledgments
The authors thank Jesse Potash, Optum, for medical writing assistance. The authors thank Lynn Wacha, Feng Cao and Jeffrey McPheeters, Optum, for programming and analytical support.
References
Footnotes
Contributors RJ and HC contributed to the design of the study and interpretation of data. AS, EKB and AA contributed to the design of the study, collection of data and interpretation of data. SK contributed to collection and interpretation of data.
Funding This study was sponsored by Takeda Pharmaceuticals International, Inc.
Competing interests RJ and AS are employees of Takeda. EKB, AA, and SK are employees of Optum. Optum received research funding from Takeda Pharmaceuticals International, Inc to complete this study. HC has served as a consultant for Takeda Pharmaceuticals International, Inc and Astra-Zeneca Pharmaceuticals, and has served on advisory boards for Astra-Zeneca Pharmaceuticals.
Provenance and peer review Not commissioned; externally peer reviewed.
Data sharing statement No additional data are available.