Article Text

Abstract
Objective Crohn's disease (CD) is a chronic inflammatory bowel disease characterised by a peculiar accumulation of mesenteric adipose tissue covering the inflamed intestinal wall.
Methods The authors characterised different adipose tissue compartments of patients with CD using morphological and molecular techniques and compared them to those of subjects with obesity (OB) and healthy subjects with normal weight (N). Adipose tissue samples were taken from subcutaneous adipose tissue, omental visceral adipose tissue (VAT) and healthy mesenteric depot (hMES), as well as from fat wrapping the affected (unhealthy) intestinal tracts (uhMES). Microarray analyses, validated by real-time quantitative PCR technique, were performed in whole adipose tissue and in isolated adipocytes.
Results The morphology of subcutaneous adipose tissue was similar in subjects with CD and those with N. In patients with CD, VAT adipocytes were smaller than those derived from uhMES and hMES and were smaller than VAT adipocytes of subjects with N. The molecular profiles of CD, VAT and uhMES were characterised by upregulation of genes related to inflammation and downregulation of those involved in lipid metabolism. Adipocytes isolated from VAT of subjects with CD and those with OB exhibited similar upregulation of genes involved in inflammation and immunity. VAT adipocytes of patients with CD compared to those of patients with OB also showed a greater upregulation of several anti-inflammatory genes.
Conclusion In patients with CD, VAT distant from uhMES is affected by inflammation and displays features similar to those of VAT of patients with severe OB. The small diameter of VAT adipocytes of CD, together with their high expression of anti-inflammatory genes, suggests a potentially protective role for this tissue. VAT adipocytes may play an important role in the pathophysiology and/or activity of CD.
- Crohn's disease
- obesity
- gene expression
- diabetes mellitus
- endocrine hormones
- diet
Statistics from Altmetric.com
Significance of this study
What is already known on this subject?
Crohn's disease (CD) is characterised by the presence of expanded adipose tissue wrapping the affected intestinal tracts (mesenteric creeping fat)
Creeping fat is characterised by small adipocytes, marked macrophage and T cell infiltrates, fibrosis, perivascular inflammation and increased secretion of inflammatory cytokines
Accumulation of intra-abdominal fat is usual in severe obesity (OB) and is associated with metabolic diseases
What are the new findings?
In patients with active CD, visceral adipose tissue (VAT) taken from the omentum, thus far away from the inflamed intestinal circumference, show the same inflammatory morphology and molecular profile of creeping fat
The gene expression of VAT and mesenteric adipocytes of patients with CD is similar to that of VAT adipocytes of patients with OB, showing a greater inflammatory profile compared to VAT adipocytes of healthy subjects with normal weight (N)
The morphology and molecular profile of subcutaneous adipose tissue are similar in patients with CD and those with N
The proportion of anti-inflammatory genes expressed by VAT adipocytes is higher in patients with CD than in patients with OB. This finding, together with the smaller diameter of VAT adipocytes of patients with CD compared to CD mesenteric adipocytes and VAT adipocytes of subjects with N, suggests that VAT of CD might also play a protective role
How might they impact on clinical practice in the foreseeable future?
Focusing on adipose tissue genes and pathways specific for CD may help to understand the physiopathogenic events that underlie the disease and its activity
Introduction
Adipose tissue is composed of several different cell types, including adipocytes, preadipocytes, macrophages, endothelial cells, fibroblasts and leucocytes and is regarded as an active endocrine organ contributing to metabolic and immune function through the expression of hormones and mediators known as adipokines.1 2 Dysfunctional adipose tissue has been implicated in the development of metabolic and inflammatory diseases. In particular, the accumulation of visceral adipose tissue (VAT) is a well-established risk factor for cardiovascular disease and metabolic disorders.3 One mechanism thought to play a key role in the link between VAT accumulation and cardiovascular risk is the hypertrophy of adipocytes. Hypertrophic adipocytes have a reduced capacity to store lipids and, hence, deliver large amounts of free fatty acids and inflammatory adipokines to the liver and skeletal muscle, thereby inducing a state of insulin resistance.4 5
Accumulation of intra-abdominal fat is commonly found in subjects who are overweight/subjects with obesity (OB), but it may also be found in patients with normal weight (N) with only central OB accompanying the metabolic diseases.6 An interesting example of intra-abdominal fat accumulation in subjects free of metabolic disease7 and who are frequently underweight is Crohn's disease (CD), a chronic relapsing inflammatory process that can affect any part of the gastrointestinal tract.8 In the first description of this disease, Crohn et al reported the peculiar presence of an enlarged mesenteric adipose tissue that envelops more than half of the intestinal circumference in corresponding inflammatory lesions.8 9 Subsequent studies showed that this ‘creeping fat’ was characterised by fibrosis, perivascular inflammation, thickening of vessels and infiltration of inflammatory cells, similar to visceral fat of patients with severe OB. Unlike OB VAT, however, creeping fat was found to contain numerous small adipocytes rather than hypertrophic ones. Despite the similarity between the intra-abdominal fat of subjects with CD and those with OB, all available studies to date have focused on comparing creeping and mesenteric fat in individuals with CD versus individuals with N rather than individuals with OB.10
At present, the role of increased mesenteric adipose tissue in patients with CD remains unclear. In particular, it is not known whether this is an early event having a role in the pathogenesis of the disease or whether this represents a consequence of intestinal inflammation.
The expansion of mesenteric fat in patients with CD has been thought to result from transmural inflammation, caused by cytokine release from the adjacent lymphoid tissue.11 12 The recent demonstration that creeping fat has a pattern of expression of pro-inflammatory and anti-inflammatory molecules (tumour necrosis factor α (TNFα), peroxisome proliferator-activated receptor γ, leptin and adiponectin) different from that of the adipose tissue contiguous to healthy intestine and the mesenteric fat of normal-weight controls suggests that this tissue could also play a role in the pathogenesis and/or activity of the disease.13
The aim of the present study was to analyse in patients with CD, those with severe OB and those with N the morphology and molecular profile of different adipose tissue compartments: subcutaneous adipose tissue (SAT), VAT, mesenteric fat close to the healthy intestine (hMES) and, in patients with CD, mesenteric fat close to the involved (unhealthy) intestinal tract (uhMES).
Materials and methods
Patients and specimen collection
A total of 24 patients were studied. Eight patients with active CD (five ileocolic, one colonic and two ileal) were enrolled from those referred for surgery due to symptomatic complications. Mean disease duration was 4.9±2.55 years. All patients were stenosing, two out of eight had a simple fistula and three out of eight had a complex fistula with a mesenteric abscess and peritoneal fluid at surgery. One patient had a history of intestinal resection. All patients had discontinued treatment with corticosteroids, immunomodulators, salicylates or infliximab for at least 2 months.
Eight patients with OB were recruited from those submitted to bariatric surgery for morbid OB, and eight subjects with N were recruited from those who underwent laparotomic surgery for non-inflammatory disease (ventral hernia, intestinal adhesions and cholelithiasis).
Two patients with OB, but none of the patients with CD and those with N, had hypertension and type 2 diabetes. None was taking a lipid-lowering treatment. In all patients, a fasting blood sample was collected the day before surgery for measurement of glucose, insulin, high-density lipoprotein and low-density lipoprotein cholesterol, triglycerides, fibrinogen and C reactive protein (CRP). Specimens of adipose tissue were obtained during surgery from different anatomical compartments (SAT, VAT, hMES and uhMES).
Each adipose tissue specimen was processed as detailed below. Fractions were (A) fixed in 10% phosphate-buffered formalin and embedded in paraffin for histological studies, (B) stored at −80°C until RNA extraction and (C) digested with collagenase for isolation of mature adipocytes.
The study protocol was approved by the Ethics Committee of the Istituto Auxologico Italiano. All patients gave their informed consent before starting the study.
Biochemical measurements
Circulating levels of glucose and lipids were measured using an automated analyser (Roche Diagnostics, Mannheim, Germany). Insulin was measured by a chemiluminescent assay (Roche Diagnostics) with a sensitivity of 0.2 μU/ml and intra-assay and interassay coefficients of variation (CVs) of 3.3% and 4.1%, respectively. Fibrinogen was measured in citrate plasma with a clot-rate assay using the ACL 200/IL instrument (Instrumentation Laboratory, Milan, Italy). The sensitivity of this assay was 7.5 mg/dl, and the intra-assay and interassay CVs were 4.8% and 5.2%, respectively. CRP was measured by an immunoturbidimetric assay (CRP Latex HS, Roche Diagnostics), with a sensitivity of 0.03 mg/l and intra-assay and interassay CVs of 1.3% and 5.7%, respectively.
Morphological analysis
Each collected adipose tissue sample was formalin-fixed overnight at 4°C and was washed the following day in 1× phosphate-buffered saline (PBS) solution and paraffin embedded. Sections were routinely performed at 5 μm thickness and then stained with H&E. For the assessment of adipocyte mean size, five randomly selected sectional areas, measuring at least 200 cell diameters, were analysed using an image analysis system (Leica DMR Wetzlar, Germany).
Preparation of human adipocytes
Immediately after removal, a fragment of the whole adipose tissue specimen was cut into small pieces and digested with 1 mg/ml collagenase type 2 (Sigma, St. Louis, Missouri, USA) for at least 1 h at 37°C under agitation on a plate shaker. The digested tissue was filtered through a sterile gauze and then through a 100-μm nylon filter (BD Biosciences, Franklin Lakes, New Jersey, USA). Recovered filtrates were centrifuged at 500×g, and floating adipocytes were washed in PBS, collected and stored in Trizol reagent (Invitrogen, Carlsbad, California, USA) until RNA extraction.
For quality control of mature adipocyte isolation, we assessed by light microscopy observation the absence of inflammatory cells in a small amount of the floating adipocytes collected after several PBS washing. In addition, we determined in stromal vascular fraction (SVF) and adipocyte fraction cells the mRNA expression (by real-time quantitative PCR (RTqPCR); see below for methodology) of three genes predominantly expressed in SVF cells (MCP-1 (monocyte chemotactic protein 1), CD206 and CD163).
RNA preparation and cDNA synthesis
Total RNA was extracted from whole adipose tissue biopsies (SAT, VAT, uhMES and hMES), as well as from isolated adipocytes. Adipose tissue specimens were homogenised in RLT lysis buffer (RNeasy Mini Kit; QIAGEN GmbH, Hilden, Germany) using a rotator-stator, followed by a chloroform delipidation step. The upper aqueous phase was processed for total RNA extraction using silica-based spin columns. The yield of total SAT/VAT/hMES/uhMES RNA was 1.5–7.0 μg/mg of white adipose tissue. The RNA from isolated adipocytes was extracted using a TRIzol Plus RNA Purification Kit (Invitrogen Corporation, Jefferson City, Missouri, USA) according to the manufacturer's instructions. RNA concentrations were quantified spectrophotometrically, and total RNA integrity was verified by agarose gel electrophoresis. The copy DNAs were obtained by reverse transcription with SuperScript III (Invitrogen) from 500 ng of total RNA.
Microarray analysis
Gene expression profiles were performed using the HumanHT-12 v3 BeadChips whole-genome gene expression direct hybridisation assay (Illumina, San Diego, California, USA). This assay is based upon fluorescence detection of biotin-labelled cRNA. Each array contains full-length 50-mer probes representing more than 48 000 well-annotated reference sequence transcripts, including >25 400 unique and up-to-date genes derived from the National Centre for Biotechnology Information Reference Sequence. Initially, 300 ng of total RNA was converted to cDNA, followed by an in vitro transcription step to generate biotin-16-UTP-labelled cRNA using the Ambion Illumina Total Prep RNA Amplification Kit (Ambion, Austin, Texas, USA) according to the manufacturer's instructions. The amount and quality of labelled cRNA were measured using the NanoDrop spectrophotometer. The labelled probes were then mixed with hybridisation reagents and hybridised overnight on the HumanHT-12 v3 BeadChips (Illumina). After washing and staining, we imaged the BeadChips using the Illumina BeadArray Reader (Illumina) to measure fluorescence intensity for each probe. Using this system, the average signal intensity corresponds to the quantity of respective mRNA in the original sample. Bead summary data were imported into Bead Studio software to remove control probes and to produce a text file containing the signal and detection p values for probes for each sample. Text files were imported into the Genome Studio program (Illumina) for statistical analysis. A list of genes was compiled for those that were either upregulated or downregulated to a statistically significant degree. The cut-off used for significance was a p value of 0.05. Gene expression analysis was performed in four whole adipose tissue compartments (SAT, VAT, uhMES and hMES) from patients with CD. A second set of gene expression analyses was performed on pooled adipocytes isolated from VAT of patients with CD (I pool), those with OB (II pool) and those with N (III pool) and on two pools of adipocytes isolated from hMES and uhMES of patients with CD.
Functional annotations
Prioritised genes were uploaded to DAVID (Database for Annotation, Visualisation, and Integrated Discovery, Saic-Frederick, Inc) software.14 The microarray data were MIAME (Minimum Information About a Microarray Experiment) compliant.15
Determination of gene expression by RTqPCR
RTqPCR was used to validate microarray-based mRNA expression. For each sample of adipose tissue, 10 ng of cDNA template was amplified in duplicate in PCR reactions on an ABI PRISM 7700 using Assay-on-Demand Gene Expression Products (Applied Biosystems, Foster City, California, USA). RTqPCR validations were performed in whole adipose tissues and in isolated adipocytes, using TaqMan probes (Applied Biosystems) for upregulated genes (CD68 (CD68 molecule), CD163 (CD163 molecule), TNFα, IL-6 (interleukin 6), MCP-1, LEP (leptin)) and downregulated genes (FASN (fatty acid synthase), HSL (hormone-sensitive lipase), FABP4 (fatty acid binding protein 4), PLIN (perilipin), PPARγ (peroxisome proliferator-activated receptor γ)). RPLP0 (human ribosomal protein LP0) was used as a housekeeping gene. The data were analysed using the SDS V.3 software (Software Diversified Systems, Spring Lake Park, Minnesota, USA). Cycle thresholds (Ct) were defined as the cycle number at which a significant increase in the fluorescence signal was first detected. Quantifications of unknown samples were performed by calculating Ct values for each sample. mRNA levels were normalised to RPLP0 expression for each sample by subtracting the Ct for the housekeeping gene from the Ct for the gene of interest, producing a ΔCt value. The relative quantification, expressed as arbitrary units, was then obtained using the 2ΔΔCt method to determine fold change under different experimental conditions.16
Statistical analyses
The ‘Detection Score’ was used to determine the expression levels using the Illumina platform. This is a statistical measure in the Bead Studio software, which is computed based on the Z value of a gene relative to the Z value of the negative controls. A gene with a detection p value of <0.05 was considered significantly expressed. The Illumina data were normalised using a cubic spline function. At differential expression analyses, genes with a nominal p value of ≤0.05 were considered significant. Spearman's correlation analysis was used to evaluate the relationships between the average signal of the selected genes in microarray studies and the mRNA expression levels in RTqPCR validation. Wilcoxon signed-rank test was used to compare mRNA expression levels in RTqPCR validations. Differences between groups in mean diameter of adipocytes and biochemical data were calculated using the Student t test for normally distributed data and a non-parametric Mann–Whitney test when data appeared not to be normally distributed. All analyses were performed using GraphPad Prism software. Data are expressed as means±SD. A p value <0.05 was considered statistically significant.
Results
Subject characteristics
Clinical characteristics of patients enrolled in the study are indicated in table 1. Patients with CD had significantly lower high-density lipoprotein cholesterol and higher fibrinogen and CRP levels than subjects with OB and those with N. Fasting insulin and triglycerides were higher in patients with OB than in patients with N and those with CD. Body mass index and blood glucose were not significantly different in patients with CD and those with N, most likely because two patients with CD were overweight and had impaired fasting glucose.
Clinical and biochemical characteristics of the 24 studied patients
Morphological analysis
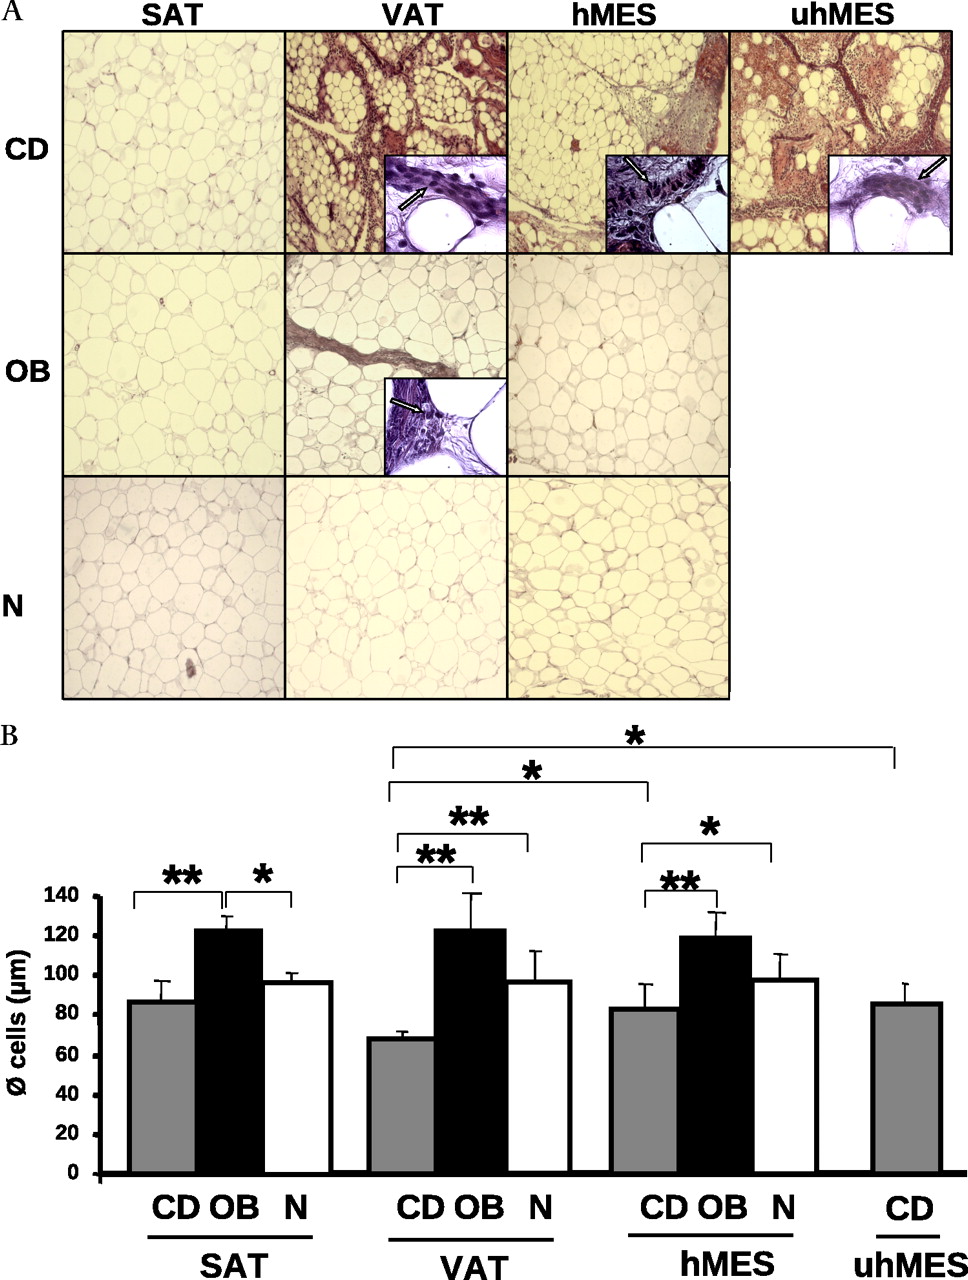
Representative morphologies of four adipose tissue compartments in one patient with CD, one with OB and one with N are shown in figure 1A. SAT of patients with CD, OB and N did not show signs of inflammation and was similar between patients with CD and those with N who had non-hypertrophic adipocytes compared to hypertrophic adipocytes of the patient with OB. VAT and uhMES of the patient with CD exhibited an interlobular inflammatory infiltrate that was notably greater than that of VAT of the patient with OB (figure 1A). In the patient with CD, hMES was less fibrous and inflamed than uhMES, whereas in the patient with OB and that with N, hMES was free of inflammation (figure 1A).

(A) H&E staining of thin sections of different adipose tissue compartments (SAT, VAT, hMES and uhMES) from one representative patient with CD, OB and N. Magnification is 10× and 100× in the insets. Arrows are used to indicate inflammatory cells in insets. (B) Mean size of adipocytes from different adipose tissue depots of eight patients with CD (grey bars), eight patients with OB (black bars) and eight subjects with N (white bars). Data are expressed as means±SD. *p<0.05, **p<0.01. CD, Crohn's disease; hMES, mesenteric fat close to the healthy intestine; N, normal weight; OB, obesity; SAT, subcutaneous adipose tissue; uhMES, mesenteric fat close to the involved (unhealthy) intestinal tract; VAT, visceral adipose tissue.
Figure 1B shows the mean diameter of adipocytes in patients with CD, OB and N. Adipocyte diameter was significantly lower in patients with CD than in patients with OB in all adipose tissue compartments. Compared to that of patients with N, the mean adipocyte diameter of patients with CD was significantly smaller in VAT and hMES, whereas it was similar in SAT. In patients with CD, adipocytes were significantly smaller in VAT than in uhMES and hMES.
Molecular characterisation of whole adipose tissue compartments in patients with CD
We first investigated the global gene expression of whole SAT, VAT, hMES and uhMES of patients with CD using microarray technology. There were 37 804 genes broadly detected, of which 15 165 had a detection p value of <0.05. This list of genes was considered statistically significant and selected for further analyses.
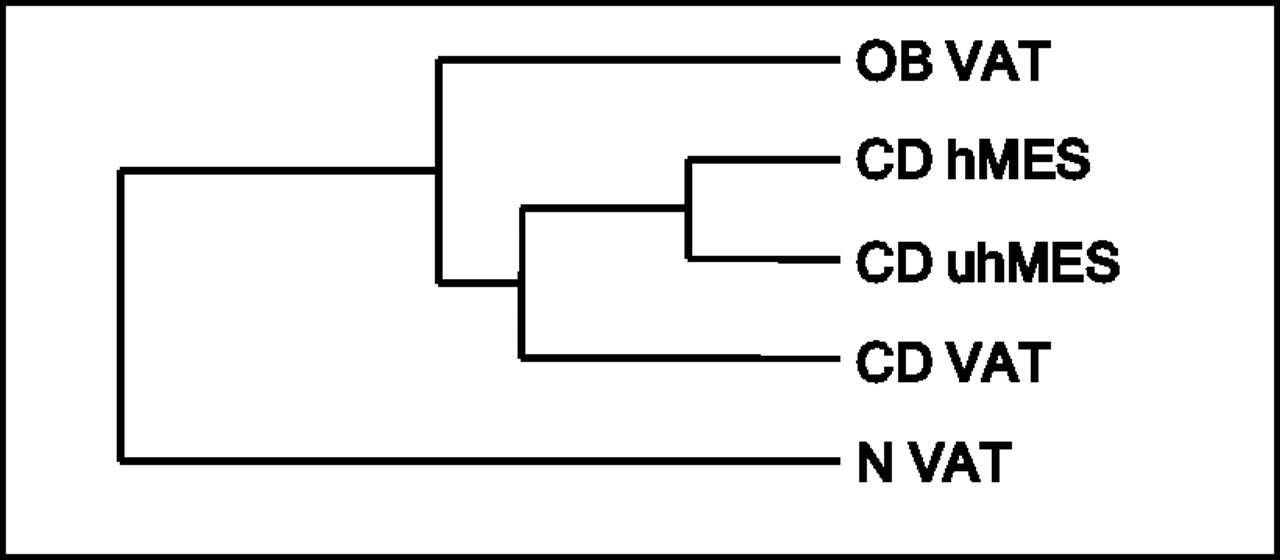
Clustering analysis that regrouped samples for similarity of global gene expression in the adipose tissue compartments of patients with CD is reported in figure 2A. SAT formed a cluster that was independent of the other intra-abdominal adipose depots that composed a separate branch, while hMES and uhMES clustered together. Whole SAT gene expression was comparable between patients with CD and those with N (not shown).

(A) Clustering of global gene expression in four compartments of whole adipose tissue (SAT, VAT, hMES and uhMES) from patients with CD. (B–D) Annotations of genes differentially expressed in hMES, uhMES and VAT of patients with CD compared to CD SAT (p<0.05). For each adipose tissue depot, the Gene Ontology Biological Process Category of the first three clusters of downregulated and upregulated genes is indicated. The number of genes belonging to each category is also shown. CD, Crohn's disease; hMES, mesenteric fat close to the healthy intestine; SAT, subcutaneous adipose tissue; uhMES, mesenteric fat close to the involved (unhealthy) intestinal tract; VAT, visceral adipose tissue.
Figure 2B–D shows the functional annotations for genes that were upregulated and downregulated in different adipose tissue depots of patients with CD. VAT and uhMES displayed a similar pattern of annotated genes, with an upregulation of those involved in inflammation and a downregulation of genes involved in lipid metabolism. In hMES, there was a downregulation of metabolic genes similar to that of uhMES and VAT, while genes involved in cytoskeleton organisation were upregulated.
Molecular characterisation of adipocytes isolated from adipose tissues of patients with CD, those with OB and those with N
To assess whether adipocytes participate in the overexpression of genes related to inflammation found in the whole intra-abdominal fat of patients with CD, we analysed the gene expression of adipocytes isolated from different adipose tissue depots. The mRNA gene expression of MCP-1, CD206 and CD163 examined for quality control of adipocyte isolation demonstrated that MCP-1 and CD206 were almost exclusively expressed in SVF cells. The gene expression of CD163 in adipocytes corresponded to 40% of that observed in the SVF cells (supplementary figure) in agreement with the demonstration that CD163 may also be expressed by adipocytes.17 As a whole, we estimated that the possible ‘contamination’ of adipocyte fraction by SVF cells/macrophages was <1.6% of the total RNA expression and therefore did not affect the validity of the analysis of adipocyte gene expression.
The overall number of genes detected in isolated adipocytes was 37 801, of which 10 285 had a detection p value <0.05. Figure 3 shows the clustering analysis. The gene expression of intra-abdominal adipocytes (VAT, hMES and uhMES) of patients with CD clustered together with that of the adipocytes isolated from VAT of patients with OB, whereas the gene expression of VAT adipocytes from subjects with N formed a separate branch.
Clustering of global gene expression of adipocytes isolated from intra-abdominal adipose tissue depots of patients with OB, CD and N. CD, Crohn's disease; OB, obesity; N, normal weight.
When compared to VAT adipocytes of subjects with N, which were used as a reference, VAT adipocytes of patients with CD differentially expressed 26% of significant genes (approximately 2700) (figure 4A). Approximately half of the differentially expressed genes were upregulated and related to inflammation/immune response, while half were downregulated and related to mitochondrial function.

Genes differentially expressed in adipocytes isolated from VAT of (A) patients with CD and (B) patients with OB, compared to those expressed in adipocytes isolated from VAT of patients with N. Gene Ontology Biological Process Categories of the first five clusters of downregulated and upregulated genes are indicated. The number of genes belonging to each category is also shown. CD, Crohn's disease; N, normal weight; OB, obesity; VAT, visceral adipose tissue.
Visceral adipocytes from patients with OB displayed a pattern similar to those from patients with CD, with 21% of genes differentially expressed compared to subjects with N, upregulation of genes involved in inflammation/immune response and downregulation of those involved in mitochondrial function (figure 4B).
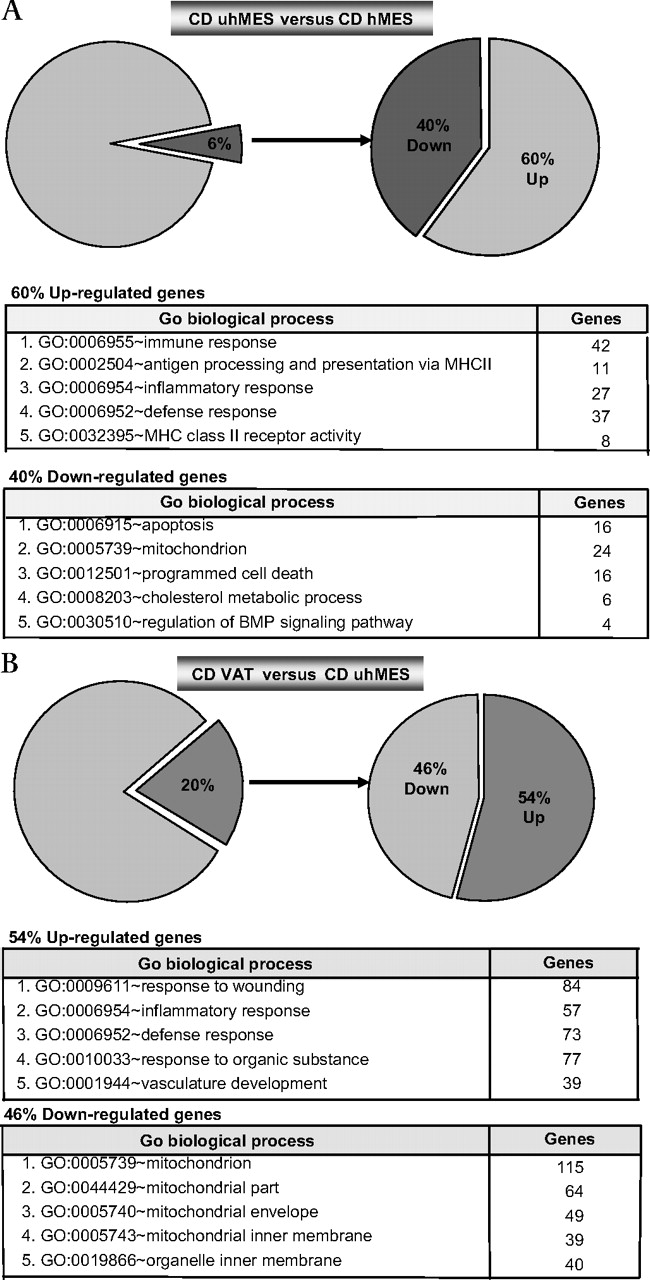
In patients with CD, adipocytes of uhMES compared to those of hMES differentially expressed only a minority of genes, with a downregulation of apoptosis-related genes (figure 5A). Visceral adipocytes expressed 20% of genes differently from uhMES, most of which were upregulated and related to inflammation/immunity. The downregulated genes were again mainly related to mitochondrial function (figure 5B). Figure 6 shows the strong correlation between expression levels of mRNA transcripts assessed with RTqPCR fold change and the average signal detection fold change on microarray assays in whole adipose tissue (A) and adipocytes (B).

Genes differentially expressed in adipocytes isolated from uhMES versus hMES (A) and VAT versus uhMES (B) of patients with CD. Gene Ontology Biological Process categories of the first five clusters of downregulated and upregulated genes are indicated. The number of genes belonging to each category is also shown. CD, Crohn's disease; hMES, mesenteric fat close to the healthy intestine; uhMES, mesenteric fat close to the involved (unhealthy) intestinal tract; VAT, visceral adipose tissue.

(A) Correlations between microarray average (AVG) signal detection fold change and mRNA levels (arbitrary units) detected by RTqPCR fold changes for five selected genes (HSL, LEP, CD68, TNFα and IL-6) in three compartments of whole adipose tissue (VAT, hMES and uhMES) from patients with CD. CD SAT was used as a reference. (B) Correlations between fold changes of microarray AVG signals and RTqPCR of eight selected genes mRNA (TNFα, IL-6, MCP-1, CD163, FABP4, FASN, PLIN and PPARγ) in adipocytes isolated from VAT of subjects with OB and those with CD and from hMES and uhMES of patients with CD. VAT of subjects with N was used as a reference. CD, Crohn's disease; CD163, CD163 molecule; CD68, CD68 molecule; FABP4, fatty acid binding protein 4; FASN, fatty acid synthase; hMES, mesenteric fat close to the healthy intestine; HSL, hormone-sensitive lipase; IL-6, interleukin 6; MCP-1, monocyte chemotactic protein 1; N, normal weight; OB, obesity; PLIN, perilipin; PPARγ, peroxisome proliferator-activated receptor γ; SAT, subcutaneous adipose tissue; TNFα, tumour necrosis factor α; uhMES, mesenteric fat close to the involved (unhealthy) intestinal tract; VAT, visceral adipose tissue.
Characterisation of genes involved in inflammation in VAT adipocytes of patients with CD and those with OB
To compare the profile of the inflammation/immunity-related genes between VAT adipocytes of patients with CD and those of patients with OB, we studied the fold change trend in a list of pro-inflammatory and anti-inflammatory genes18 (table 2). In patients with CD versus patients with OB, VAT adipocytes displayed a greater upregulation of genes related to inflammation/immunity as well as a number of anti-inflammatory molecules (83% vs 56%). VAT of patients with CD and those with OB shared 40% of genes, whereas the remainder were specific to only one of the two conditions (table 2). In particular, a marked difference was observed in the expression of prokineticin 2 that was high in VAT adipocytes of patients with CD and low in those of patients with OB.
Comparison between the pro-inflammatory and anti-inflammatory genes upregulated, downregulated and similarly expressed in adipocytes isolated from VAT of patients with CD and those with OB compared to VAT adipocytes of patients with N
Discussion
The present study provides new information on the morphology and molecular profile of different adipose tissue compartments in patients with active CD. A comparison with fat of patients with OB is also reported for the first time. Until now, only creeping fat was investigated in patients with CD,10 19–21 and it was unknown whether adipose tissue depots distant from creeping fat were similarly affected.
The main result of this study is the unexpected involvement of adipocytes taken from a visceral site anatomically far away from the hypertrophic mesenteric fat, in the inflammatory state of CD.
While the progression of inflammation from the inflamed bowel to the anatomically associated adipose tissue is comprehensible, the reason why other intra-abdominal fat depots are affected by an even more pronounced inflammatory state is not clear.
VAT involvement is demonstrated by the pronounced inflammatory morphological appearance, as well as the greater expression of inflammatory genes on microarray analysis, compared to mesenteric tissues. On morphological examination, VAT of patients with CD was composed of adipocytes smaller than those of hMES and uhMES, and at global gene expression analysis, it formed a branch independent of mesenteric tissues, suggesting that it had functions distinct from the other two intra-abdominal adipose tissues. SAT of patients with CD had a morphology and gene expression profile similar to that of subjects with N, thus appearing unaffected by the disease.
When compared to VAT of patients with OB, VAT of patients with CD appeared more inflamed at morphology and exhibited the same pattern of upregulation of inflammatory genes and downregulation of mitochondrial genes. This finding likely reflects the profound modifications occurring in adipocytes surrounded by a highly inflamed environment. Indeed, the chronic increase in pro-inflammatory cytokines by non-adipose cells is known to impact on the biology and molecular profile of adipocytes that develop an inflammatory phenotype.22 23 It is conceivable that different mechanisms may underlie VAT inflammation in patients with OB and those with CD. While the initiating factor of inflammation in OB may be the production of chemotactic signals by enlarged adipocytes that recruit macrophages and induce a shift of resident macrophages from the anti-inflammatory M2 to a pro-inflammatory M1 type,24 the origin of VAT inflammation in CD is more difficult to explain, particularly because this tissue is composed of small adipocytes that are believed to produce less pro-inflammatory molecules compared to large adipocytes.25 It should also be noted that VAT adipocytes of patients with CD expressed a proportion of upregulated anti-inflammatory genes higher than those of patients with OB. This finding suggests that the small adipocytes of patients with CD maintain the ability to counteract the inflammation and possibly have a protective role. The demonstration that the intra-abdominal adipose tissue undergoes a 27% enlargement after treatment with infliximab in patients with CD26 supports a role for this tissue in the activity of the disease although the functional consequences for adipose tissue biology of anti-TNFα treatment in CD are not yet known.
The downregulation of mitochondrial genes observed in VAT of patients with OB and those with CD may again have a different origin. Evidence suggests that, in OB, lipid droplet creation and expansion impose significant stress on adipocytes that is manifested in the endoplasmic reticulum and mitochondria.27 At the same time, in VAT of patients with CD, mitochondrial genes may be downregulated by the inflamed environment. In support of this idea, treatment of differentiated 3T3-L1 adipocytes with TNFα decreases the mitochondrial membrane potential and the production of intracellular ATP and induces an accumulation of significant amounts of reactive oxygen species.28
Recently, in a mouse model of creeping fat development, creeping fat was reported to have an atypical expression pattern compared to other adipose tissue depots.29 In agreement with this observation, we noted a downregulation of genes involved in lipid metabolism in CD intra-abdominal fat depots compared to SAT.
The determining factor in the inflammatory state of intra-abdominal adipose tissue in CD is still a matter of speculation. Among the possible candidates that promote adipocyte proliferation and sustain inflammation are the intestinal bacteria that can be stored in intra-abdominal adipose tissue.30 According to this hypothesis, CD might represent a secondary immune response to an altered intestinal microbiota.30 In addition, a mutation in a sensor of cell wall components of Gram-positive and Gram-negative bacteria that is present in more than 30% of patients with CD is thought to be a mechanism underlying the altered tolerance to commensal bacteria.31
Our results provide new insights into the role of adipose tissue, which is increasingly seen as the protagonist of several diseases once unsuspected to be associated with adiposity.32
In conclusion, we report that active CD is characterised by VAT inflammation that displays morphological and molecular features similar to those seen in severe OB. The concomitant higher pattern of anti-inflammatory genes in VAT adipocytes of patients with CD suggests that VAT may also have a protective property. Focusing on adipose tissue genes and pathways specific for CD may offer a promising area of research for understanding the physiopathogenic events that underlie this disease and its activity.
Acknowledgments
The authors thank Laura Ermellino and Anna Rita Grindati for technical assistance with adipose tissue processing for morphological study and Dr Besozzi for access to facilities at the Laboratory of the Istituto Auxologico Italiano, Milan, Italy.
References
Supplementary materials
Supplementary Data
This web only file has been produced by the BMJ Publishing Group from an electronic file supplied by the author(s) and has not been edited for content.
Files in this Data Supplement:
- Download Supplementary Data (PDF) - Manuscript file of format pdf
Footnotes
See Commentary, p 3
Competing interests None.
Ethics approval This study was conducted with the approval of the Istituto Auxologico Italiano Ethics Committee.
Provenance and peer review Not commissioned; externally peer reviewed.