Article Text

Abstract
Objectives Knee osteoarthritis (OA) is a leading cause of activity limitations. The knee OA population is likely to consist of subgroups. The aim of the present study was to identify homogeneous subgroups with distinct trajectories of activity limitations in patients with early symptomatic knee OA and to describe characteristics of these subgroups.
Methods Follow-up data over a period of 5 years of 697 participants with early symptomatic knee OA from the Cohort Hip and Cohort Knee (CHECK) were used. Activity limitations were measured yearly with the Western Ontario and McMaster Universities Osteoarthritis Index. Latent class growth analyses identified homogeneous subgroups with distinct trajectories of activity limitations. Multivariable regression analyses examined differences in characteristics between the subgroups.
Results Three subgroups were identified. Participants in Subgroup 1 (‘good outcome’; n=330) developed or displayed slight activity limitations over time. Participants in Subgroup 2 (‘moderate outcome’; n=257) developed or displayed moderate activity limitations over time. Participants in subgroup 3 (‘poor outcome’; n=110) developed or displayed severe activity limitations over time. Compared with the ‘good outcome’ subgroup, the ‘moderate outcome’ and ‘poor outcome’ subgroups were characterised by: younger age, higher body mass index, greater pain, bony tenderness, reduced knee flexion, hip pain, osteophytosis, ≥3 comorbidities, lower vitality or avoidance of activities.
Conclusions Based on the 5-year course of activity limitations, we identified homogeneous subgroups of knee OA patients with good, moderate or poor outcome. Characteristics of these subgroups were consistent with existing knowledge on prognostic factors regarding activity limitations, which supports the validity of this classification.
- Knee Osteoarthritis
- Epidemiology
- Rehabilitation
Statistics from Altmetric.com
Introduction
Knee osteoarthritis (OA) is a leading cause of activity limitations among older adults.1 In the OA population, activity limitations increase slowly over time,2 while the individual course is highly variable: some patients seem to be stable or even improve, whereas others deteriorate.3–5
The most common approach in describing the course of activity limitations in knee OA patients is to report a single longitudinal trajectory for the entire study population. Usually, the change score on activity limitations between two time points is presented, averaged over all patients. Because the population of knee OA patients is heterogeneous and consists of different phenotypes or subgroups,6–8 it is suboptimal to describe the course of activity limitations using the average of the population.9 Latent class modelling has been suggested as the most appropriate technique for examining inter-individual differences in intraindividual change.9 This technique takes into account heterogeneity between subgroups.
The aim of the present study was to identify homogeneous subgroups with distinct trajectories of activity limitations in patients with early symptomatic knee OA and to describe characteristics of these subgroups.
Methods
Study design
A 5-year follow-up study of a sample of 701 individuals from the Cohort Hip and Cohort Knee (CHECK) study with early symptomatic OA of the knee was undertaken.10 Measurements were performed every year, resulting in six measurements over time.
Parent study
The CHECK cohort was formed between October 2002 and September 2005. It consists of 1002 individuals with early symptomatic knee and/or hip OA.10 Ten general and academic hospitals in the Netherlands participated. Participants were recruited via general practitioners in the surroundings of the participating centres, and through announcements in local newspapers and on the Dutch Arthritis Association website. The physicians in the participating centres checked whether participants fulfilled the inclusion criteria. The study was approved by the medical ethics committees of the participating centres. All participants gave their written informed consent before entering the study.
Study population
Inclusion criteria of the CHECK study are: (1) being aged between 45 and 65 years; (2) pain and/or stiffness in the knee and/or hip; (3) having at least two of the following clinical criteria for knee OA of the American College of Rheumatology (ACR): knee pain, morning stiffness <30 min, crepitus or bony tenderness (participants who met this criterion were followed annually);11 and (4) having had no consultation with a physician for these symptoms (or first consultation was within the 6 months immediately preceding inclusion). Exclusion criteria were: having any other pathological condition that could explain the knee and hip symptoms; having a comorbidity that would not allow physical evaluation and/or follow-up of at least 10 years duration; malignancy in the last 5 years; and inability to understand the Dutch language.10 For the present study we selected participants with knee pain, who had at least one follow-up measurement of activity limitations.
Measurements
Activity limitations were measured annually with the physical function subscale of the Western Ontario and McMaster Universities Osteoarthritis Index (WOMAC-PF).12 ,13 Scores range from 0 to 68, with higher scores indicating greater activity limitations.
Baseline data were collected on participant characteristics (ie, age, gender and body mass index (BMI)), signs and symptoms (ie, numeric rating scale (NRS) for pain during the last week (0–10), presence of bilateral knee pain, fulfilling the clinical criteria for knee OA of the ACR,11 morning stiffness, bony tenderness, crepitus, hip pain, and total knee or hip replacement), radiographic features (ie, osteophytosis, joint space narrowing, Kellgren and Lawrence grade14), comorbidity count, and psychological factors (ie, vitality measured with the Short-Form 36 Health Survey (SF-36)15 and avoidance of activities measured with the resting subscale of the Pain Coping Inventory16 ,17). Details on the study protocol have been published elsewhere.10
Statistical analyses
To identify homogeneous subgroups of patients with distinct trajectories of activity limitations as measured by the WOMAC-PF, we conducted latent class growth analysis (LCGA). In LCGA, latent trajectory classes (ie, categorical latent variables) are used to allow different groups of individual longitudinal trajectories to vary around different means.9 ,18 ,19 The variance and covariance estimates of the growth factors (ie, rate of change or slope of the longitudinal trajectories) within each class or subgroup are assumed to be fixed to zero.9 ,19 As a result, all individual longitudinal trajectories within a subgroup are homogeneous.9
The latent class growth models were estimated using full information maximum likelihood. Linear, quadratic and cubic trajectories were modelled. The course of activity limitations was best described by linear trajectories. The fit of four models with two to five linear trajectories were tested. The most appropriate model was determined based on fit indices, the entropy statistic, classification reliability, and considerations of parsimony and clinical relevance.9 The fit indices used were the Bayesian information criterion (BIC), the Vuong–Lo–Mendell–Rubin likelihood ratio test (LMR-LRT) and the bootstrap likelihood ratio test (BLRT).19 ,20 The BIC, LMR-LRT and BLRT are used for comparison across several plausible models.20 The lowest value of BIC indicates the best fitting model.20 Significant p values (p<0.05) for the LMR-LRT and BLRT indicate that a model with a k number of trajectory subgroups has a better fit than a model with a k−1 number of trajectory subgroups.9 ,20 The entropy statistic and posterior probabilities of group membership were used as measures for the reliability of the trajectory subgroups. The entropy statistic and posterior probabilities of group membership range from 0 to 1 and have to be reasonably high: values close to 1 indicate good classification.9
To improve our understanding of the trajectory subgroups resulting from the LCGA, a linear mixed model with random effects calculated individual trajectories (slopes) of the 5-year course of activity limitations. For each subgroup, the individual slopes were plotted against the individual baseline WOMAC-PF scores.
Univariable and multivariable logistic regression analyses examined differences in demographic, clinical and psychological characteristics between the trajectory subgroups. One trajectory subgroup was chosen as a reference; the other trajectory subgroups were compared with that reference. For calculation of the mean WOMAC-PF change score and the regression analyses, a Multivariate Imputation by Chained Equation (MICE) procedure generated 10 multiple imputed datasets to estimate missing values.21 In the multivariable analyses we used a backward selection method (p-removal 0.05) taking into account the imputed datasets by using Rubin's pooling rules.22 The ORs and 95% CIs of the final regression models were estimated over the 10 imputed data sets. Furthermore, the area under the receiver operating characteristic curve, Hosmer–Lemeshow goodness-of-fit test23 and Nagelkerke's R2 statistic24 were calculated. Bootstrapping techniques (250 replications) adjusted the estimated ORs for overfitting and the model performance for overoptimism.25 The shrinkage factor, a result of the bootstrap analyses, is a measure of overfitting. ORs can be corrected for overfitting by taking the exponent of the regression coefficient multiplied by the shrinkage factor.
Mplus V. 6.12 was used for LCGA; SAS V. 9.2 to calculate the individual slopes; SPSS V. 18 to generate descriptive statistics of the study population; and R software V. 2.14.1 for the MICE procedure and the regression analyses on the imputed data sets.
Results
Study population
Of 701 participants included, 14 (2%) and 12 (1.7%) participants underwent total knee and total hip replacement during the 5-year follow-up, respectively. The postsurgery WOMAC-PF data of these participants were coded as missing. As a result, four participants were excluded from the analyses. The baseline characteristics of the study population (n=697) are presented in table 1.
Baseline characteristics of the study population
Missing data
For the WOMAC-PF, the number (percentage) of participants with missing data was 15 (2.2%) at baseline (T0), 32 (4.6%) at T1, 36 (5.2%) at T2, 38 (5.5%) at T3, 57 (8.2%) at T4 and 74 (10.6%) at T5. In all, 140 participants had data missing at more than one time point (mean 1.8 time points). The mean number of missing values per independent variable was 19.9 (2.9%) (median 13 (1.9%), range 0–78 (0%–11.2%)).
5-Year course of activity limitations
The mean (SD) baseline WOMAC-PF score was 16.8 (11.6). In the study population as a whole, little change in activity limitations was observed between baseline and 5-year follow-up: the mean WOMAC-PF score increased with 1.1 points (SD change=11.5).
Subgroups based on trajectories
A linear, three-class model was identified as most appropriate, based on fit indices, entropy statistic, classification reliability, considerations of parsimony and interpretability (table 2). Although the fit indices seemed to favour a four-class model, the three-class model showed a better entropy value and better internal reliability for each trajectory (ie, better average posterior probabilities of group membership). In addition, Subgroups 1 and 2 in the four-class model had similar (1 and 1.2 respectively) estimated slopes, with only 45 patients assigned to the additional subgroup. Because the additional subgroup had marginal added value, we deemed the three-class model as the most appropriate.
Fit indices, entropy and average posterior probabilities across models with different numbers of subgroups
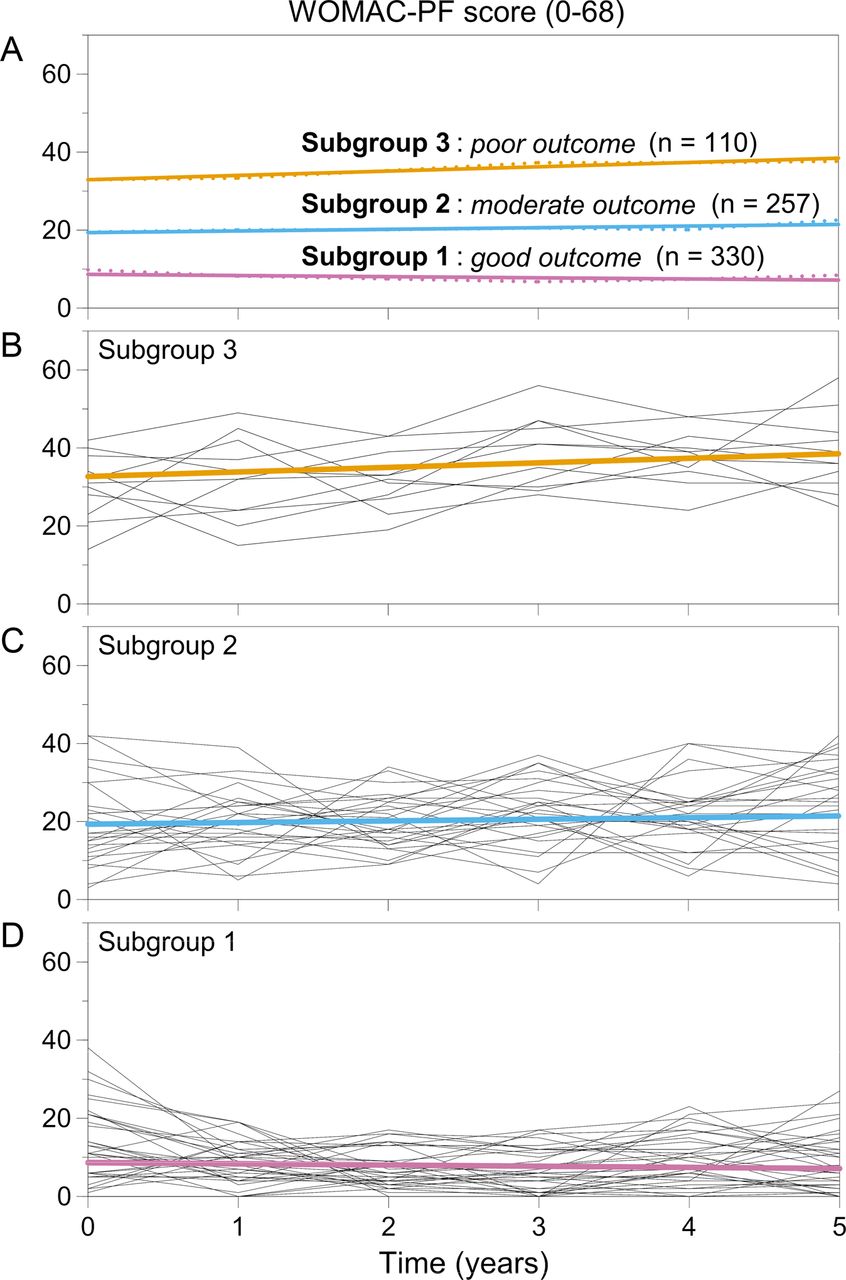
The trajectories of the three classes or subgroups are presented in figure 1. The three subgroups differed both in slope and baseline value of the WOMAC-PF score. To facilitate interpretation of the trajectories in the subgroups, we plotted the individual slopes against the individual baseline levels of activity limitations (figure 2). Subgroup 1 consisted of 330 participants (47.3%). The intercept of the trajectory of Subgroup 1 was 8.7 (95% CI 7.8 to 9.5) and the slope was -0.3 (95% CI −0.5 to −0.1). These participants moved from moderate or high levels of activity limitations at baseline to low levels over 5 years, or reported permanent low levels of activity limitations. For example, in figure 2, the participant indicated with no. 1 reported a moderate outcome of activity limitations at T0 and improved over 5 years of follow-up: she had a WOMAC-PF T0 score of 19 and a slope of -2, leading to a WOMAC-PF T5 score of 9. The participant indicated with no. 2 reported a permanent good outcome of activity limitations: he had a WOMAC-PF T0 score of 7 and a slope of 0, leading to a WOMAC-PF T5 score of 7. Participants in Subgroup 1 were defined as having a ‘good outcome’ on activity limitations.

Trajectories of activity limitations measured by the physical function subscale of the Western Ontario and McMaster Universities Osteoarthritis Index (WOMAC-PF). Higher scores indicate a worse outcome. A=Observed (dotted lines) and estimated (solid lines) mean scores of the three trajectory subgroups. B=Random 10% of observed individual scores and estimated mean score of participants in Subgroup 3 (‘poor outcome’’). C=Random 10% of observed individual scores and estimated mean score of participants in Subgroup 2 (‘moderate outcome’). D=Random 10% of observed individual scores and estimated mean score of participants in Subgroup 1 (‘good outcome’).

Plot of the individual slopes (y-axis) against the baseline scores (x-axis) on activity limitations. A slope of -1 indicates that the score on the physical function subscale of the Western Ontario and McMaster Universities Osteoarthritis Index (WOMAC-PF) decreases on average with 1 point per year. Subgroup 1=participants having a ‘good outcome’ on activity limitations over 5 years. Subgroup 2=participants having a ‘moderate outcome’ on activity limitations over 5 years. Subgroup 3=participants having a ‘poor outcome’ on activity limitations over 5 years. For explanation of the numbers 1–7 in the plot, refer the Results section of the manuscript.
Subgroup 2 consisted of 257 participants (36.9%). The intercept of the trajectory of Subgroup 2 was 19.3 (95% CI 17.7 to 20.9) and the slope was 0.4 (95% CI 0.1 to 0.8). These participants moved from fairly low or fairly high levels of activity limitations to moderate levels over 5 years (eg, the participants indicated with no. 3 and 4 in figure 2), or reported permanent moderate levels of activity limitations (eg, the participant indicated with no. 5 in figure 2). Participants in Subgroup 2 were defined as having a ‘moderate outcome’ on activity limitations.
Subgroup 3 consisted of 110 participants (15.8%). The intercept of the trajectory of Subgroup 3 was 32.7 (95% CI 29.9 to 35.4) and the slope was 1.2 (95% CI 0.6 to 1.7). These participants moved from low or moderate levels of activity limitations to high levels over 5 years (eg, the participant indicated with no. 6 in figure 2), or reported permanent high levels of activity limitations (eg, the participant indicated with no. 7 in figure 2). Participants in Subgroup 3 were defined as having a ‘poor outcome’ on activity limitations.
Characteristics of the subgroups
Results of univariable and multivariable logistic regression analyses comparing participants in the subgroups are shown in tables 3 and 4. Multivariable regression analyses showed that, after adjustment for all other baseline characteristics, participants in Subgroup 2 (‘moderate outcome’), compared with participants in Subgroup 1 (‘good outcome’), were characterised by: a higher BMI, a higher score on the NRS for knee pain, hip pain, presence of ≥3 comorbidities and a lower score on the SF-36 subscale for vitality (table 4). Participants in Subgroup 3 (‘poor outcome’), compared with participants in Subgroup 1 (‘good outcome’), were characterised by: a younger age, a higher score on the NRS for knee pain, presence of bony tenderness, a lower range of active knee flexion, hip pain, presence of osteophytosis, presence of ≥3 comorbidities, a lower score on the SF-36 subscale for vitality and a higher score on the resting subscale of the Pain Coping Inventory.
Results of univariable logistic regression analyses of baseline characteristics associated with subgroup membership (Subgroup 1 ‘good outcome’ (n=330) used as the reference group)
Multivariable logistic regression models of baseline characteristics associated with subgroup membership (Subgroup 1 ‘good outcome’ (n=330) used as the reference group)
Discussion
The present study used data from a 5-year follow-up period of 697 participants with early symptomatic knee OA to identify homogeneous subgroups of patients with distinct trajectories of activity limitations. Three subgroups were identified: (1) a ‘good outcome’, (2) a ‘moderate outcome’ and (3) a 'poor outcome’ subgroup. The validity of this classification is supported by the demographic, clinical and psychological characteristics of these subgroups.
The 5-year change in activity limitations of the ‘good outcome’ and ‘poor outcome’ subgroup (17.2% and 18.3% of the WOMAC-PF baseline score, respectively) exceeded or almost exceeded the criterion for minimal clinically important change (ie, 17% for improvement and 22% for worsening).26 The estimated 5-year change on the WOMAC-PF was -1.5 points in the ‘good outcome’ subgroup, +2 points in the ‘moderate outcome’ subgroup and +6 points in the ‘poor outcome’ subgroup. The average probability of subgroup membership for each estimated subgroup was 92% or higher, suggesting that most participants were correctly classified.
This is the first study in early symptomatic knee OA that used LCGA to examine inter-individual differences in intraindividual change in the course of activity limitations. Because LCGA uses a statistical procedure to test whether the hypothesised trajectory subgroups emerge from the data, this method allows the discovery of unexpected yet potentially meaningful subgroups.27 The identified subgroups remind us of the classification introduced by Sharma et al5 in 2003. Based on clinical reasoning, Sharma et al5 categorised their study population into good and poor outcome subgroups using a quintile grid of baseline and 3-year WOMAC-PF scores. The poor and good outcome subgroups of Sharma et al5 resemble our ‘poor outcome’ and ‘good outcome’ subgroups, respectively. Our ‘moderate outcome’ subgroup is a novel finding. The classification by Sharma et al has been used in several studies without being empirically validated. Although not specifically designed for this purpose, our study provides credence to the Sharma et al5 classification, and refines it by adding the ‘moderate outcome’ subgroup. Studies in other samples are needed to externally validate our findings (ie, replicate the three subgroups with the estimated intercepts and slopes).
In both our classification and the Sharma et al5 classification, the change over time as well as the level of activity limitations at baseline defines subgroups of participants with distinct trajectories of activity limitations. The ‘poor outcome’ subgroup showed more activity limitations at baseline and a greater worsening of activity limitations than the ‘moderate outcome’ and ‘good outcome’ subgroup. This can be explained by a ‘horse-racing effect’ (ie, a person whose level of activity limitations has been increasing faster than average previously—and who as a result of this has a higher than average level of activity limitations at baseline—will continue to increase in activity limitations faster than average in the future).28 There were also participants who did not change in activity limitations. Apparently, although our study population was recruited at inception of symptoms, some participants have already deteriorated before inclusion and showed no or little additional change during the study. This emphasises the need to consider both factors related to change and factors related to stable low function states in developing prevention programmes, and is an interesting finding for further research.5
The characteristics of the subgroups are consistent with existing knowledge on prognostic factors regarding activity limitations in knee OA, which supports the validity of our classification. Compared with participants in the ‘good outcome’ subgroup, participants in the ‘moderate outcome’ and ‘poor outcome’ subgroups were characterised by: younger age, a higher BMI, more pain, bony tenderness, a reduced range of knee flexion, hip pain, osteophytosis, ≥3 comorbidities, lower vitality or avoidance of activities. This is in accordance with other longitudinal studies that have identified higher BMI,2 ,4 ,5 ,29 greater knee pain,2 ,5 ,30 bony tenderness,29 concomitant hip pain,4 severity of radiographic knee OA,29 comorbidity,4 ,30 ,31 low vitality31 and avoidance of physical activities30 as risk factors for a poor outcome on activity limitations. Osteophytosis, comorbidities, bony tenderness and concomitant hip pain were strongest associated with membership of the ‘poor outcome’ subgroup.
A major strength of our study is that the study population was assembled at inception of symptoms. This is important because if observation is begun at different points in the course of OA for the various participants, description of their prognosis will lack precision.32 Our study may be criticised for not studying participants meeting criteria for clinical OA or radiographic OA. The pathophysiology of OA is poorly understood; there is little relation between clinical features and structural tissue changes, and some OA phenotypes may develop radiographic signs only late in the disease process.8 We believe that the onset of symptoms is the best starting point to study the course of the disease, including the course of activity limitations. A sensitivity analysis in participants who fulfilled the ACR clinical criteria for knee OA (n=606) yielded similar results (data not shown). Additional strengths are the longitudinal design with six measurements over a 5-year follow-up period; the use of LCGA taking into account heterogeneity in the course of activity limitations; the use of a plot of individual change against the baseline level of activity limitations, which facilitated interpretation of trajectories in the three identified subgroups; and the regression analyses to describe differences in characteristics between the subgroups. A final comment concerns LCGA: although LCGA is an attractive method to identify homogeneous subgroups, the choice of the most appropriate number of subgroups remains somewhat arbitrary, requiring clinical and statistical judgment.9 ,20 Based on strong arguments (see Results section), we judged the three-group model as most appropriate.
For clinicians it is important to be aware that the knee OA population consists of subgroups with differing prognoses regarding activity limitations. Furthermore, identification of homogeneous subgroups may contribute to the development of tailored preventive interventions in knee OA patients.5–8
In conclusion, based on the 5-year course of activity limitations, three trajectory subgroups of knee OA patients were identified. The characteristics of these subgroups were consistent with existing knowledge on prognostic factors regarding activity limitations, which supports the validity of this classification.
Acknowledgments
CHECK is funded by the Dutch Arthritis Association. It is led by a steering committee comprised of 16 members with expertise in different fields of OA. It is chaired by Professor JWJ Bijlsma and coordinated by J Wesseling, MSc. The following institutions are involved: Erasmus Medical Centre Rotterdam; Kennemer Gasthuis Haarlem; Leiden University Medical Centre; Maastricht University Medical Centre; Martini Hospital Groningen/Allied Health Care Centre for Rheumatology and Rehabilitation Groningen; Medical Spectrum Twente Enschede/Ziekenhuisgroep Twente; Reade, Centre for Rehabilitation and Rheumatology (formerly Jan van Breemen Institute)/VU Medical Centre Amsterdam; St. Maartenskliniek Nijmegen; University Medical Centre Utrecht; and Wilhelmina Hospital Assen.
References
Footnotes
-
Handling editor Tore K Kvien
-
Contributors All authors contributed substantially to the conception and design of the study and interpreted data. LDR collected data. JFMH and MWH analysed data. JFMH, MvdL and JD prepared the first draft of the report. All authors contributed to revision of the report and approved the final version.
-
Funding This work was supported by the Dutch Arthritis Association. The sponsor of the study was not involved in study design, data collection, data analysis, interpretation of data and writing of the report.
-
Competing interests None.
-
Disclaimer The views expressed are those of the authors and not necessarily those of the CHECK steering committee.
-
Patient consent Obtained.
-
Data sharing statement No additional data are available. More information about the CHECK study is available at http://www.check-research.com.
-
Ethics approval The study was approved by the medical ethics committees of all centres participating in the CHECK study.
-
Provenance and peer review Not commissioned; externally peer reviewed.