Article Text

Abstract
Objectives EuroQoL-5 dimension (EQ-5D) is a standardised preference-based tool for measurement of health-related quality of life and EQ-5D utility values can be converted to quality-adjusted life years (QALYs) to aid cost-utility analysis. This study aimed to evaluate the EQ-5D utility values of 639 patients with primary Sjögren's syndrome (PSS) in the UK.
Methods Prospective data collected using a standardised pro forma were compared with UK normative data. Relationships between utility values and the clinical and laboratory features of PSS were explored.
Results The proportion of patients with PSS reporting any problem in mobility, self-care, usual activities, pain/discomfort and anxiety/depression were 42.2%, 16.7%, 56.6%, 80.6% and 49.4%, respectively, compared with 5.4%, 1.6%, 7.9%, 30.2% and 15.7% for the UK general population. The median EQ-5D utility value was 0.691 (IQR 0.587–0.796, range −0.239 to 1.000) with a bimodal distribution. Bivariate correlation analysis revealed significant correlations between EQ-5D utility values and many clinical features of PSS, but most strongly with pain, depression and fatigue (R values>0.5). After adjusting for age and sex differences, multiple regression analysis identified pain and depression as the two most important predictors of EQ-5D utility values, accounting for 48% of the variability. Anxiety, fatigue and body mass index were other statistically significant predictors, but they accounted for <5% in variability.
Conclusions This is the first report on the EQ-5D utility values of patients with PSS. These patients have significantly impaired utility values compared with the UK general population. EQ-5D utility values are significantly related to pain and depression scores in PSS.
- Sjagren's Syndrome
- Qualitative research
- Epidemiology
Statistics from Altmetric.com
Introduction
Health-related quality of life (HRQoL) is an important consideration for healthcare policy decision-makers.1 For instance, the UK National Institute for Health and Clinical Excellence recommends that the benefits of new treatments be assessed in quality-adjusted life years (QALYs), which are the product of HRQoL and survival. To estimate QALYs, HRQoL must be expressed as a preference-weighted single index (utility). By incorporating ‘values’ for aspects of HRQoL into the utility index, the preferences of individuals about relative worth can be captured.
EuroQoL-5 dimension (EQ-5D) is one of the most widely accepted preference-based generic utility instruments.1 It measures an individual's status over five domains, each of which is focused on three or five states of being rather than how an individual feels about being in that state. Utility values for the possible states are obtained about the preferences of the general population for combinations of states across domains, including perfect health which is one of the states to be valued. As a generic measure, EQ-5D does not reflect outcomes specific to a particular condition and there is a debate about the relative merits of generic versus condition-specific preference-based measures. Preferences for states described by generic measures need only be collected once, while it is an onerous task to collect values for condition-specific measures. Condition-specific measures reflect the outcomes of interest to the patients concerned whereas generic measures may not and, even if they do, they may not be sufficiently sensitive to capture the effects of interventions. However, generic utility instruments such as EQ-5D allow data to be compared across diseases.
To date, primary Sjögren's syndrome (PSS)-specific HRQoL instruments, in particular measures that can be mapped to utility values for health-economic evaluation, have not been developed. A method that has been used to address the issue of condition-specific measures versus generic measures is to map by regression condition-specific outcomes to responses from a preference-based measure.2 The advantage of this approach is that it theoretically allows preference-based measures to be constructed from condition-specific measures, removing the need to value the states described in the condition-specific measures.
In this study we evaluated the EQ-5D utility values of a multicentre cohort of 639 clinically well-characterised patients with PSS in the UK and determined the predictors of EQ-5D utility values. Our data also enabled us to examine the relationships between PSS-specific measures and EQ-5D utility values.
Methods
Subjects
All patients with PSS are participants in the UK PSS Registry (UKPSSR, http://www.sjogrensregistry.org).3 All participants fulfil the American European Consensus Group classification criteria.4 All clinical and laboratory data were collected prospectively using a standardised pro forma at the time of recruitment, as previously described.3 The following patient-reported outcome measures were collected for all UKPSSR PSS subjects: European League Against Rheumatism (EULAR) Sjögren's Syndrome Disease Activity Index (ESSDAI),5 EULAR Sjögren's Syndrome Patient Reported Index (ESSPRI)6 (overall symptom burden), EULAR sicca scale6 (overall dryness), Profile of fatigue and discomfort (Pro-F)7 (fatigue and bodily pain), Epworth Sleepiness Scale (ESS)8 (daytime sleepiness), Orthostatic grading scale (OGS)9 (symptoms of postural hypotension), Hospital Anxiety and Depression Scale (HADS)10 (anxiety and depression) and EQ-5D (http://www.euroqol.org) (HRQoL).
EQ-5D
The EQ-5D assesses five different dimensions of health (mobility, self-care, usual activities, pain/discomfort and anxiety/depression). Each dimension can be scored by three possible responses: no problems, some/moderate problems or severe problems, corresponding to a score of 0–2. The score is converted into a ‘health state’ (eg, 00112), and each of the possible 243 states is mapped to a single utility value11 for cost-utility analysis (where a value of 1 represents perfect health, 0 represents death and a value of <0 represents a ‘health state’ ie, worse than death). The EQ-5D utility values were derived by asking survey participants to consider a ‘time trade-off’ between a shorter survival time in full health and a longer time in a worse ‘health state’ described using the EQ-5D.12 Individual's perception of his/her health is also recorded on a 0–100 visual analogue scale (VAS) with 0 being ‘worst imaginable health state’ and 100 being ‘best imaginable health state’.
Data analysis
UK reference data11 provided by the EuroQoL group were used to compare the EQ-5D data of the PSS cohort. Many of the clinical and psychological parameters were not normally distributed. Accordingly, data are reported mainly as medians with IQR (25th and 75th percentiles). Similarly, non-parametric Spearman correlations were used to investigate pairwise. p Values are reported unadjusted for multiple testing, permitting the application of preferred methods of adjustment by the readers. All modelling work was performed on a randomly selected sample of two-thirds of the cases (the ‘modelling set’) before validation of the model against the remaining one-third of cases (the ‘validation set’). Multiple regression analysis of logit-transformed rescaled utility values permitted assessment of potential predictors of EQ-5D utility values after adjusting for age, sex and other covariates. Dichotomous variables (sex and autoantibody status) were included as dummy variables. Predicted utility values were back-transformed to the original scale. An initial stepwise multiple regression analysis on the modelling set was used to identify potential candidates for inclusion in the model. The probabilities for inclusion and removal from the model were 0.05 and 0.10, respectively. Simple models adjusting for age, sex and including individual predictors were compared with competing models adjusting for age, sex and including multiple predictors. These models were used to assess the potential impact of predictors on EQ-5D utility values.13 Cluster analysis was used to develop a simple heuristic decision tree based on the most important predictors identified in the regression model to stratify patient outcomes by maximising the distance between clusters in multivariate space for the training set before validating the decision rule using the validation set.
Results
Patient characteristics
The clinical characteristics of the 639 patients with PSS are summarised in table 1.
Clinical characteristics of the PSS cohort
Health status and utility values of patients with PSS
The proportions of patients with PSS experiencing any problems in the five dimensions of health were 42.2% (mobility), 16.7% (self-care), 56.6% (usual activities), 80.6% (pain/discomfort) and 49.4% (anxiety/depression), which were substantially higher than the general population of the UK (5.4%, 1.6%, 7.9%, 30.2, 15.7% respectively; figure 1A and supplementary figure S1).

Health status and utility values of the UK primary Sjogren's syndrome (PSS) Registry (UKPSSR) cohort and its comparison with reference data of the UK general population. (A) Percentage of subjects reporting problems in the five individual domains of EuroQoL-5 dimension (EQ-5D). (B) Distribution of EQ-5D utility values among the UKPSSR cohort. TTO, time trade off (utility value).

Spearman correlation coefficients for clinical and laboratory features of primary Sjögren's syndrome and EuroQoL-5 dimension utility values. p Values are reported unadjusted for multiple testing: *p<0.05, **p<0.01, ***p<0.001. BMI, body mass index; CRP, C-reactive protein; ESR, erythrocyte sedimentation rate; OSF, oral salivary flow.
The EQ-5D utility values ranged from −0.239 to 1.000 (median 0.691, IQR 0.587–0.796), with a bimodal distribution (figure 1B). The mean EQ-5D utility value (0.62) is considerably lower than that of the UK general population (0.86).
Relationship between EQ-5D utility values and clinical/laboratory features of PSS
To investigate the relationship between EQ-5D utility values and clinical/laboratory features of PSS, we first conducted a correlation analysis between the utility value and a set of pre-specified parameters including demographics (age, sex), measures of disease activity and severity (disease and symptom durations, ESSDAI, erythrocyte sedimentation rate (ESR), C-reactive protein (CRP), serum immunoglobulin G (IgG), C3, C4, oral salivary flow, Schirmer's test), physician's assessment of disease damage, autoantibody status and patient reported outcomes (ESSPRI, EULAR-Sicca score), pain, fatigue (physical fatigue, mental fatigue and overall fatigue), anxiety, depression, daytime somnolence, orthostatic intolerance and other potentially relevant factors (body mass index (BMI)). These parameters were chosen based on data from previous studies and potential biological links with HRQoL. Given the large number of correlation tests performed, the false positive rate is likely to be greater than the nominal value of 0.05. However, even adopting a more conservative p value of, say, p<0.001, there were clear correlations between utility values and many clinical features of PSS (figure 2), with physical fatigue, pain, depression and overall symptom burden (ESSPRI) being the most strongly associated parameters. Utility values were significantly correlated with patient assessments as measured by EQ-5D VAS scores (r=0.599; p<0.001). Somewhat unexpectedly, patients positive for anti-Ro or anti-La antibodies and those with high levels of serum IgG or low levels of serum C3 or C4 (indicative of increased disease activity in the biological domain) were associated with higher utility values.

Observed EuroQoL-5 dimension utility values in the validation dataset and values predicted by the regression model. The horizontal line delineates patients with poorer outcomes (utility value <0.500) and the vertical line delineates patients with poorer predicted outcomes (utility value <0.500). The filled circles represent those patients with predicted utility values ≥0.500. The open circles represent those with poorer predicted outcomes (utility value <0.500). If the model were perfect then all the filled circles would be in the upper right quadrant and all the open circles in the lower left quadrant. The model was not perfect but performed reasonably well in predicting patients with poorer outcomes in the test dataset and there was good agreement between the test and validating datasets. The model accounted for more than 42% of the variability in utility values in the test dataset. TTO, time trade off (utility value).
To determine the key predictors of the utility values of patients with PSS we first performed a stepwise multiple regression analysis on the modelling set of cases. Pain and depression emerged as the most important predictors (p<0.001), accounting for almost half of the variability in EQ-5D utility values. Anxiety, fatigue and BMI are other statistically significant independent predictors of utility values in PSS, but accounting for <5% of the variability (table 2). Although the sample size for men was relatively small (n=35), men with PSS reported higher utility values than women (p<0.001), consistent with the gender difference in HRQoL for the UK general population.
Multiple linear regression models of EQ-5D utility values and candidate predictors
Surprised that fatigue and dryness did not account for more variability in EQ-5D utility values, we went on to investigate pain, depression, anxiety, fatigue and dryness as single predictors after adjusting for age and sex differences. These additional analyses are described more fully in the online supplementary analysis. The final model including pain, depression, anxiety, fatigue and dryness in addition to age, sex and BMI performed well in predicting utility values in the ‘validation’ cases (figure 3).
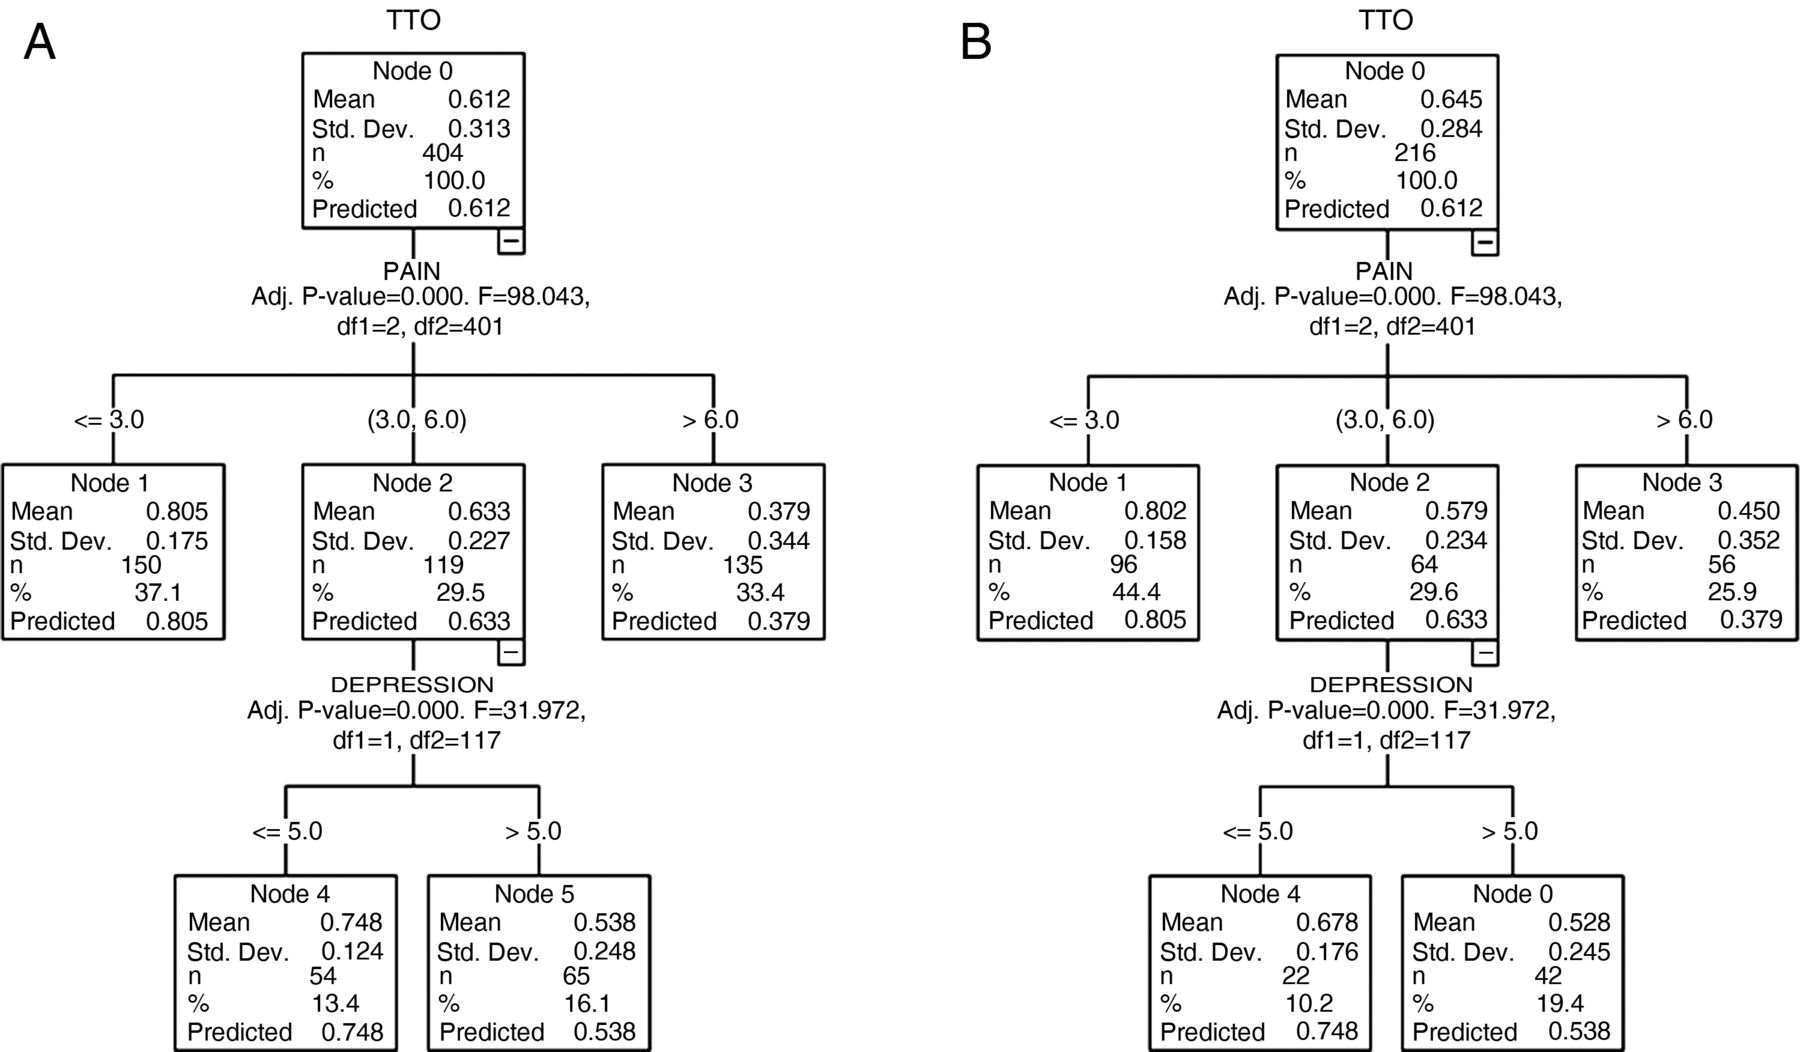
Heuristic decision tree for stratification of EuroQoL-5 dimension utility values. (A) Cluster analysis was used to develop a simple heuristic tool to stratify likely utility values for use in a clinical setting. A random subset of approximately two-thirds of the data (‘modelling set’) was used to develop the decision tree model. Patients with pain scores ≤3 had good outcomes (Node 1). Patients with pain scores >6 had poor outcomes (Node 3). And for those with pain scores between 3 and 6 (Node 2), the outcome depended upon the depression scores. Those with relatively lower depression scores (≤5) had relatively good outcomes (Node 4). Those with higher depression scores (>5) had poorer outcomes (Node 5). (B) This simple decision model was validated using the remaining cases (validation set). The decision tree performed reasonably well, with the mean utility values of the ‘validation set’ for each node approximating the values from the ‘modelling set’. TTO, time trade off (utility value).
To develop a more pragmatic tool to stratify PSS patients based on their EQ-5D utility values, we used cluster analysis on cases in the modelling set to devise a simple heuristic decision tree. With this model, patients with pain scores of ≤3 (out of 10) have high EQ-5D utility values (mean=0.805) and those with pain scores of >6 have poor EQ-5D utility value (mean=0.379). For patients with pain scores between 3 and 6, the outcome depended upon the depression scores. Those with depression scores ≤5 had relatively high utility values while those with a depression score >5 had lower utility values (figure 4A). This simple decision model was validated using the remaining cases (validation set). The model performed well with the observed mean utility values of the validation set for each node approximating the mean values from the modelling set (figure 4B). The greatest departure from the model was for those patients with moderate pain and low depression scores, but this was also the group with the smallest sample size.
Pain and depression are common features in patients with fibromyalgia. In our cohort, 8.7% of patients with PSS had co-existing fibromyalgic symptoms. However, the median (IQR) EQ-5D utility values were similar between those with fibromyalgic symptoms (0.69 (0.62–0.81)) and those without (0.69 (0.59–0.80)). Furthermore, the percentage of patients with fibromyalgic symptoms with poorer EQ-5D utility values (<0.5) (7.7%) was similar to those with better EQ-5D utility values (≥0.5) (8.9%).
Discussion
To our knowledge, this is the first large study to explore health-related utility values in patients with PSS. There is currently no preference-based measure of outcomes for patients with PSS, and generic instruments such as EQ-5D offer the only way that preferences can be incorporated into clinical studies. EQ-5D can be reported either descriptively according to the individual dimension of HRQoL or as a single utility value. Given the increasing emphasis on health economic evaluation of diseases and the growing interest in the development of novel therapies or repurposing existing therapies for PSS,14 we have focused our analysis on the identification of groups of patients with poorer HRQoL as measured by these utility values.
A key strength of this study is that a large PSS cohort recruited from 30 centres across the UK was used, increasing the power and ecological validity of the data. Furthermore, the availability of contemporaneous comprehensive clinical data enables a detailed investigation of the relationships between EQ-5D utility value and clinical features of PSS.
This study demonstrates that patients with PSS have markedly impaired utility values compared with the UK general population, with a subset of patients having particularly poor utility values. Pain and depression were the key determinants of EQ-5D utility values in PSS, although the majority of this cohort did not suffer from clinically significant depression based on their depression scores (ie, HADS-D>10) (see online supplementary figure S2). Our data also identified fatigue, anxiety and BMI as statistically significant predictors, but their relative contribution was small.
Dryness, fatigue and musculoskeletal pain are cardinal symptoms of PSS, with dryness and fatigue often regarded by patients as symptoms that are most in need of improvement (41.6% and 38.6% of this cohort ranked dryness and fatigue, respectively, as the symptoms most in need of improvement). Our findings that pain and depression scores were the most important independent predictors were therefore unforeseen. Analyses of HRQoL in PSS using Medical Outcomes Study Short Form-36 (SF-36) have revealed a large number of predictors in different studies but, overall, fatigue appears to be a major factor although psychological factors also contribute.15 There are many co-dependent variables that contribute to HRQoL. Some of these may have a direct effect on outcomes while others may exert their effects indirectly. Multivariate methods coupled with a large sample size permit partitioning of the variability in HRQoL into its component parts. Previously, multivariate analysis was performed in only two studies,16 ,17 only one of which had a sample size of >200.16 Segal et al demonstrated that somatic fatigue was the dominant predictor of physical function and of general health while depression was the key predictor of emotional well-being. Pain severity and age also independently predicted physical functioning.16 Meijer and co-workers showed that fatigue, tendomyalgia, comorbidity, male sex and receiving disability compensation were independently associated with a reduced physical component score while fatigue, articular involvement, use of antidepressants, artificial saliva use and comorbidity were independently associated with a reduced mental component score.17 Depression and anxiety, however, were not measured directly, and the indications for antidepressant use were not reported.
Therefore, there are similarities but also differences between our data and those derived from studies using SF-36, particularly with regard to the relative contribution of fatigue as predictors of HRQoL. In our study fatigue was a relatively weak predictor of EQ-5D utility values, accounting for only 2% of the variance. In comparison, somatic fatigue contributed to 7% and 8% of the variance of SF-36 physical function and general health scores, respectively, but was not an independent predictor of emotional well-being in the study by Segal et al. The relative contributions of fatigue to the variance of physical and mental component scores were not reported in the study by Meijer et al. As EQ-5D utility values combine physical and psychological well-being in scores, this may provide an explanation for the relatively weak contribution of somatic fatigue from our data. Furthermore, given the significant correlation between fatigue and depression scores, fatigue may indirectly affect HRQoL through its impact upon depressive symptoms (see online supplement 2). In this study, dryness predicted utility values poorly, corroborating the data from studies using SF-36 for assessing HRQoL.15 However, both EQ-5D and SF-36 are generic tools and neither measure dryness symptoms directly.
Predictors do not necessarily equate to causative factors. However, until PSS-specific preference-based outcome tools are available, our data could be used for estimating the impact of treating different symptoms of patients with PSS on utility values (for interested readers, see online supplementary figure S3), which in turn could be converted into QALYs for cost-utility analysis. Such a model may be useful for the future design of clinical trials evaluating therapeutic interventions for PSS.
We also developed a heuristic decision tree model which may be useful for identifying patients for targeted intervention in order to improve their QALYs. Our model suggests that better understanding of the underlying mechanisms of pain and targeted pain management for those with a high pain score may be important. It is also noteworthy that, in our model, a cut-off value of depression score of 5 (ie, subclinical level) differentiates patients with moderate pain who have good utility values from those with poor utility values, indicating that identifying subclinical depressive symptoms and the contributing factors of depressive symptoms in PSS may be important in the management of the condition.
In this paper we have mapped condition-specific measures to EQ-5D utility values. Our results suggest that there is a possible conflict between the current clinical management of patients with PSS and the potential available QALY gains. Treating fatigue and dryness, which are often viewed as the most debilitating complaints by patients and clinicians, may result in lower QALY gains than treating pain and depression if EQ-5D is used in an evaluation. A key conclusion of our analysis is therefore that EQ-5D should be used with caution in clinical trials of patients with PSS. Expert opinion is another mechanism that has been used to map condition-specific outcomes to utility values, although research suggests that this approach does not always reflect patients’ preferences.18 An alternative method to estimate utility values is to use condition-specific preference-based measures. This involves the valuation of PSS-specific health states.19 Such an approach would have the advantage of accurately reflecting the preferences of patients with PSS, but would potentially involve considerable effort in valuing the relevant states and comparability with other disease areas can be a problem. Such an approach is, however, consistent with the US Food and Drug Administration guidelines which promote the use of patient-reported outcome measures and discourage the use of generic measures.20
In conclusion, patients with PSS have markedly impaired utility values, with pain and depression being key predictors. The relative contribution of the symptoms of fatigue and dryness to overall EQ-5D utility values was small, but may reflect the inherent insensitivity of generic HRQoL instruments in capturing the impact of such symptoms on HRQoL. Further study to understand the underlying mechanisms of pain and depressive (including subclinical) symptoms in PSS is warranted.
Acknowledgments
We would like to thank all the patients and healthy volunteers who have participated in the UKPSSR.
References
Supplementary materials
Supplementary Data
This web only file has been produced by the BMJ Publishing Group from an electronic file supplied by the author(s) and has not been edited for content.
Files in this Data Supplement:
- Data supplement 1 - Online analyses
- Data supplement 2 - Online appendix
- Data supplement 3 - Online figures
Footnotes
-
Handling editor Tore K Kvien
-
Collaborators UK primary Sjögren's Syndrome Registry: Denotes corporate authorship (see online supplement 1 for the full list of members).
-
Contributors WFN and SB conceptualised the study. WFN, DL and PM designed the study and wrote the manuscript. SM coordinated the data collection. WFN, DL, SM and PM performed the data analysis and interpretation. All other authors were involved in data collection, data interpretation and writing of the manuscript.
-
Funding This study received grant support from the Medical Research Council (G0800629 to WFN, SB, BG) for the creation of the UKPSSR. This work also received infrastructure support from the Newcastle NIHR Biomedical Research Centre, Northumberland, Tyne and Wear Comprehensive Local Research Network (CLRN) and the CLRNs to the recruiting centres.
-
Competing interests None.
-
Patient consent Informed consent was obtained from all patients according to the principles of the Helsinki Declaration.
-
Ethics approval Ethical approval was obtained from the North West Haydock Research Ethics Committee.
-
Provenance and peer review Not commissioned; externally peer reviewed.
-
Data sharing statement The authors will consider sharing of all the linked anonymised data presented in this manuscript upon requests.