Article Text

Abstract
The Osteoarthritis Initiative (OAI) is a multicentre, prospective, observational, cohort study of knee osteoarthritis (OA) that began recruitment in 2004. The OAI provides public access to clinical and image data, enabling researchers to examine risk factors/predictors and the natural history of knee OA incidence and progression, and the qualification of imaging and other biomarkers. In this narrative review, we report imaging findings and lessons learned 10 years after enrolment has started. A literature search for full text articles published from the OAI was performed up to 31 December 2013 using Pubmed and the OAI web page.
We summarise the rationale, design and imaging protocol of the OAI, and the history of OAI publications. We review studies from early partial, and later full OAI public data releases. The latter are structured by imaging method and tissue, reviewing radiography and then MRI findings on cartilage morphology, cartilage lesions and composition (T2), bone, meniscus, muscle and adipose tissue. Finally, analyses directly comparing findings from MRI and radiography are summarised. Ten years after the first participants were enrolled and first papers published, the OAI has become an invaluable resource to the OA research community. It has fuelled novel methodological approaches of analysing images, and has provided a wealth of information on OA pathophysiology. Continued collection and public release of long-term observations will help imaging measures to gain scientific and regulatory acceptance as ‘prognostic’ or ‘efficacy of intervention’ biomarkers, potentially enabling shorter and more efficient clinical trials that can test structure-modifying therapeutic interventions (NCT00080171).
- Magnetic Resonance Imaging
- Osteoarthritis
- Knee Osteoarthritis
Statistics from Altmetric.com
Introduction
Osteoarthritis (OA) is among the most disabling diseases in developed countries, but currently, no disease-modifying OA drugs (DMOAD) to slow or stop the progression of structural changes have been approved.1 The discovery and qualification of OA (imaging) biomarkers, however, could lead to identification of new targets and treatment mechanisms, and to more efficient DMOAD trials.1 Therefore, the Osteoarthritis Initiative (OAI) was launched in 2002, as a multicentre, longitudinal, and prospective observational study of knee OA, supported by a partnership of the National Institute of health (NIH), the private sector, and other funding agencies (ClinicalTrials.gov Identifier:NCT00080171). The aim was to provide a public access research resource that facilitates worldwide scientific exploration of OA genetic, molecular and imaging biomarkers as surrogates for disease onset and progression, and encourage development of new methodological approaches. Starting in 2004,2 four OAI clinical centres recruited 4796 participants, collecting traditional and novel clinical, imaging and biospecimen-related data. To support investigation of a broad range of research questions, 1396 participants with symptomatic knee OA (frequent pain and definite radiographic signs) of at least one knee (‘progression cohort’), 3278 with an increased risk of developing symptomatic OA (‘incidence cohort’) and 122 without knee OA or risk factors (‘normal cohort’) were enrolled.3 They were aged 45–79 years, 58% women, and from different ethnic backgrounds (21% non-whites). By 2011, the entire OAI cohort had completed detailed annual structured visits from baseline (BL) through 48 months (48M), with a retention rate of 90% (81% for clinic visits).1
Each centre was equipped with the same manufacturer and model 3 Tesla (T) MRI scanner.3 Designed to support analysis of multiple qualitative and quantitative imaging outcomes, the OAI image acquisition protocol3 ,4 encompassed fixed flexion radiographs of the knee (figure 1A), hand and hip X-rays, and MRIs of the knee and thigh (figures 1B–I and 2). Monthly MRI quality assurance procedures with phantoms revealed consistency between the sites, assuring that the data could be pooled and were sufficiently stable to support longitudinal comparisons5 ,6 (table 2). All joint images for the entire cohort are available through the OAI webpage (http://www.ucsf.edu)3 for researchers to investigate the ability of imaging biomarkers to predict knee OA incidence or progression.1 Additionally, results of image analyses of most knee radiographs and of some knee MRIs (ie, baseline as well as 1-year and 2-year follow-up data from a core progression cohort of 600 participants) have been released3: Baseline knee radiographs were initially read at the clinic sites to determine cohort assignment, while the baseline through 48-month clinic visit knee radiographs were evaluated centrally to identify incident and progressive radiographic OA. However, readings on hand or hip radiographs, or thigh MRIs are not yet publicly available. By 2013, almost 3000 users from 83 countries had registered for access to OAI Online to receive clinical or image sets from the OAI.1 The number of OAI publications has steadily increased since 2006 (Figure 3), with the number addressing specific tissues shown in table 1.
Number of OAI publications addressing certain tissues and measurement types

OAI image acquisition protocol (part 1). (A) AP fixed flexion radiograph, showing minimum and fixed location medial JSW measurement. (B) Coronal intermediately weighed turbo spin echo acquisition (COR IW 2D TSE). (C) Coronal T1-weighted fast low-angle shot with water excitation (COR T1W 3D FLASH WE), showing segmentation of the cartilage surface (AC) and bone interface (tAB) of the medial tibia, and segmentation of the medial femur (cartilage filling in yellow). (D) Sagittal double echo steady state with water excitation (SAG 3D DESS WE) showing segmentation of the medial tibia and femur as in C, and separation of the weight-bearing and posterior femoral condyle. (E) Coronal multiplanar reconstruction of (D) (COR MPR 3D DESS WE) showing segmentation as in (C). (F) Axial multiplanar reconstruction of (D) (AXIALMPR 3D DESS WE). (G) Localiser showing location of 15 0.5 axial MRI slices acquired in the thigh, 10 cm proximal to the distal femoral epiphyses (per OAI acquisition protocol). (H) Axial T1-weighed spinecho (T1w SE) of the left and right thighs, showing segmentation of the muscles on the left (right limb), including the quadriceps heads, and intermuscular (magenta) and subcutaneous adipose tissue (green) on the right (left limb). (I) 3D reconstruction of the knee, showing various joint structures and tissues after segmentation: The tibial cartilage is shown in yellow, the menisci in red, the anterior cruciate ligament (ACL) in blue, the PCL in green, and the patella in gray. Grid lines indicate the patella tendon and the muscles, including the medial and lateral vastus.
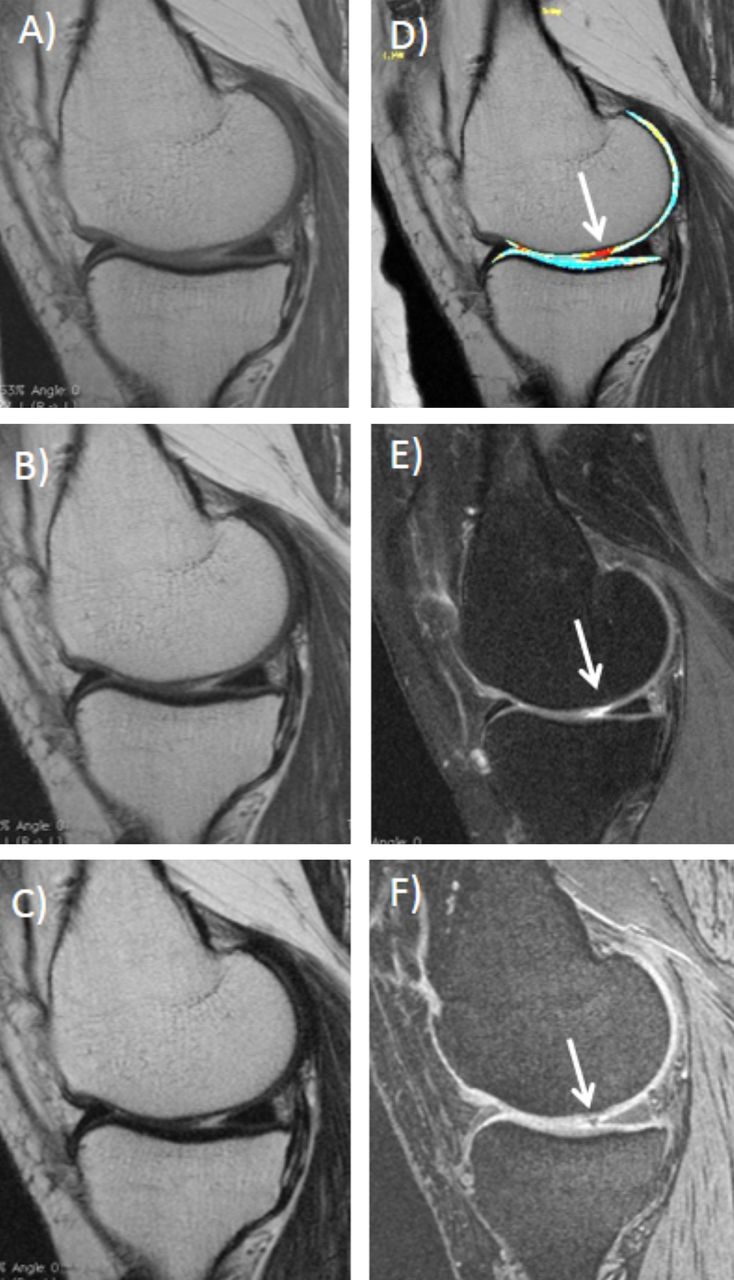
OAI image acquisition protocol/Part 2: (A) Sagittal multiecho spin echo (MESE) with the shortest TE (10 ms). (B) Sagittal multiecho spin echo (MESE) with intermediate TE (40 ms). (C) Sagittal multiecho spin echo (MESE) with the longest TE (70 ms). (D) T2 map generated from MESE images with 10, 20, 30, 40, 50, 60 and 70 ms TEs. (E) Sagittal intermediate weighted turbo spin echo with fat suppression (SAG IW 2D TSE FS). (F) Sagittal double echo steady state with water excitation (SAG 3D DESS WE). The images show a cartilage lesion in the weight-bearing part of the medial femoral condyle (arrow).

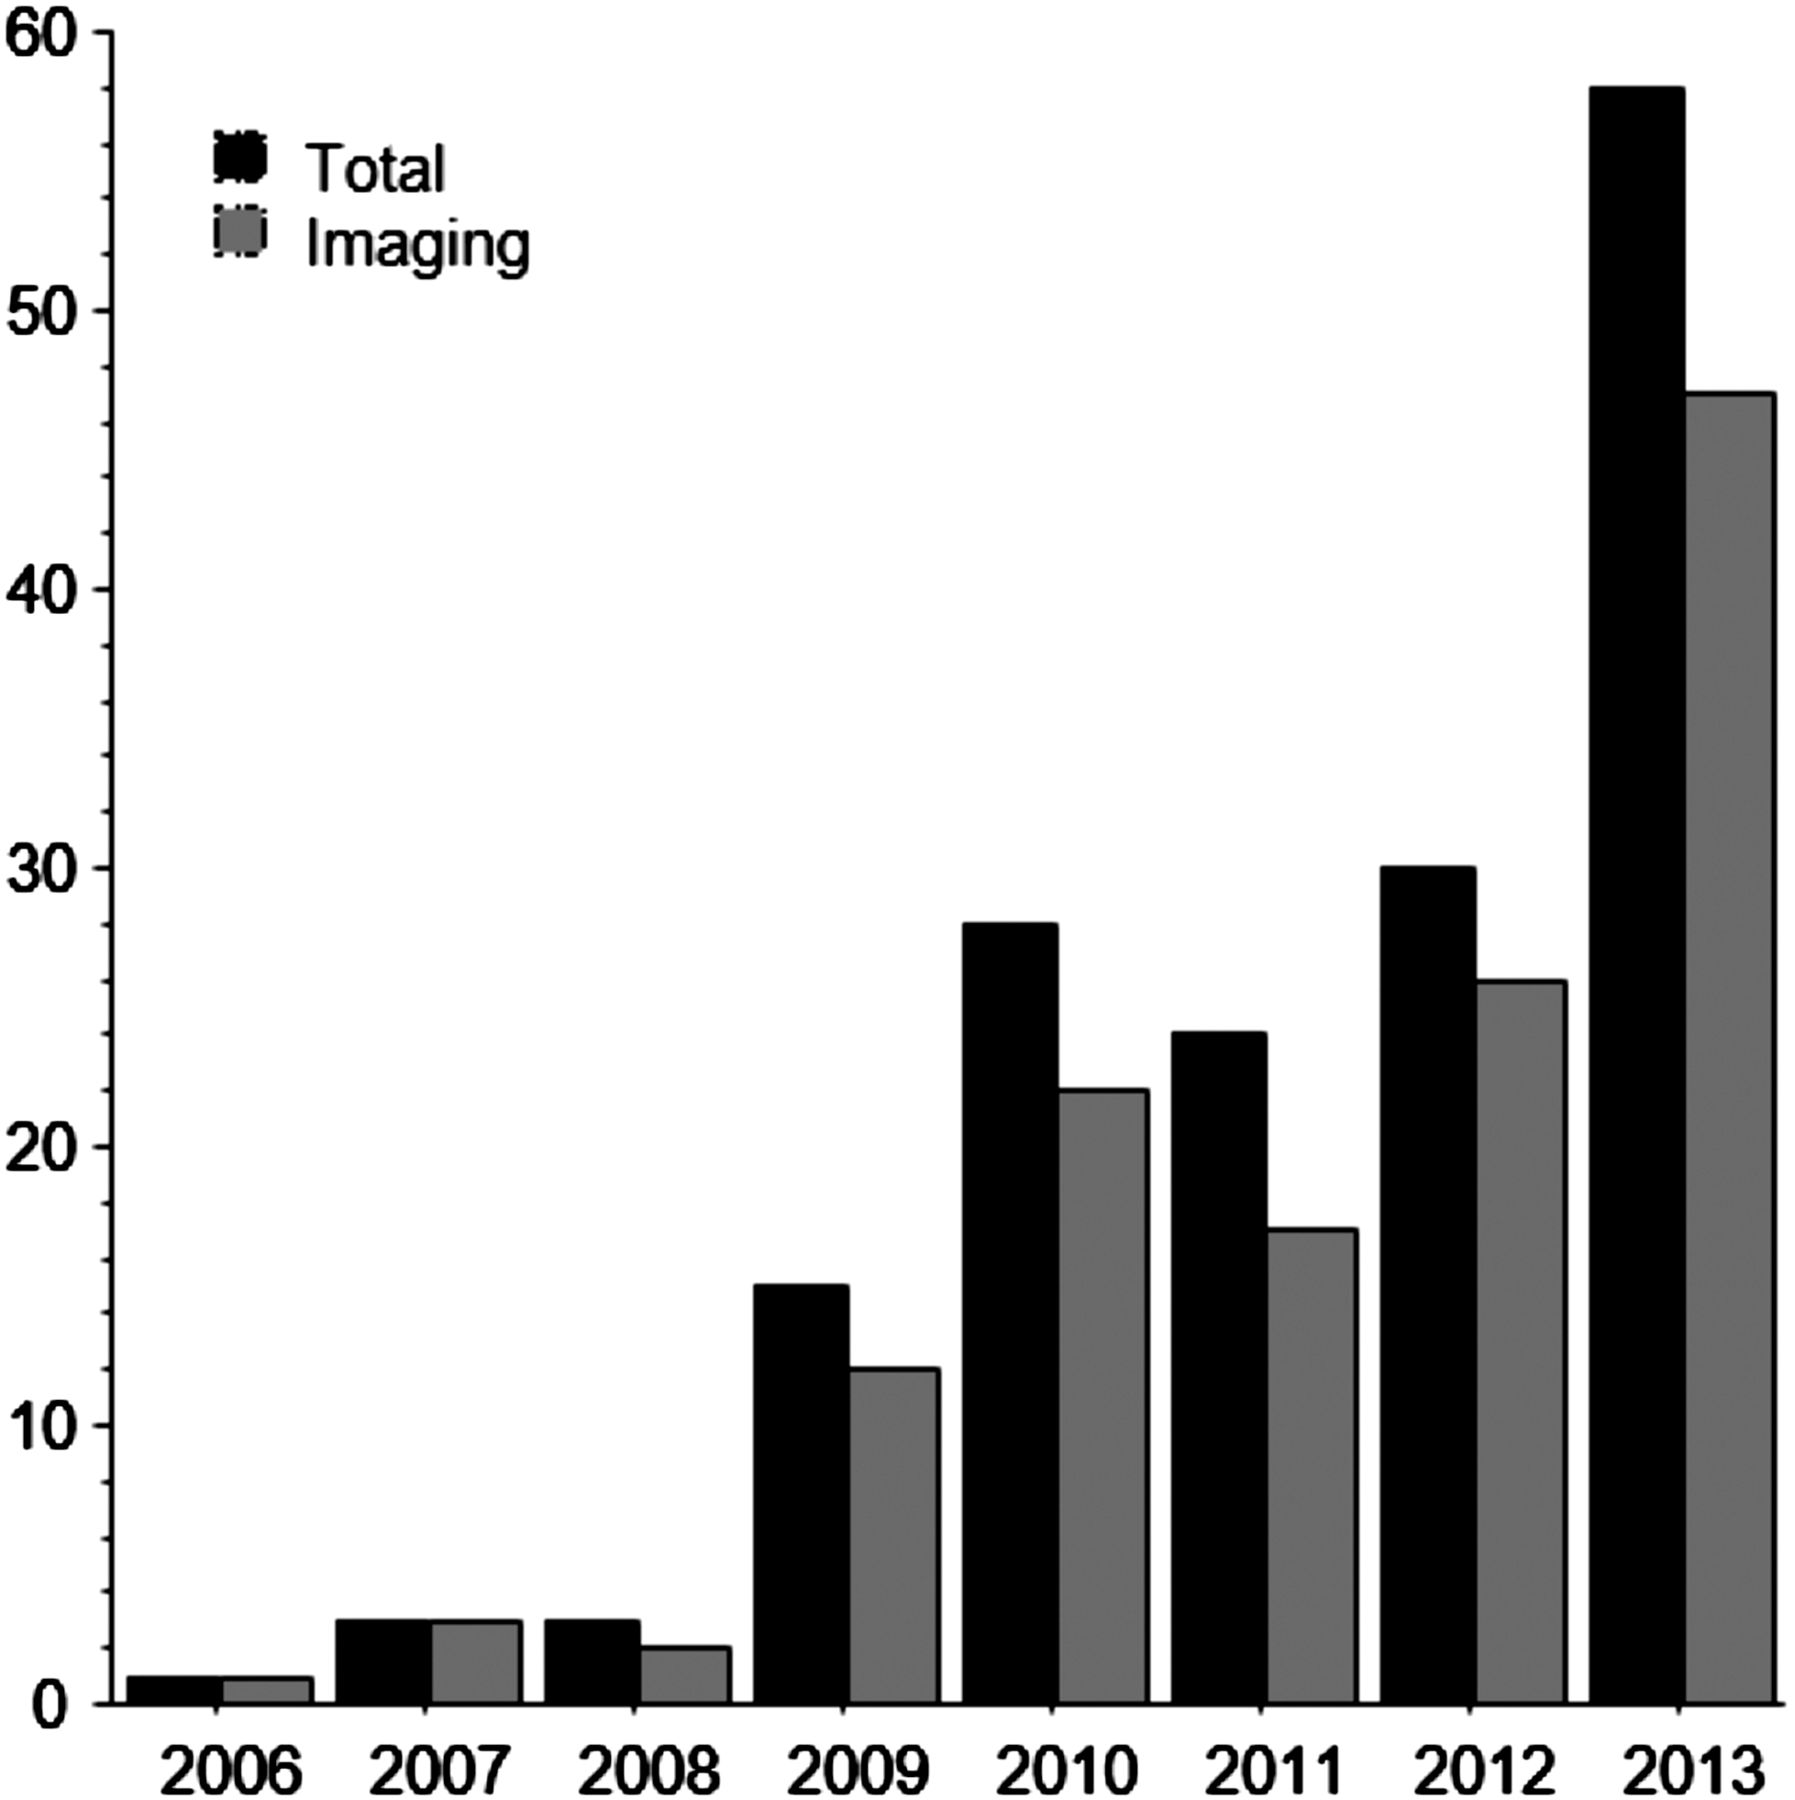
Number of papers published from OAI data between 2006 and 2013. Total number of papers (black bar), and number of imaging papers (gray bar). Numbers are according to publications listed on the OAI website, last updated in September 2013, and Pubmed research. Papers are assigned to the year in which they appeared in print (not online); 2013 also includes online publications not having appeared in print thus far.
The objective of this narrative review is to report on imaging findings and lessons learned from the OAI, 10 years after enrolment has started in 2004. A literature search for full text articles was performed in Pubmed up to 31 December 2013, using key words, such as ‘Osteoarthritis Initiative’, ‘OAI’, and others. Further, the publication list hosted on the OAI webpage was included.
OAI publication history and early releases
Initial publications by OAI investigators in 2004 highlighted the study design7 and how it would help to evaluate mechanical and metabolic pathways of obesity as a risk factor for knee OA.8 The first imaging paper from the OAI evaluated the reliability of a novel double-echo steady-state (DESS) MRI sequence for measuring cartilage volume and thickness that was acquired bilaterally in all OAI participants9 (table 2). Further, a review on cartilage morphology measurements was published, drawing on material presented at OAI planning meetings.10
Test-retest precision (reliability) of quantitative image analyses performed on OAI quality assurance and pilot data
In an OAI pilot study evaluating the OAI's 3D MR acquisition protocols, four segmentation teams compared quantitative cartilage morphometry and its sensitivity to change (over 1 and 2 years) for different MR image contrasts and orientations, with blinding to image acquisition dates.9 ,11–13 The sequences included coronal T1-weighted fast low-angle shot [FLASH], sagittal DESS (combined T1 and T2 contrast), and coronal reconstruction of the DESS, with water excitation (figure 1C–F). The precision of unpaired and paired analysis approaches was documented for different teams9 ,11–16 (table 2), and the impact evaluated of using phased-array versus quadrature coils evaluated for quantitative analysis of cartilage morphology11 and T2 relaxation time measurements17 (table 2). Analysis by the OAI coordinating centre revealed significant systematic differences in mean cartilage volume and thickness measurements between segmentation teams, and between DESS and FLASH (albeit variable in direction in different knee cartilage regions), but no differences in test-retest precision between the two sequences.13
The first public image release encompassed baseline and one-year follow-up images of 160 progression cohort participants, and is of particular interest in that it fostered analyses of many research teams on the same, precisely defined subsample: 79% of knees in this subcohort showed medial and 39% lateral meniscus lesions, and these were associated with bone marrow lesions (BML) in the same compartment18; 14% exhibited an ACL tear,19 associated with a smaller femoral notch width, and with greater rates of articular tissue pathology.20 BMLs and joint effusion scores were independently associated with knee pain.21 Two analyses of responsiveness of cartilage measures to change reported modest standardised response means (SRMs=mean/SD of change) of 1-year femorotibial cartilage volume or thickness change, with the greatest changes in the medial femur22 ,23 and in central subregions.24 Rates of cartilage loss were greater in knees with structural features of advanced disease, including denuded bone areas (dAB),25 radiographic features of advanced OA, and low baseline cartilage thickness.26 Fixed location measures of radiographic joint space width (JSW) change at 27.5% (medial to lateral; figure 1A) exhibited greater responsiveness (SRM=−0.32) than minimal JSW (−0.15), compared with −0.39 for medial femoral cartilage loss by MRI (figure 1C–E).27
Comparison of two semiquantitative (SQ) knee MRI scoring systems reported equivalence in detecting cartilage, meniscus and bone marrow lesions28; however, longitudinally, meniscus pathology assessed with one (Boston Leeds Osteoarthritis Knee Score; BLOKS) was superior while BMLs assessed with the other (Whole ORgan MRI Score; WORMS) was superior in predicting a subsequent increase in cartilage lesion scores.29 More and larger focal cartilage defects and BMLs were detected with the intermediately weighted fat-suppressed spin echo sequences (figure 2F) than with DESS (figure 2E).30 ,31
Imaging publications from full cohort releases
Annual public releases of OAI images from the entire cohort began in 2008 and publications have substantially increased since 2009 (figure 3). We present these below, sorted by imaging technique and measure.
Radiography
Radiographic severity scores assigned by OAI site investigators differed from those by a central expert reader,32 and between experienced and inexperienced clinicians.33 As in other studies, analyses of serial fixed flexion radiographs of healthy and OA knees in the OAI34 demonstrated limited replication of medial tibial plateau alignment, impacting accurate measurement of JSW change. A tibial intermargin distance (IMD) variation between serial radiographs of ≤1.0 mm was found to provide the best responsiveness to change in JSW.35 Goniometer measurements of knee alignment varied substantially from those of whole limb radiographs, and were found to be of limited validity.36 JSW showed a strong correlation of r≥0.80 with cartilage thickness on MRI.37 In an ancillary study, dual-energy X-ray absorptiometry (DXA) scans of the knee were acquired, and tibial bone mineral density (BMD), was found to be positively associated with severity of radiographic joint space narrowing (JSN).38 Among genetic loci known to be associated with variance in BMD, four also were associated with presence of definite radiographic OA (ie, Kellgren Lawrence grade [KLG]≥2).39
Cross-sectionally, JSN and KOOS symptom scores were weakly correlated.37 Longitudinally, radiographic change was significantly correlated with worsening pain and function scores.40 While bisphosphonates appeared to be associated with mild improvement in pain (but not function),41 statin use was not, and did not affect structure.42 While frequent soft drink consumption was associated with greater JSW loss43 and valgus malalignment with greater risk of radiographic incidence and progression,44 4-year radiographic change did not significantly differ between active and less active participants (ie, highest vs lowest quartile on physical activity questionnaires).45 Individuals who recently developed knee OA had a greater risk for subsequent radiographic progression than those with prevalent disease.46 About 17% of those undergoing knee replacement (KR) were KLG≤2 at the visit prior to surgery, but this finding was not based on OAI centralised expert readings.47 JSN in hand X-rays was found associated with reduced medial femorotibial cartilage thickness, and hand osteophytes with knee osteophytes.48 These findings suggest systemic susceptibility, and possibly different mechanisms for cartilage thinning and osteophyte formation.
MRI
Quantitative cartilage morphology
Using OAI images, several semiautomated segmentation algorithms for cartilage have been developed and tested,14 ,16 ,49–53 as well as approaches to measure regional or localised cartilage thickness using atlas-based or other approaches24 ,54–58 (Table 3). Statistical methodology that converts specific subregional measures of cartilage loss into generic measure that are independent of spatial location (table 3) was found more efficient in differentiating rates of cartilage loss between radiographic and clinical OA strata.57 ,58 One-year sensitivity to change in medial femorotibial cartilage thickness was similar between sagittal DESS, coronal DESS, and coronal FLASH (figure 1C–E), and for analysis of every other DESS image.59
Publications from the OAI presenting new quantitative measurement approaches of different articular tissues
Subregional cartilage thickness was similar between OAI healthy reference knees and knees from a non-OA population-based cohort.60 In comparison, OA knees had 10% greater subchondral bone areas,61 and the potentially earliest signs of cartilage thinning in the posterior tibiae, and of cartilage thickening in the external medial femur.61 The latter was confirmed using a between-knee within-person analysis, comparing bilateral knees without JSN, but with and without osteophytes.62 Longitudinally, change in cartilage thickness was more variable in the osteophyte knees.63 Applying a similar cross-sectional comparison between knees with and without medial radiographic JSN in the same person, grade 1 JSN was estimated to involve a 5%, grade 2 an 18%, and grade 3 a 44% reduction in femorotibial cartilage thickness.64 In the knees with medial JSN, greater rates of cartilage loss (and SRMs) in medial femorotibial cartilage were observed at 1-year follow-up than in the contralateral non-JSN knees in the above sample.65 Further, greater loss was reported in the weight-bearing than in the posterior femur.65 JSW loss, by contrast, did not differ between knees with and without JSN in the same person.66 Larger rates of (subregional) longitudinal cartilage loss with coronal FLASH67 ,68 and sagittal DESS3 were associated with greater baseline radiographic OA scores in large cohorts. Medial and lateral JSN were both strong predictors of cartilage loss in the narrowed, but not in the non-narrowed joint compartment.69 Further, frequently painful knees displayed greater cartilage loss than those without pain, also after adjusting for radiographic stage,68 ,70 but no correlation was detected for other pain scores.37 Comparing cartilage change over 1–4-year periods,71 ,72 the mean loss (but not the SRM) scaled linearly with observation length and was constant throughout the study, but only weak to moderate agreement was observed between individual short-term versus long-term change.72 In an attempt to correlate imaging results with hard clinical outcomes, low baseline cartilage thickness was found to be associated with greater risk of receiving KR, and greater longitudinal cartilage loss (eg, in central medial tibia) was predictive of subsequent KR.73 Cartilage morphometry also was suggested to help in the decision making of bicompartmental or unicompartmental KR.74 Based on observational data, a combination of glucosamine and chondroitin sulphate was suggested to decrease cartilage loss in specific subregions of JSN knees.75
Cartilage T2 and lesions
The spin-spin MRI relaxation time T2 can be computed from multiple echo spin echo (MESE) sequences; figure 2A-–D)4; it represents an established measure of cartilage composition, potentially associated with hydration and collagen integrity. A novel cartilage segmentation technique was proposed for simplifying T2 measurements from the MESE sequence.53 Additionally, segmentation software was developed and validated to register DESS to T2 mapping sequences.76
Further, methods were developed for laminar and texture analysis of T277–79 (table 3), and such novel texture measures and T2-derived 2D finite element analyses demonstrated promise in better understanding the evolution and early detection of cartilage degeneration.80–82 Recently, attempts were made to characterise subject-specific collagen architecture from T2 maps.81
Several studies investigated presence and evolution of focal cartilage abnormalities and T283–85 (figure 3D–F). Asymptomatic subjects had a high frequency of OA-related structural abnormalities; a significant increase in cartilage T2 was detected over 2 years, and a greater longitudinal increase in T2 was associated with increased progression of cartilage abnormalities.84 Elevated cartilage T2 values and cartilage lesions were associated with knee pain in early OA86; however, presence of focal lesions in the right and left knees were positively associated, independent of knee pain status.87
Greater physical activity levels were associated with greater T2 and cartilage abnormalities.83 ,88–90 A U-shaped association between physical activity levels and cartilage lesions was suggested: intermediate activity levels were associated with the lowest T2 (ie, the healthiest cartilage), suggesting a protective impact of moderate activity.89 ,91 T2 also differed between subjects with OA risk factors and those without; T2 was associated with Body Mass Index (BMI)92 ,93 and greater BMI also was associated with greater incidence and progression of cartilage lesions.94 Further studies found trochlear dysplasia95 and ACL abnormalities associated with cartilage degenerative change.91 While T2 was found to have potential for monitoring early disease, it may be less useful in monitoring disease progression once cartilage defects have occurred.96
Bone
Methodological advances in MRI-based analysis of bone tissue have included (semi-) automated segmentation of the bone–cartilage interface,97 bone area and shape,98–100 trabecular structure,38 ,101 and BMLs101–105(table 3). Denuded areas of subchondral bone were reported to be more common (and larger) with increasing disease severity,106 and were associated with concurrent pain,37 ,107 particularly during weight-bearing activities and when central aspects of the joint were involved.107 They also were associated with risk of subsequent KR.73 Further, vascular channels were suspected to be involved in the mechanism by which damage occurs to subchondral bone108
Knees with certain differences in 3-D bone shape were more likely to develop incident ROA 12 months later, and the association was strongest among those with KLG0 prior to incidence.100 OA knees had greater longitudinal increases of bone area than those without OA, and bone area displayed greater sensitivity to change than cartilage thickness or radiographic JSW.99
Periarticular bone mineral density (paBMD) was associated with the presence of JSN, and larger BML volume was associated with greater knee pain at baseline.109 Longitudinal increase in BML volume also was associated with JSN worsening, paBMD and subchondral sclerosis102; decrease in BML volume was associated with decreased knee pain, but not with less JSN progression or improvement in other periarticular bone measures.109
Meniscus
Semiautomated segmentation of the lateral meniscus from MESE images (figure 2A–C) reasonably agreed with manual segmentation.110 Intraobserver111 ,112 and interobserver reliability113 were satisfactory for manual segmentation using coronal DESS (figure 1E), with reasonable agreement to conventional clinical sequences113 (table 3).
Medial meniscus extrusion and complex tears were more common in knees with incident radiographic OA at 2-year follow-up than in non-incident controls.114 The meniscus covered 50% of the tibia medially and 58% laterally111 in healthy knees, with no differences between men and women.115 Medial tibial coverage by the meniscus was only 36% in JSN1 and 31% in JSN2/3 knees, and 45% in contralateral knees without JSN.116 Whereas greater medial extrusion was noted with JSN, no significant difference in lateral tibial coverage or medial or lateral meniscus volume was noted between JSN versus no-JSN knees.116 Extrusion showed moderate agreement between quantitative measurement and semiquantitative grading, and meniscus width and extrusion contributed equally to variation in tibial coverage.117 Greater quantitative extrusion and ‘bulging’ was found in OA versus matched healthy references knees.118 A between-knee, within-person comparison revealed less tibial coverage and greater extrusion in knees with frequent pain compared to contralateral painless knees with the same radiographic grade,112 suggesting that meniscus extrusion may potentially cause pain by mechanical irritation of the capsule.
Muscle and adipose tissue
Semiautomated segmentation algorithms for thigh muscles119–121 and interstitial fat121 ,122 have been proposed (figure 2G-–I), and muscle cross-sectional areas (CSA) were confirmed to correlate with isometric strength123 ,124 (table 3).
In incidence cohort participants, a greater ratio of vastus lateralis versus medialis CSAs was associated with lower knee cartilage T2 and lower presence and severity of synovial tissue changes.120 A reduction in quadriceps (but not hamstring or adductor) CSAs and isometric strength was observed in frequently painful versus contralateral painless knees with the same radiographic stage,123 but no side-difference between knees with and without JSN.124 Two-year rates of change in quadriceps CSAs were similar in participants with and without radiographic OA,121 and in knees with and without radiographic JSN.124 However, OA knees with longitudinal JSW and cartilage loss above a defined threshold (structural progressors) displayed greater concurrent quadriceps CSA loss (−2.8±7.9%) than matched, non-progressive controls (−1.8±6.8%); further change in CSAs was less variable than that in muscle strength.125 One study126 reported significant differences of thigh intermuscular fat volume between women with and without ROA, not paralleled by differences in muscle; thigh intermuscular fat explained as much of the variability in physical knee function as radiographic status.126
Direct comparison of MRI and radiography
Extending earlier findings,27 greater sensitivity to change of cartilage loss (from coronal FLASH or sagittal DESS MRI) was reported in a large sample of OA knees compared with minimum or fixed location JSW loss (figure 1A) over 12 months and 24 months.127 MRI also provided better discrimination of rates of cartilage loss in different radiographic strata (ie, KLG 2 vs 3, JSN vs no-JSN)65 ,66 ,128 and was more sensitive in detecting (regional) cartilage thickening in early radiographic OA62 than fixed location or minimum radiographic JSW. Cross-sectional comparison of contralateral knees with and without JSN revealed side differences in central medial femoral cartilage thickness (r2≈50%) and tibial coverage by the meniscus (r2≈25%) to provide independent information, explaining up to 66% of the variability of minimum and fixed location JSW.129 Excluding knees with non-optimal alignment (IMD>1 mm) improved the correlation with femoral cartilage to 65% (r2), but not with meniscus measures,129 confirming that JSW provides a better representation of cartilage thickness when optimal positioning is achieved.129
Conclusions
Ten years after enrolling the first participants and first papers being published, the OAI has become an invaluable resource to the OA imaging research community. It has fuelled novel methodological approaches, and has provided a great wealth of information on disease mechanisms and pathophysiology. Imaging biomarker qualification is ongoing through evaluation of the ability of biomarkers to predict clinical and structural incidence and progression of knee OA. This effort will soon be paralleled by extensive analysis of genetic and molecular markers from biospecimens.1 An extension of follow-up contacts and clinic visits to months follow-up (96M) is nearly completed,1 and 72M images and 84M clinical data have been made public in 2013. The richness of the long-term data on OA outcomes up to 96 months (and hopefully beyond that) will provide even greater insights into OA pathophysiology and additional support for imaging measures to gain scientific and regulatory acceptance as ‘prognostic’ or ‘efficacy of intervention’ markers. As potential ‘surrogates’ of clinical outcomes, they will enable shorter and more efficient trials of DMOAD interventions in the future.
Acknowledgments
We would like to thank Prof Marc Hochberg and Prof Michael Nevitt for critically reviewing this manuscript as external OAI reviewers; this manuscript received the approval of the OAI Publications Committee based on a review of its scientific content and data interpretation. Further, the authors would like to express their thanks to the Osteoarthritis Initiative (OAI) participants, investigators, technicians, funders, the OAI Clinical Centers (University of Maryland, Ohio State University, University of Pittsburgh, Memorial Hospital of Rhode Island/Brown University) and the OAI Coordinating Center (University of California, San Francisco) for making the OAI image acquisitions possible, and publicly available. Finally, we would like to thank our coworkers, collaborators and all authors who have generated publications cited in this review for their important contributions to the field of imaging science.
References
Footnotes
-
Handling editor Tore K Kvien
-
Correction notice This article has been corrected since it was published Online First. Two typographical errors in the title have been corrected.
-
Contributors All authors have contributed to writing this review and have approved the final version.
-
Funding The study and data acquisition was funded by the OAI, a public-private partnership comprised of five contracts (N01-AR-2-2258; N01-AR-2-2259; N01-AR-2-2260; N01-AR-2-2261; N01-AR-2-2262) funded by the National Institutes of Health, a branch of the Department of Health and Human Services, and conducted by the OAI Study Investigators. Private funding partners of the OAI include Merck Research Laboratories; Novartis Pharmaceuticals Corporation, GlaxoSmithKline; and Pfizer, Inc. Private sector funding for the OAI is managed by the Foundation for the National Institutes of Health. The sponsors were not involved in the design and conduct of this particular study, in the analysis and interpretation of the data, and in the preparation, review, or approval of the manuscript.
-
Competing interests F Eckstein declares associations with the following companies: Abbvie, Chondrometrics GmbH, Eli Lilly, GlaxoSmithKline, Kolon, Medtronic, MerckSerono, Novartis, Pfizer, Sanofi Aventis, Stryker, Synarc, Synthes, Wyeth. C K Kwoh declares associations with the following companies: Pfizer, Novartis. TM Link declares associations with the following companies: General Electric.
-
Ethics approval The OAI study and public use of clinical and imaging data was approved by the local ethic committees at the four clinical OAI centres.