Article Text

Abstract
Background Although pain due to osteoarthritis (OA) generally deteriorates over time, there is a large individual variation in the course of pain. This study examines the different longitudinal trajectories of patients with hip pain due to OA.
Methods Data from a previously performed randomised controlled trial were used to investigate the course of pain over 2 years in 222 patients with clinically and radiographically determined hip OA. Pain was measured with a visual analogue scale (0–100). Latent class growth analysis was used to determine the number of trajectories of patients with hip pain due to OA.
Results Analyses yielded five trajectories of pain due to hip OA. Trajectory 1 (‘mild pain’; n=69) consists of patients with stable mild pain. Patients in trajectory 2 (‘moderate pain’; n=31) fluctuated slightly between moderate and severe pain levels. Trajectory 3 (‘always pain’; n=32) consists of patients with severe pain. Patients in trajectory 4 (‘regularly progressing’; n=48) started with mild pain and progressed slowly to moderate pain. Trajectory 5 (‘highly progressing’; n=42) patients also started with mild pain but quickly progressed to severe pain over 2 years. Compared with the ‘mild pain’ group, patients in the ‘always pain’ group had more severe radiographic hip OA, morning stiffness and decreased range of motion. The ‘highly progressing’ group had more severe radiographic hip OA and morning stiffness.
Conclusions Latent class growth analysis applied to longitudinal data of patients with hip OA identified five distinct trajectories of pain. More studies are needed to externally validate these findings.
Statistics from Altmetric.com
Introduction
Osteoarthritis (OA) is the most frequent chronic joint disease of the older population.1 ,2 Complaints of OA include pain and disability. Although functional status and pain seem to deteriorate over time,3 ,4 limited data on the course of pain in OA are available.
Studies on patients with OA have shown a marked heterogeneity of pain scores. One study found that, after 2 years, pain and function had not changed at group level but varied greatly between individuals.5 Another study, with a 3-month follow-up, found weekly fluctuations in levels of pain and other health outcomes among adults with OA.6
Describing a heterogeneous population using a single growth trajectory estimate is probably not optimal to investigate the course of pain due to OA.7 In a study aiming to identify longitudinal patterns of change in knee and hip OA, the authors, using cluster analysis, classified patients into four subgroups based on their individual response pattern over a 4-year period.8 With this approach, individuals within a group are more similar than individuals between groups.7
More data on subgroups of patients with similar response patterns are needed for all clinical health professionals to be able to optimise treatment for patients with OA. Therefore, the present study aimed to identify distinct groups of patients with different trajectories of pain due to hip OA and to describe patient characteristics for each trajectory of pain.
Methods
Study design
The present study used the data of a published randomised controlled trial (RCT).9 ,10 That trial assessed whether glucosamine sulphate compared to placebo had an effect on the symptoms and structural progression of hip OA during a 2-year follow-up. The study showed that glucosamine sulphate was not more effective than placebo in reducing the symptoms and progression of hip OA.9 Therefore, we used the data of that original study for the present cohort study.
Study population
During the original RCT, general practitioners (GPs) in the Rotterdam area recruited patients with hip OA who met the American College of Rheumatology criteria. Patients were randomly allocated to either 1500 mg of glucosamine sulphate or 1500 mg of placebo administered orally for 2 years. Patients were excluded if they (1) had undergone or were awaiting hip replacement surgery; (2) had a Kellgren–Lawrence score of 4; (3) had a renal disease; (4) had a liver disease; (5) had diabetes mellitus; (6) had a disabling comorbid condition that would make visits to the research centre impossible; (7) had already received glucosamine; and (8) were unable to fill out questionnaires in the Dutch language.
Between June 2003 and February 2004, 417 patients were recruited by their GPs, of which 250 provided informed consent after receiving detailed information. Of these, 16 did not meet the inclusion criteria, and another 12 withdrew their consent before random assignment. Finally, 222 patients were randomised to the study.
Of these 222 randomly assigned patients, 189 (85%) completed the visual analogue scale (VAS) assessment at 2-year follow-up; 20 (9%) patients underwent total hip arthroplasty during the study period.
Data collection
During the original RCT, participants filled out nine questionnaires every 3 months over a 2-year period. Pain severity was measured on a VAS (0–100). A score of ≤30 represents mild pain, >30 represents moderate pain and ≥54 indicates severe pain.11 Pain was also measured with the Western Ontario McMaster Osteoarthritis Index (WOMAC).12
Data on patient characteristics (age, gender and body mass index (BMI)), comorbidity, medication adherence and activity level were also collected. Details of the protocol and results of the RCT have been published elsewhere.9 ,10
Statistical analyses
Individual patient data of the RCT revealed a heterogeneous population (figure 1). To identify possible trajectories of hip pain due to OA over time, we used latent class growth analysis (LCGA). This technique allows us to uncover heterogeneity in a population and to find substantively clinically meaningful groups of people who are similar in their responses to measured variables or growth trajectories.13 The fit of the pain trajectories was tested for two to seven trajectory classes. We also tested whether the course of pain was best described by linear, quadratic or cubic trajectories. The most optimal model was determined on a combination of indices of fit and interpretability of the model. The following indices of fit were used: (1) Bayesian information criteria (BIC). The BIC marks the balance between the impact of adding a new class on the log likelihood value and the penalty for increasing the number of model parameters that results from the addition of that class extracted from BIC by the second part of the equation. The smaller is the BIC value, the better is the model fit. (2) Vuong–Lo–Mendell–Rubin likelihood ratio test (LRT) and bootstrap likelihood ratio test (BLRT). Significant LRT and BLRT for k groups (p<0.05) indicate that the fit of the specific model is an improvement over a model with k−1 groups. (4) Entropy indices (range 0–1) were checked to ensure the quality and reliability of the classification. An index close to 1 indicates a good classification.7 ,14 ,15
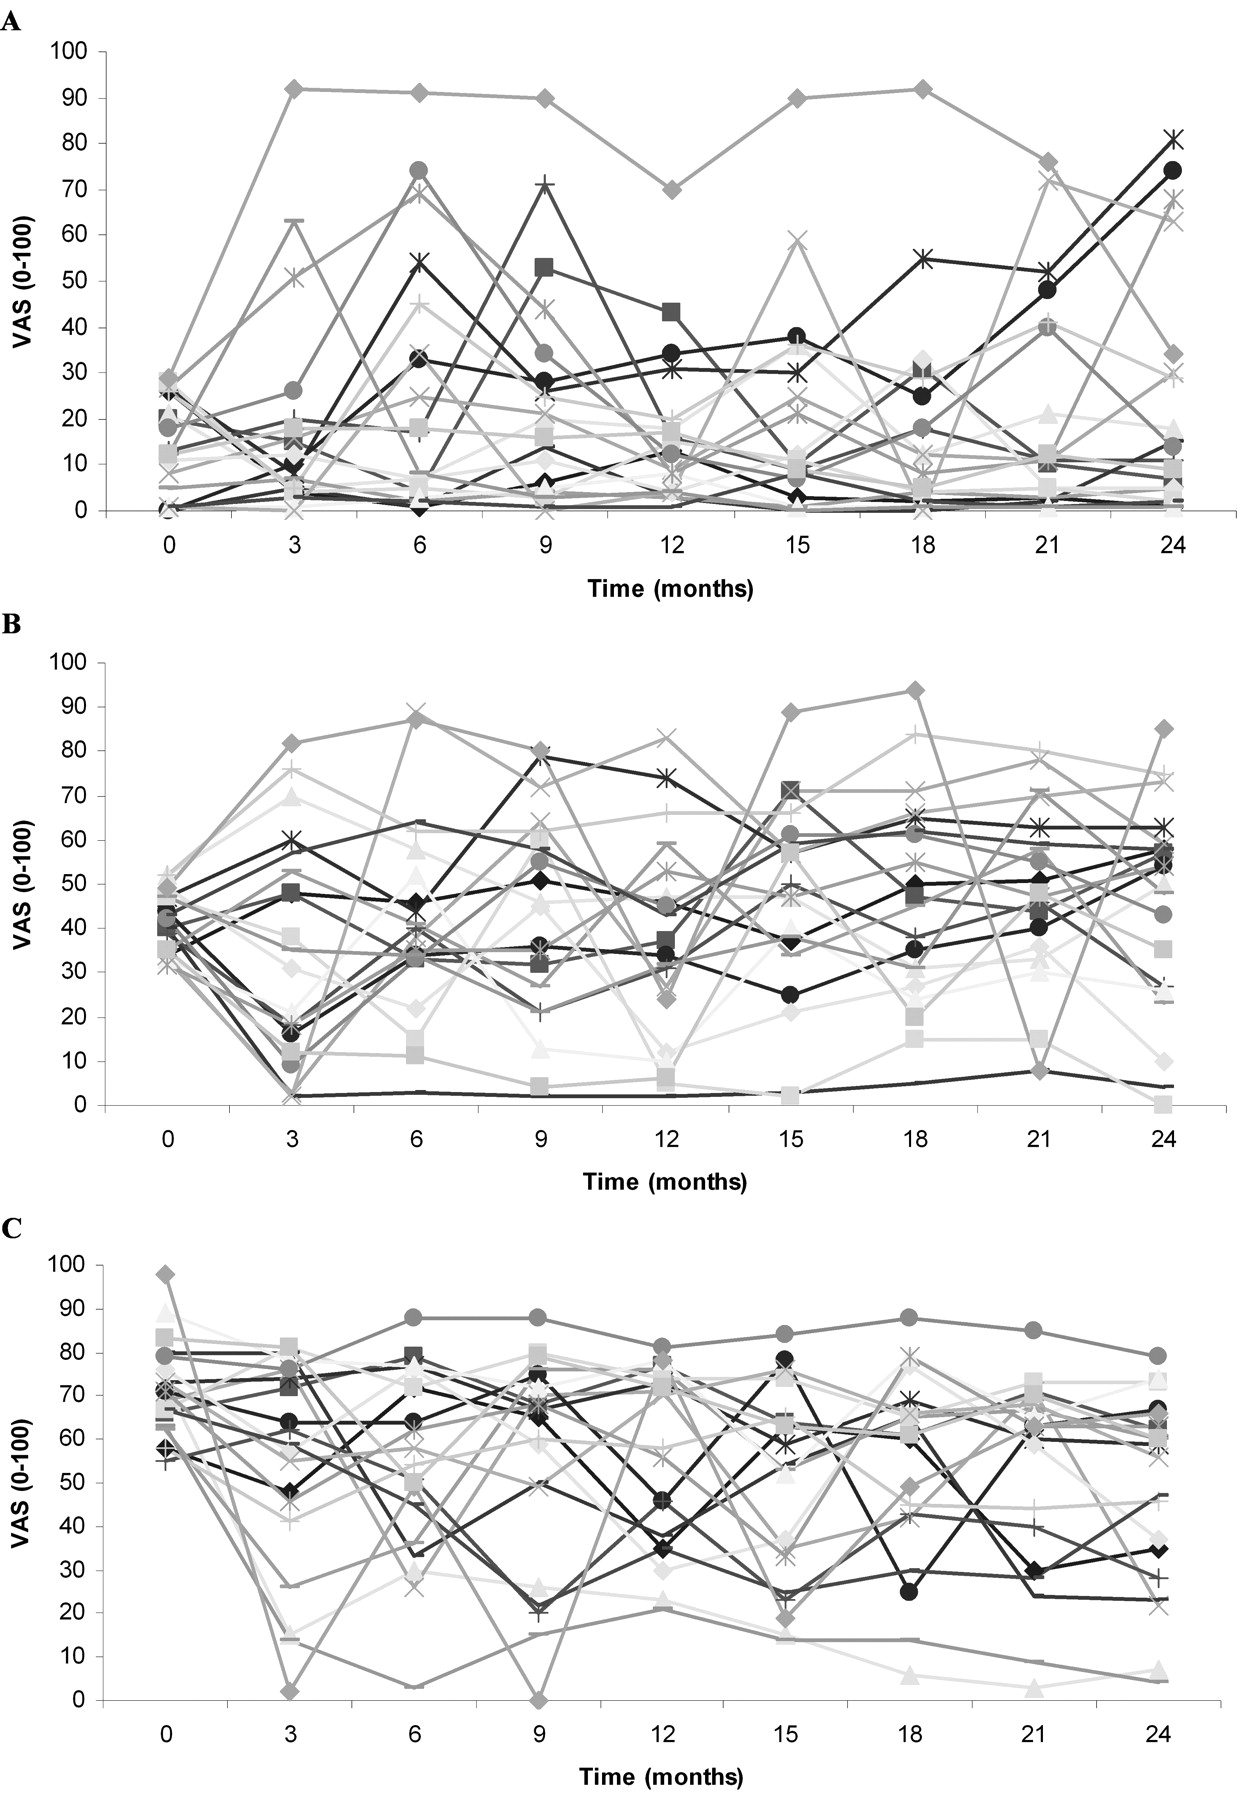
Course of pain in 20 patients with hip osteoarthritis. (A) Mild hip pain (VAS≤30) at baseline. (B) Moderate hip pain (VAS>30≤54) at baseline. (C) Severe pain (VAS<54) at baseline. VAS, visual analogue scale.
After determining the number of trajectories by the indices of fit, we also determined the best possible model by the usefulness of the latent classes in practice. This was examined by the trajectory shapes for similarity, the number of individuals in each class, the number of estimated parameters and the differences in the predictions of consequences based on different numbers of classes.7 ,14,–,16 Subsequently, characteristics of class membership were tabulated.
Finally, multinomial regression analyses were used to predict the effect of patient characteristics and the probability of membership in one of the trajectories. As our study population is relatively small, we did not adjust our analyses for other variables.
Mplus V. 6.117 was used for LCGA. Description of the characteristics of class membership and multinomial regression analyses were performed using SPSS software V. 17 (SPSS, Chicago, Illinois, USA).
Results
Patient characteristics of five trajectories for VAS scores
Based on BIC, LRT, BLRT, entropy and the usefulness of the classes in practice, we choose the quadratic five-group model as the most optimal solution. Most patients (n=69; 31.1%) were classified into trajectory 1 and characterised as having ‘mild pain’ as they had stable low levels of pain (VAS 7.3–16.3) (table 1). Patients in trajectory 2 (n=31; 14%) oscillated between moderate and severe pain levels (VAS 42.3–58.4) during follow-up and were classified as having ‘moderate pain’. Trajectory 3 consisted of 32 patients (14.4%) with permanent and severe levels of pain (‘always pain’; VAS 65.9–76.3). The fourth trajectory consisted of 48 patients (21.6%) who were classified as having ‘regularly progressing’ pain. These patients had mild pain at baseline (mean VAS 22.2) and progressed slowly to moderate levels of pain (mean VAS 37.4). The final trajectory of the ‘highly progressing’ group (n=42; 18.9%) comprised patients with mild pain at baseline (mean VAS 25.7) who quickly progressed to severe levels of pain during follow-up (mean VAS 59.4). Figure 2 shows the five pain pathways as measured by VAS during the 2-year follow-up.

Trajectories of pain measured by the visual analogue scale.
Characteristics for each trajectory of pain measured by VAS
Multinomial regression analysis showed that compared with patients in the ‘mild pain’ group, patients in the ‘always pain’ group were more likely to be less educated, have a higher BMI, have a higher Kellgren–Lawrence score of the hip, have a longer duration of complaints, have morning stiffness of the hip, have generalised complaints, have decreased internal rotation and flexion of the hip, and have concurrent back and trochanteric pain. The ‘highly progressing’ group was more likely to have a higher BMI, a higher Kellgren–Lawrence score of the hip, a longer duration of complaints, morning stiffness of the hip and concurrent back pain. Patients within the ‘moderate pain’ group were more likely to be less educated, to have morning stiffness of the hip, to have decreased flexion and to have concurrent back and trochanteric pain. Patients within the ‘regularly progressing’ group more often have morning stiffness of the hip, generalised complaints and concurrent knee pain (table 2).
Multinomial regression analysis for univariate predictors at baseline for each trajectory of pain (mild pain group used as the reference group)
Discussion
The present study classified 222 patients with hip OA into five distinct trajectories of pain using LCGA. Most patients are classified into a trajectory consisting of ‘mild pain’. Compared with the ‘mild pain’ group, patients in the ‘always pain’ group were more likely to be less educated, have a higher BMI, have a higher Kellgren–Lawrence score of the hip, have a longer duration of complaints, have morning stiffness of the hip, have generalised complaints, have a decreased range of motion of the hip, and have concurrent back and trochanteric pain. The ‘highly progressing’ group was more likely to have a higher BMI, a higher Kellgren–Lawrence score of the hip, a longer duration of complaints, morning stiffness of the hip and concurrent back pain.
To our knowledge, this is the first study to use LCGA to examine the course of pain in patients with OA. Studies on the course of pain are scarce, have mainly focused on pain at group level and report that pain worsens slowly over time.3 ,4 Two studies showed a large individual variability in pain.5 ,6 One study8 used cluster analyses to examine the patterns of change in an ongoing cohort of patients with OA; four different patterns of change emerged: (1) regularly increasing, (2) regularly decreasing, (3) stable over time and (4) highly unstable. Our results are partially in line with these latter findings. We found two groups of patients in whom pain increased over time (‘regularly progressing’ and ‘highly progressing’) and two groups whose pain remained stable over time (‘always pain’ and ‘mild pain’). However, no trajectory emerged for patients with a decreasing level of pain or for highly unstable patients.
We had expected a trajectory consisting of patients with highly unstable pain, as such a trajectory was observed with simple statistical analysis. However, although not found, almost all our patients fluctuated within their trajectory (figure 3). Patients with decreasing levels of pain might be absent because our study population consisted of prevalent patients who did not consult their GP at the time of study inclusion. Discrepancy between our results and those of Leffondré et al8 might be due to our small study population with relatively mild OA. Also, our study population consisted of patients with hip OA only, whereas Leffondré et al8 included patients with knee and hip OA. A systematic review of heterogeneity reported that it might be better to present the results of hip and knee OA separately, as moderate heterogeneity was found in trials that included both knee and hip OA.18

Individual fluctuations of visual analogue scale scores within each trajectory of pain. (A) Class 1: minor pain. (B) Class 2: moderate pain. (C) Class 3: always pain. (D) Class 4: regularly progressing pain. (E) Class 5: highly progressing pain.
It might be possible that patients within the ‘always pain’ group have more characteristics of the ‘neuropathic pain’ syndrome.19 ,20 Unfortunately, these pain characteristics were not measured in the study. What we do see is that patients within this group are more likely to have back complaints and trochanteric pain. Yet, compared with the mild pain group, they are not more likely to have knee complaints more often. Also, they showed a decreased range of motion, morning stiffness, a longer duration of complaints and a higher Kellgren–Lawrence score, which might suggest that the hip OA has been there for years and may have led to more sensitised pain. Future studies on pain trajectories should incorporate questionnaires that measure the components of neuropathic pain or central sensitisation.
The present study reports the results of the VAS scores only, although we also performed LCGA on WOMAC scores. Based on the indices of fit, the quadratic four-group model was selected as the optimal model. Two trajectories consisted of patients who had stable minor levels of pain. One trajectory consisted of patients who had stable moderate pain. The fourth trajectory consisted of patients with stable severe levels of pain (data not shown). The pain subscale of WOMAC seems less sensitive to change than VAS. This was not caused by the summarisation of the five pain items into one pain score, as LCGA analysis yielded the same trajectories for each individual pain item. In addition, the same trajectories were also found when WOMAC Pain was divided into weight-bearing and non-weight-bearing pain as proposed by Stratford et al.21
The strengths of this study include the use of a longitudinal design with nine measurements over a 2-year period. Also, patients are classified into one of the five trajectories according to their highest probability of membership. For all patients, the probability of belonging to their trajectory was 84% or higher, suggesting that most patients were correctly allocated. Additional analysis excluded one or more of the nine measurements and still yielded the same trajectories (data not shown).
This study also has some limitations. First, although the present study was originally designed as an RCT, we described the present study as a cohort study. We believe that this description is feasible, as the original RCT showed that glucosamine sulphate was not more effective than placebo in reducing the symptoms and progression of hip OA. The original RCT showed a small placebo effect after 3 months, but remission of pain was not significantly different between placebo use and glucosamine use after 3 months. Also, treatment allocation was not found to be a predictor for one of the trajectories. Therefore, we expect the small placebo effect to be equally presented in all five trajectories. Nevertheless, patients in an RCT might represent a selected population. Second, our study population of 222 patients is relatively small when performing LCGA. Third, although our patients had relatively mild OA, these patients visited their GP with complaints. Therefore, it is important to determine the distinct trajectories of OA pain for these ‘mild’ patients to be able to offer GPs relevant information for treating individual patients with hip OA. A fourth limitation is the fit of our model. Although LCGA is a well-established method for making distinct trajectories, the decision regarding the optimal number of classes is arbitrary.14 ,15 Adding an additional trajectory seems to improve most indices of fit. However, the six-group solution does not improve the usefulness of the latent classes in practice as it adds a small trajectory of patients.
In conclusion, using LCGA, the present study reveals five distinct trajectories of pain in hip OA. These five subgroups of patients may need different types of information/education and/or treatment. More studies are needed to externally validate these findings. Future studies should also identify trajectories of pain in patients with knee, back and hand OA.
References
Footnotes
-
Competing interests None.
-
Patient consent Obtained.
-
Ethics approval Medical ethics committee at the Erasmus Medical Center.
-
Provenance and peer review Not commissioned; externally peer reviewed.