Article Text

Abstract
Objective Knee osteoarthritis (OA) is a heterogeneous, complex joint pathology of unknown aetiology. Biomarkers have been widely used to investigate OA but currently available biomarkers lack specificity and sensitivity. Therefore, novel biomarkers are needed to better understand the pathophysiological processes of OA initiation and progression.
Methods Surface enhanced laser desorption/ionisation-time of flight-mass spectrometry proteomic technique was used to analyse protein expression levels in 284 serum samples from patients with knee OA classified according to Kellgren and Lawrence (K&L) score (0–4). OA serum samples were also compared to serum samples provided by healthy individuals (negative control subjects; NC; n=36) and rheumatoid arthritis (RA) patients (n=25). Proteins that gave similar signal in all K&L groups of OA patients were ignored, whereas proteins with increased or decreased levels of expression were selected for further studies.
Results Two proteins were found to be expressed at higher levels in sera of OA patients at all four K&L scores compared to NC and RA, and were identified as V65 vitronectin fragment and C3fpeptide. Of the two remaining proteins, one showed increased expression (unknown protein at m/z of 3762) and the other (identified as connective tissue-activating peptide III protein) was decreased in K&L scores >2 subsets compared to NC, RA and K&L scores 0 or 1 subsets.
Conclusion The authors detected four unexpected biomarkers (V65 vitronectin fragment, C3f peptide, CTAP-III and m/z 3762 protein) that could be relevant in the pathophysiological process of OA as having significant correlation with parameters reflecting local inflammation and bone remodelling, as well as decrease in cartilage turnover.
Statistics from Altmetric.com
Introduction
Osteoarthritis (OA) is one of the most common chronic joint diseases causing substantial health deficits1 and it is becoming increasingly more prevalent as a result of population ageing. Obesity is a major risk factor for developing OA and recent data suggest that there will be an epidemic of obesity-related OA in the general population.2 Current diagnosis of OA depends on patient-reported pain and disability and is confirmed by plain radiography of affected joints. The pathophysiology of OA is characterised by dysregulation of normal joint homeostasis that leads to intra-articular tissue degradation, with attempted repair and inflammation mediated by cytokines and growth factors. Serum levels of macromolecules (biomarkers) can provide a way of measuring these processes,3,–,8 whereas others are putative markers of radiographic disease outcome in knee OA or have some diagnostic value.9,–,12 However, these biomarkers (singly or in combination) often lack the specificity and sensitivity to discriminate individual patients from control subjects or to suggest possible disease progression for patients over time. Therefore, there is an urgent need to seek novel and more specific-biomarkers for investigation of OA and other joint diseases.
To that end, new proteomics studies related to discovery of biomarkers specific to OA pathology have been performed by two-dimensional electrophoresis or liquid chromatography-mass spectrometry on serum,13 14 synovial fluid15 16 or cartilage and chondrocyte secretomes,1 17,–,21 and these studies were recently reviewed.22 23 In the present study, the surface enhanced laser desorption/ionisation-time of flight-mass spectrometry (SELDI-TOF-MS) proteomics approach was used to investigate large serum sample cohorts. SELDI-TOF-MS is a powerful ProteinChip technology that differentially investigates levels of low molecular weight proteins (<20 kDa) in biological fluids.24,–,28 In this type of study, unusually high or low protein signals are the main interest and these are considered as potential biomarkers of the disease process. SELDI ProteinChip includes chromatographic chemistry for capturing proteins according to their physicochemical properties and displaying various protein profiles from the same studied biological sample, thus considerably increasing chances of identifying specific biomarkers.
In the present study, serum samples from well-characterised groups of OA patients, healthy control subjects and disease control subjects (patients with rheumatoid arthritis (RA)) were analysed using SELDI-TOF-MS to search for novel and specific biomarkers for OA.
Patients and methods
Patients
Two-hundred and eighty-four patients with knee OA recruited through community questionnaires, consultations and hospital outpatient clinics,10 11 and classified according to their Kellgren and Lawrence (K&L) score,29 were used for the study. Of the 284 OA patients, 130 were included in the serum analysis study from Bristol OA 500 cohort, which has been described fully in previous publications8 10 and been shown to be appropriate for biomarker studies. The 154 OA patients used in the Validation study are from a more recent Bristol cohort. The demographic, clinical and radiographic data of these patients have also been published9 11 12 and demonstrated to be a suitable cohort for biomarker studies. The demographic and epidemiologic data of these patients are summarised in table 1. None of the OA patients were on intra-articular steroids or any potential disease-modifying drugs, the majority were on analgesics or non-steroidal anti-inflammatory drugs (NSAIDs) that are unlikely to affect serum or synovial fluid levels of the markers investigated.
Demographic and clinical characteristics of the patients and control subjects used in the study
Twenty-five RA patients fulfilling the 1987 American College of Rheumatology criteria30 and 36 healthy individuals (referred to as negative control subjects (NC)) were included in the study as control subjects. Of the 25 RA patients, 84%, 80% and 71% presented an elevated erythrocyte sedimentation rate (>40 mm/h), rheumatoid factor (>20 IU/ml) and anti-CCP2 antibody (>5 IU/ml) score respectively. The median disease activity score using 28 joint counts (DAS28) was 7 (range 5.5–8.4), with 100% of the scores >5.1 (high disease activity).31 The mean numbers of tender and swollen joints were 15 (range 6–28) and 12 (range 6–27) respectively. Concomitant treatments included methotrexate at a mean dosage of 14.5 mg/week (range 7.5–20 mg/week) in six (24%) of 25 patients, and prednisolone at a mean dosage of 2.7 mg/day in eight (32%) of 25 patients.
NC qualified for entry into the proteomics study considering the following exclusion criteria: any prior history of knee trauma, joint pain, chronic inflammatory or autoimmune disease, corticosteroid injection or NSAID use. Nineteen paired serum/synovial fluid samples (12 OA and seven RA patients) were used for correlation between both fluids.
The study protocol was approved by the institutional review boards (Research Ethics Committee) of the United Bristol Healthcare NHS trust, Bristol, UK, and the University Hospital, CHU Liège, Belgium.
Serum samples and synovial fluids
Blood samples were allowed to coagulate in plain glass tubes. Serum was obtained by centrifugation at 2800 rpm for 10 min. Synovial fluids were processed using the same experimental conditions. Supernatants were aliquoted and immediately frozen at −80°C until required for SELDI-TOF-MS analysis.
ProteinChip array preparation and data preprocessing
The choice of ProteinChip arrays, subsets of samples and the overall strategy for the OA proteomic study is summarised in figure 1. ProteinChip array preparation and data preprocessing are described in the supplementary data and in previous studies.32 33

Strategy – 150 serum samples used for analysis were loaded on CM10 and IMAC-Ni ProteinChip arrays. Statistical analysis revealed 13 and three putative biomarkers on CM10 and IMAC-Ni respectively. Therefore, a first validation study (Validation 1) was performed using an independent set of 195 serum samples. These samples were loaded on CM10 but not on IMAC-Ni arrays as only three putative biomarkers were previously detected using this kind of array. Four biomarkers were validated at m/z values of 1979, 2021, 3762 and 9292. A second validation study (Validation 2) was performed using a subset of 39 serum samples, including the K&L0 and K&L4 grades used for Validation 1. Validation 2 was performed on CM10 and IMAC-Ni arrays in a day to minimise variability across the time. CHCA instead of SPA matrix was used for IMAC arrays to better visualise small peptides below 2000 Da such as truncated variants of C3f (m/z=2021). Finally, paired serum and synovial fluid samples from 12 osteoarthritis (K&L1 to 4) and seven rheumatoid arthritis patients were loaded on CM10 and IMAC-Ni arrays, and analysed to check for the new biomarkers' presence in both fluids.
Protein purification for biomarkers identification
The proteomic study detected four proteins at different m/z ratios as putative biomarkers and a range of biochemical methods were used to characterise and identify these markers as described in the supplementary data.
Correlation with currently available biomarker assays
In order to further characterise the four putative biomarkers, biomarker peak intensities were correlated at 1979, 2021, 3762 and 9292 m/z values with 20 different biochemical markers associated with cartilage, bone and synovial tissue metabolism (supplementary table 1). These markers had been previously measured by ELISA-based assays9 in 93 of the 154 OA serum samples used in the Validation 1 set, and were equally distributed among the K&L scores.
Statistical analyses
SELDI proteomics data were analysed by two statistical approaches: a non-parametric Mann–Whitney U test and a machine-learning algorithm called Extra-Trees N. The latter approach is a decision-tree multivariate analysis used to build classification models and to rank peaks according to their relative contribution, quantified by a percentage of importance (Imp(%)), in the classification of two groups.34 In this model, m/z peak values were ranked in relation to their Imp(%) for differentiating K&L0 from K&L4 groups. First values represent potential biomarkers involved in the development of OA. p Values are associated to this ranking and are considered significant if ≤0.05. For determining the association with currently available biomarkers, ranked data were used to calculate Spearman correlation coefficients. p Values <0.05 were considered statistically significant.
Results
Serum analysis study
From the 130 OA and 20 NC serum samples (Analysis set, table 1 and figure 1), 300 spectra were obtained on cation exchange (CM10) and nickel affinity (IMAC-Ni)ProteinChip arrays. Biomarker Wizard software resolved 156 and 134 peaks on CM10 and IMAC-Ni respectively. Ranking of biomarkers in the top 13 is summarised in the Analysis section of table 2, and is made according to the Imp(%) given by the multivariate analysis. A p value for each biomarker was also calculated.
The m/z values, high percentage of importance (Imp(%)) and corresponding p values of the proteins with concentrations that differed significantly between K&L0 and K&L4 groups
Serum validation studies
A new proteomic study (Validation 1) was designed with an independent set of samples (see table 1 and figure 1) to confirm the robustness of biomarkers detected after analysis study. The same statistical approaches were used for peak ranking as employed for the Analysis set (table 2, Validation 1 section).
Comparison of the Analysis and Validation studies allowed detection of four potential novel biomarkers at 1979, 2021, 3762 and 9292 m/z values (figure 2). Peak intensity distributions in the NC, OA (K&L0 to 4) and RA groups are shown in figure 2A–D.
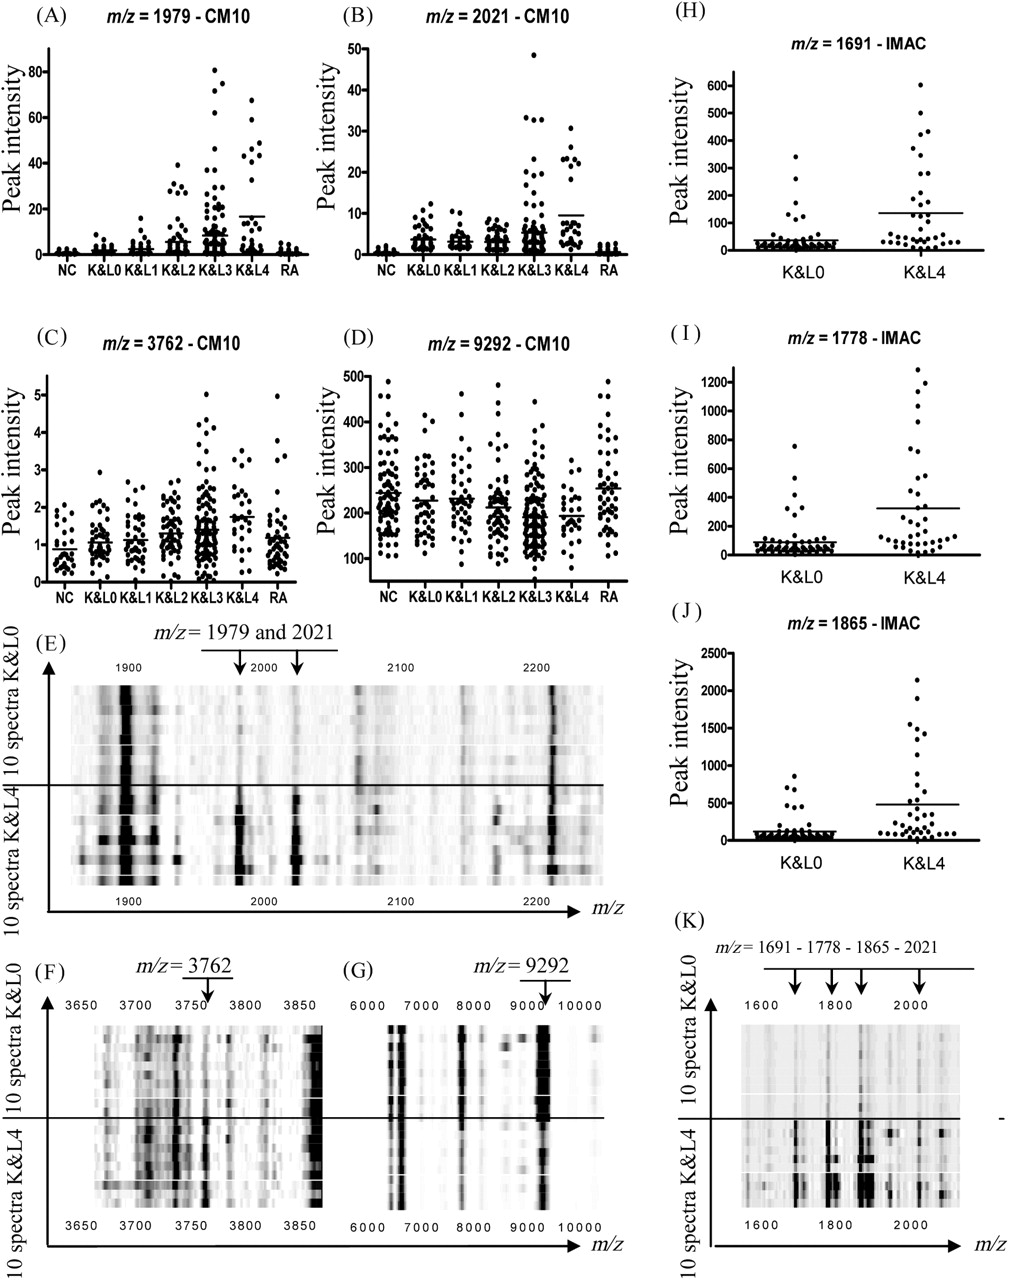
(A–D) Peak intensity distribution of serum biomarkers detected after Validation 1 study on CM10 (m/z=1979, 2021, 3762 and 9292) through the seven groups of patients (negative control subjects, K&L0 1, 2, 3, 4 and rheumatoid arthritis). (E–G) Gel view spectra provided by 20 patients with osteoarthritis (OA) (10 with K&L0 and 10 with K&L4) representing 1979 and 2021, 3762 and 9292 m/z markers respectively. (H–J) Variants (m/z=1691, 1778 and 1865) from m/z 2021 on IMAC-Ni through K&L0 and K&L4 groups after Validation 2 on serum. (K) Gel view spectra provided by 20 patients with OA (10 with K&L0 and 10 with K&L4) representing 1691, 1778, 1865 and 2021 m/z markers after Validation 2 on serum.
Peak intensities at 1979 and 2021 m/z values were found to be significantly (p<0.001, table 3) increased in all OA samples compared to NC and RA samples, and further increased with increasing K&L scores (figure 2A,B).
p Values illustrating peak intensities differences at m/z values 1979, 2021, 3762 and 9292 between the four K&L subsets and compared to control subjects using data of Validation 1
Intensities at 3762 and 9292 m/z values were significantly higher (m/z=3762) or lower (m/z=9292) (table 3) in OA patients than in control groups, and the former (figure 2C) increased with increasing K&L scores of OA patients whereas the latter (figure 2D) decreased with increasing K&L scores. Figure 2E–G shows the four biomarkers in gel view spectra from 10 OA patients with K&L0 and 10 with K&L4. The figure shows that the biomarkers with m/z values at 1979, 2021 and 3762 are barely detectable in K&L0 but they are present at much higher concentrations in serum samples from patients with K&L scores of 4, whereas the opposite is true for the biomarker at m/z value of 9292.
Validation 2 was performed in a single day with K&L0 (n=24) and K&L4 (n=15) patients from Validation 1, to ensure that these four biomarkers were not artefacts due to the time spent during the Validation 1 study performed over 6 days. It allowed for discarding any technical ambiguities and strengthening the validity of the four biomarkers still showing p values below 0.05 (table 2 – Validation 2). Moreover, using α-cyano-4-hydroxycinnamic acid (CHCA),which allows for better visualisation of small peptides, new biomarkers were detected at 1691, 1778 and 1865 m/z values on IMAC-Ni. These new biomarkers are illustrated in figure 2H–K and were found to be variants of the 2021 m/z peak as further discussed below. The 2021 m/z biomarker can also be visualised in gel view K&L4 spectra (IMAC-Ni arrays) (figure 2K).
Synovial fluid analysis study
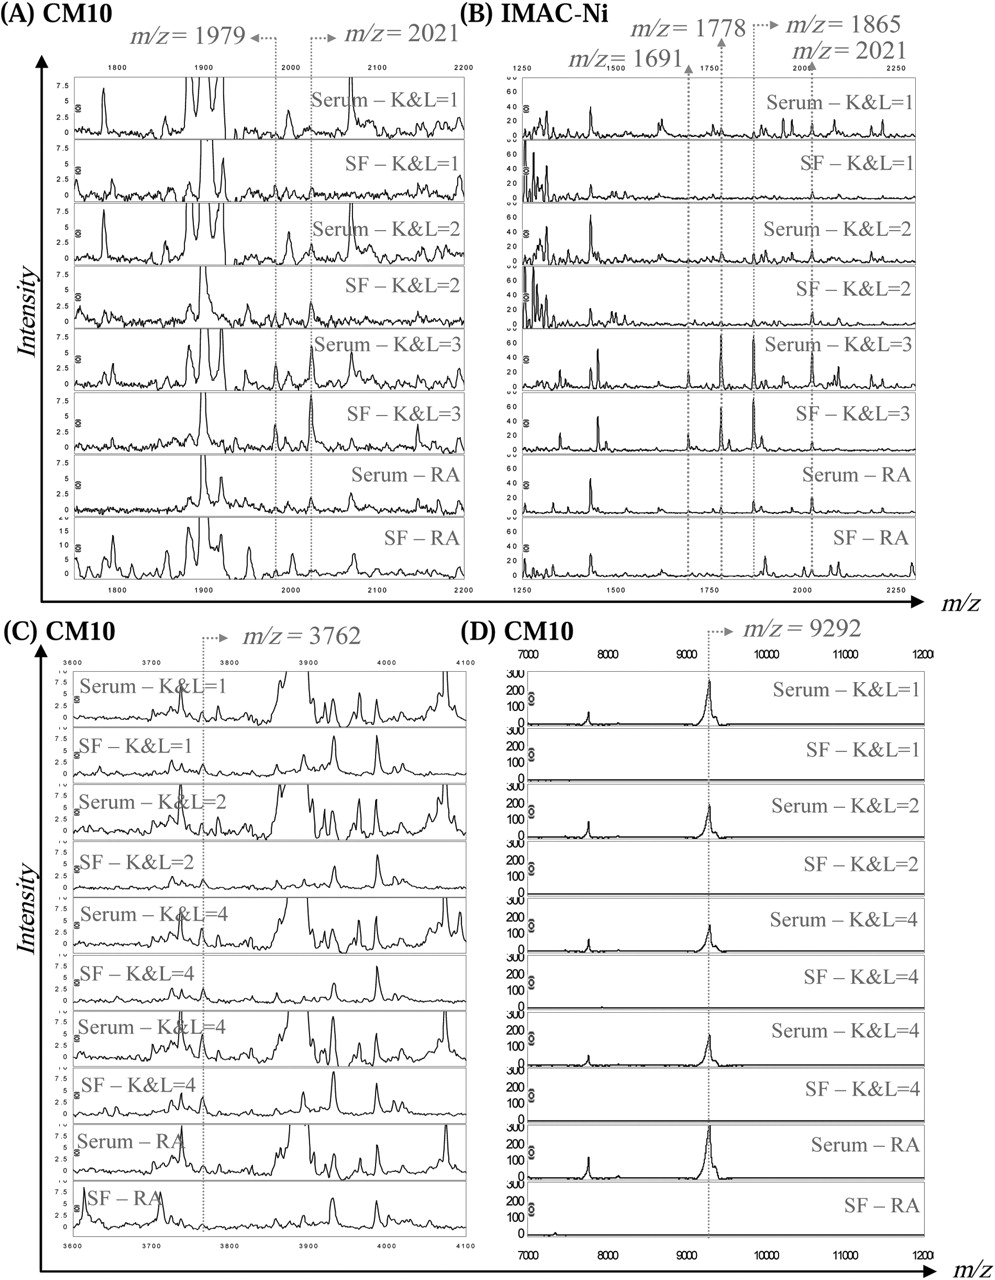
Peaks at 1979, 2021 and 3762 m/z values were simultaneously identified in serum and synovial fluid samples of OA patients at different K&L scores (figure 3). Peaks at 9292 m/z value were only detected in serum, not synovial fluids, of all OA and RA patients (figure 3). Finally, peaks corresponding to variants of the 2021 m/z biomarker (m/z=1691 and 1778) were also detected in both fluids.

Proteomic study on paired serum and synovial fluid (SF) spectra provided from osteoarthritis (K&L1 to K&L4) and rheumatoid arthritis patients, illustrating presence or absence of peaks at m/z values of 1979 (A), 2021 (A and B), 1691 (B), 1778 (B), 1865 (B), 3762 (C) and 9292 (D) in both fluids.
Biomarkers identification
Proteins at 1979, 2021 and 9292 m/z values were purified using classical chromatography approaches and identified as the C-terminal end product of the V65 vitronectin subunit, the C3f peptide and the connective tissue-activating peptide III (CTAPIII), respectively, as further described in the supplementary data. Peaks at 1691, 1778, 1865 and 2021 m/z values were found clustered on spectra provided by IMAC-Ni arrays, and therefore are variants (truncated form at the C-terminal end by 3, 2 and 1 amino acid respectively) of C3f peptides. The 8862 m/z value is a four amino acid truncated form at the N-terminal end of CTAPIII and is better known as β-thromboglobulin (β-TG) protein.
Correlation with currently available biomarker assays
Peak intensities corresponding to 1979 (V65 vitronectin fragment), 2021 (C3f), 3762 (unknown) and 9292 (CTAPIII) m/z values and detected in spectra generated by 93 OA serum samples, were correlated to a wide range of currently available biomarkers (supplementary table 1). The V65 vitronectin fragment was positively correlated with C-telopeptide of type II collagen (CTXII) and negatively with aggrecan and pro-matrix metalloprotein 1 (pro-MMP-1) (supplementary table 2). The C3f peptide was negatively correlated with aggrecan and pyridinoline (pyd). The protein fragment at 3762 m/z value showed positive correlation with cartilage glycoprotein 39 (YKL-40), MMP-3, pyd and deoxypyridinoline (dpd), and negatively correlated with keratan sulphate epitope 5D4 (KS). Finally, CTAPIII was positively correlated with MMP-3, tumour necrosis factor α (TNFα) and aggrecan.
Discussion
Using the SELDI-TOF-MS approach, four novel biomarkers for OA were detected, and all appeared to discriminate OA patients from control subjects (NC and RA), RA patients presenting a high DAS28 (>5.1). Two of the biomarkers have been identified as the C-terminal end product of the V65 vitronectin subunit and C3f peptide. A third one at 3762 m/z value remains unidentified due to its high hydrophobicity. These three biomarkers were found with increased levels of expression in sera of patients with severe OA and were also detected in synovial fluids from the same patients. The fourth novel biomarker was identified as a platelet-specific protein, CTAPIII, and was found to have a decreased level of expression in serum from patients with severe OA patients compared to patients with early stage disease.
V65 vitronectin fragment
The 1979 m/z peak identified as a C-terminal end product of the V65 vitronectin subunit in the heparin binding domain, was predominantly detected in CM10 spectra of OA patients with the worst disease (K&L3 and 4) in Analysis and Validation studies. However, peak intensities were significantly higher in all OA subsets, including K&L0, compared to control subjects (NC and RA) and further increased with increasing K&L scores. A preliminary proteomics study on paired serum samples and synovial fluids of OA patients revealed the presence of this fragment in both fluids. Accordingly, the serum V65 vitronectin fragment may be derived from joint fluid/tissues and appeared to be an interesting marker of OA. Clearly, further studies are required to confirm its diagnostic value.
Vitronectin is a cell adhesion and spreading factor found in serum and in many tissues including cartilage and synovium.35 It is recognised by αVβ3 integrin receptor. Interaction of vitronectin through its RGD motif36 has been well described.37,–,39 Highly expressed αVβ3 integrins have been detected on bone-resorbing osteoclasts and were shown to play an essential role in mediating osteoclast attachment to bone matrix allowing active bone resorption.37 40 41 A weak expression of αVβ3 integrin receptor has also been observed on chondrocytes,42 and this has been described as a major player in the regulation of inflammatory mediators (interleukin 1β, nitric oxide and prostaglandin E2) in OA-affected cartilage,43 but is not thought to be involved in the adhesion of chondrocytes to cartilage44 or transmission for chondrocyte dedifferentiation.45 The αVβ3 integrin is also found in other joint tissues such as fibroblast-like synoviocytes.46
As cartilage loss and mild to moderate synovial inflammation are recognised features of OA, especially at advanced stages (K&L3 and 4) of the disease, the V65 vitronectin fragment could play an important role in the pathogenesis of OA. Moreover, in the present study, OA progression is characterised by elevated serum levels of V65 vitronectin fragments and CTX-II, and low serum levels of aggrecan and pro-MMP-1, a typical pattern of progressive OA when the cell number declines,47 therefore the V65 vitronectin fragment may also be an important marker of disease outcome in OA.
The exact signification of elevated levels of V65 vitronectin in OA remains unknown. Does it act as an agonist of αVβ3 integrins or is it just a consequence of matrix degradation with extracellular matrix (ECM) protein release due to MMP activation? Indeed, it has been shown that vitronectin is a potential substrate of MMP family members, especially MMP-2, -3, -7 and -9, suggesting that MMPs may participate in the turnover of vitronectin in tissues.48
C3f peptide and variants
The 2021 m/z peak identified as C3f peptide was predominantly detected in IMAC-Ni2+ spectra from OA patients with the worst disease (K&L3 and 4) in both Analysis and Validation studies. Moreover, C3f peptide serum levels were significantly higher in all OA subsets, including K&L0, compared to control subjects (NC and RA) and further increased with increasing K&L scores. A second validation study (Validation 2) was performed in a single day to circumvent false-positive biomarker detection due to extensive sample handling procedures as described by West-Nørager et al,49 and was considered as a quality control study. However, CHCA was used instead of sinapinic acid (SPA)matrix in Validation 2 to better visualise small peptides below 2000 Da. Three peaks, at 1691, 1778 and 1865 m/z values were therefore detected with a high discriminatory power when comparing OA patients with the worst radiographic OA (K&L score 4) to patients with no radiographic OA (K&L score 0). These peaks were clustered on spectra and their m/z values correspond to truncated variants of C3f. C3f peptide is a fragment released during the catabolic degradation of C3b by Factor H after C3 activation.50 C3f is further degraded to form C3f-des-Arg (peptide mass of 1865 Da) and variants by carboxypeptidase N. A preliminary proteomics study on serum samples and synovial fluids of OA patients revealed the presence of C3f peptides in both fluids. Furthermore, C3f peptide serum levels were significantly (and positively) correlated with V65 vitronectin serum levels in OA patients tested. Interestingly, vitronectin is also involved in the complement cascade, inhibiting the assembly of the membrane attack complex. Finally, C3f biomarker also showed significant negative correlations with serum levels of aggrecan and pyd.
Significant pathophysiological roles could be played by C3f in cartilage and other joint tissue metabolism. Indeed, complement components can be found in healthy cartilage as they are expressed by chondrocytes. However, their production may be increased in the presence of pathological mediators. Cartilage mainly consists of ECM made with the highly negatively charged proteoglycan (aggrecan). ECM is found settled in networks of collagen fibres, which contain many other bound molecules such as small leucine-rich repeat proteins (SLRPs). Some of these SLRPs, such as fibromodulin (FMOD) and osteoadherin (OSAD), interact with the globular head domain of C1q to further activate the classical and alternative pathways of complement factors.51 52 FMOD and OSAD, as well as chondroadherin also interact with Factor H. In OA pathology, where the integrity of the ECM is compromised by proteolytic degradation, SLRPs are released into synovial fluid becoming exposed to complement factors promoting activation and, hence, further opsonisation of self-tissues, anaphylaxis and general inflammation. In more severe cases (K&L grades 3 and 4) serum C3f fragments were higher, whereas the levels of circulating aggrecan and pyd were lower. This observation is consistent with the sharp decline of proteoglycan synthesis and the promotion of bone remodelling normally seen in OA patients with progressive disease. Further studies will aim to determine whether there is a direct correlation between these SLRPs and C3f peptides. C3f peptides had been detected in another recent proteomics study53 using purification of short peptides with C18-bound magnetic beads, in sera of patients with systemic sclerosis (SSc). The authors described a predominance of the C3f-des-Arg form in sera of SSc patients.
m/z=3762
Peak intensities at 3762 m/z value were significantly increased in OA patients as compared to NC and/or RA patients, and also increased with increasing K&L scores. It has not been possible to identify this protein of interest because of its high hydrophobicity and difficulty being ionised. However, it was significantly and positively correlated with serum YKL-40, MMP-3, pyd and dpd levels, and negatively with KS. Therefore, measurement of this biomarker in serum may reflect overall changes in major joint tissues as it has been associated with cartilage damage (YKL-40, KS), synovial inflammation (MMP-3) and bone remodelling (pyd, dpd).54,–,56
CTAPIII and variants
CTAPIII peak intensities (9292 m/z value) were significantly lower in the OA patient population compared to control subjects, and among OA subsets, CTAPIII remained significantly reduced in OA patients with the worst radiographic diseases (K&L score 3 or 4). Variants (β-TG (8862 m/z value), truncated form at 9060 m/z value, doubly charged forms (2H+) at 4644, 4430 and 4530 m/z value) were also detected as discriminatory biomarkers in the Analysis study. However, CTAPIII was the only biomarker having a statistically discriminant p value in the Analysis and Validation studies. CTAPIII and variants were detected in serum samples only, not synovial fluids, suggesting that these peptides are not locally produced in joints and, therefore, cannot be joint tissue-specific. On the other hand, CTAPIII and variants could be markers of systemic inflammation, a notion that would be supported by positive correlations with serum levels of TNFα and MMP-3. In other words, severe stages of knee OA are characterised by low serum levels of CTAPIII, TNFα and MMP-3, also a typical pattern of progressive OA, when cell number declines.
Conclusion
The proteomic study detected four novel OA biomarkers. At least two, the V65 vitronectin fragment and C3f, can discriminate OA patients from healthy control subjects (NC) and disease control subjects (RA), and are therefore likely to be potential diagnostic markers for OA. V65 and C3f, as well as the remaining unidentified protein at m/z 3762, increased with increasing radiographic severity of OA and therefore are potential markers of disease stage. The levels of the fourth novel marker, CTAPIII protein, were lower in more severe stages of OA (K&L grades 3 and 4) but higher in both sets of control subjects, and were correlated to markers of inflammation suggesting that this marker might reflect a proinflammatory pathway. The proteomics study reported here is based on samples obtained from a cross-sectional prospective study, the limitations of which are described in the supplementary data.
There is a need for further studies using serum samples from new cohorts, a wider range of disease control subjects, as well as longitudinal studies to establish the usefulness of the four novel biomarkers identified.
Acknowledgments
DdS and MS contributed equally to this work. The authors thank Aline Desoroux, Biserka Relic and GIGA bioinformatics and proteomics platforms (Ulg) for their expert technical assistance.
References
Supplementary materials
Web Only Data
Files in this Data Supplement:
Footnotes
DdS and MS contributed equally to this work.
-
Funding This study was supported by the National Fund for Scientific Research (FNRS, Belgium) and the ‘Fond d'Investissement pour la Recherche Scientifique’ (FIRS), CHU Liège, Belgium. MF is Research Associate and M-PM and EL are Senior Research Associates at FNRS (National Fund for Scientific Research).
-
Patient consent Obtained.
-
Competing interests None.
-
Ethics approval This study was conducted with the approval of the institutional review boards (Research Ethics Committee) of both the United Bristol Healthcare NHS trust, Bristol, UK, and the University Hospital, CHU Liège, Belgium.
-
Provenance and peer review Not commissioned; externally peer reviewed.