Article Text

Abstract
Objectives: To examine whether the quantity of cartilage or semiquantitative scores actually differ in knees with mild radiographic osteoarthritis compared with knees without osteoarthritis.
Methods: Framingham Osteoarthritis Study participants had knee tibiofemoral magnetic resonance imaging-based measurements of cartilage. Using three-dimensional FLASH-water excitation sequences, cartilage volume, thickness and subregional cartilage thickness were measured and cartilage scored semiquantitatively (using the whole-organ magnetic resonance imaging score; WORMS). Using weight-bearing radiographs, mild osteoarthritis was defined as Kellgren/Lawrence (K/L) grade 2 and non-osteoarthritis as K/L grade 0. Differences between osteoarthritis and non-osteoarthritis knees in median cartilage measurements were tested using the Wilcoxon rank sum test.
Results: Among 948 participants (one knee each), neither cartilage volume nor regional thickness were different in mild versus non-osteoarthritis knees. In mild osteoarthritis, cartilage erosions in focal areas were missed when cartilage was quantified over large regions such as the medial tibia. For some but not all subregions of cartilage, especially among men, cartilage thickness was lower (p<0.05) in mild osteoarthritis than non-osteoarthritis knees. Because semiquantitative scores captured focal erosions, median WORMS scores were higher in mild osteoarthritis than non-osteoarthritis (all p<0.05). In moderate/severe osteoarthritis (K/L grades 3 or 4), osteoarthritis knees had much lower cartilage thickness and higher WORMS scores than knees without osteoarthritis.
Conclusions: In mild osteoarthritis, the focal loss of cartilage is missed by quantitative measures of cartilage volume or thickness over broad areas. Regional cartilage volume and thickness (eg, medial tibia) are not different in mild osteoarthritis versus non-osteoarthritis. Subregional thickness may be decreased in mild osteoarthritis. Semiquantitative scoring that assesses focal cartilage damage differentiates mild osteoarthritis from non-osteoarthritis.
Statistics from Altmetric.com
Evaluation of knee osteoarthritis has been based primarily on plain radiographs, which depict osseous changes thought to occur late in the disease process.1 Loss of cartilage is not directly visible on radiographs and can only be inferred indirectly by joint space narrowing (JSN).
Cartilage thickness and volume as assessed by magnetic resonance imaging (MRI) have emerged in recent years as important quantitative measurements of a joint’s osteoarthritic status. The proliferation of studies using these measurements has been spurred by careful validation studies showing that the thickness and volume of cartilage can be estimated accurately by the careful quantitative measurement of images from high resolution MRI.2 3 4 5 6 As one central element of the pathology of osteoarthritis consists of the wearing away of articular cartilage, cartilage thickness and volume should diminish as osteoarthritis develops.7 8 9 Also, quantitative methods for measuring cartilage damage are sought to aid in the diagnosis of early osteoarthritis.10 11
Another approach to characterise cartilage from MRI is the use of semiquantitative measures such as the whole-organ magnetic resonance imaging score (WORMS),12 which evaluate cartilage surface morphology by the extent and depth of cartilage lesions, using an ordinal scale to quantify these changes. Satisfactory specificity and sensitivity for detecting focal chondral lesions by MRI have been demonstrated in vivo and in cadaveric studies.13 14 15
We used cartilage and plain radiographic data from a large community-based study of knees with and without radiographic knee osteoarthritis to examine whether cartilage thickness and volume, denuded bone area and a semiquantitative measurement of cartilage morphology were decreased in knees with osteoarthritis compared with knees without osteoarthritis, and to describe the relationship between quantitative and semiquantitative measurements.
Methods
Subjects
For this cross-sectional study, participants were members of the Framingham Osteoarthritis Study Cohort, which consists of two separate groups: members of the Framingham Heart Study Offspring cohort,16 and a newly recruited cohort from the town of Framingham, Massachusetts, the community sample. Details of recruitment have been reported elsewhere17 (see supplemental file 1, available online only). Both groups were selected from the community without respect to knee pain or osteoarthritis status.
Approval for the study was obtained from the Boston University Medical Center Institutional Review Board.
Assessment of MRI
In the Framingham Offspring subgroup, only participants who reported knee pain underwent MRI of the knee(s). All subjects in the community sample underwent bilateral knee MRI, regardless of whether they had symptoms. Participants in whom MRI was contraindicated did not undergo scanning, and in one subject with a total knee replacement only the native knee was scanned (see supplemental file 2, available online only).
Quantitative analysis
Using the coronal three-dimensional FLASH-water excitation sequences, the cartilage plates of the medial tibia, lateral tibia, central medial femur and central lateral femur were quantified with three-dimensional digital post-processing using proprietary software (Chondrometrics Works, Chondrometrics, Ainring, Germany)18 (see fig 1). In brief, manual segmentation of the total subchondral bone area, (including denuded bone areas, but excluding osteophytes)8 and of the cartilage surface were performed in medial tibia and lateral tibia and in the weight-bearing central subregion of the femoral condyles (central medial femur and central lateral femur), as described previously.19 Segmentation was performed by eight technicians who had received formal training in cartilage segmentation before the study, and all segmentations underwent quality control review by an expert (FE). If necessary, segmentations were corrected by the original readers. Based on these segmentations, the following measures were computed: (1) total cartilage volume; (2) total subchondral bone area; (3) total mean cartilage thickness including denuded cartilage areas as 0 mm cartilage thickness, but not including osteophyte cartilage; (4) percentage denuded area, defined as the percentage of total cartilage bone surface denuded of cartilage; and (5) total mean cartilage thickness excluding denuded cartilage area.5
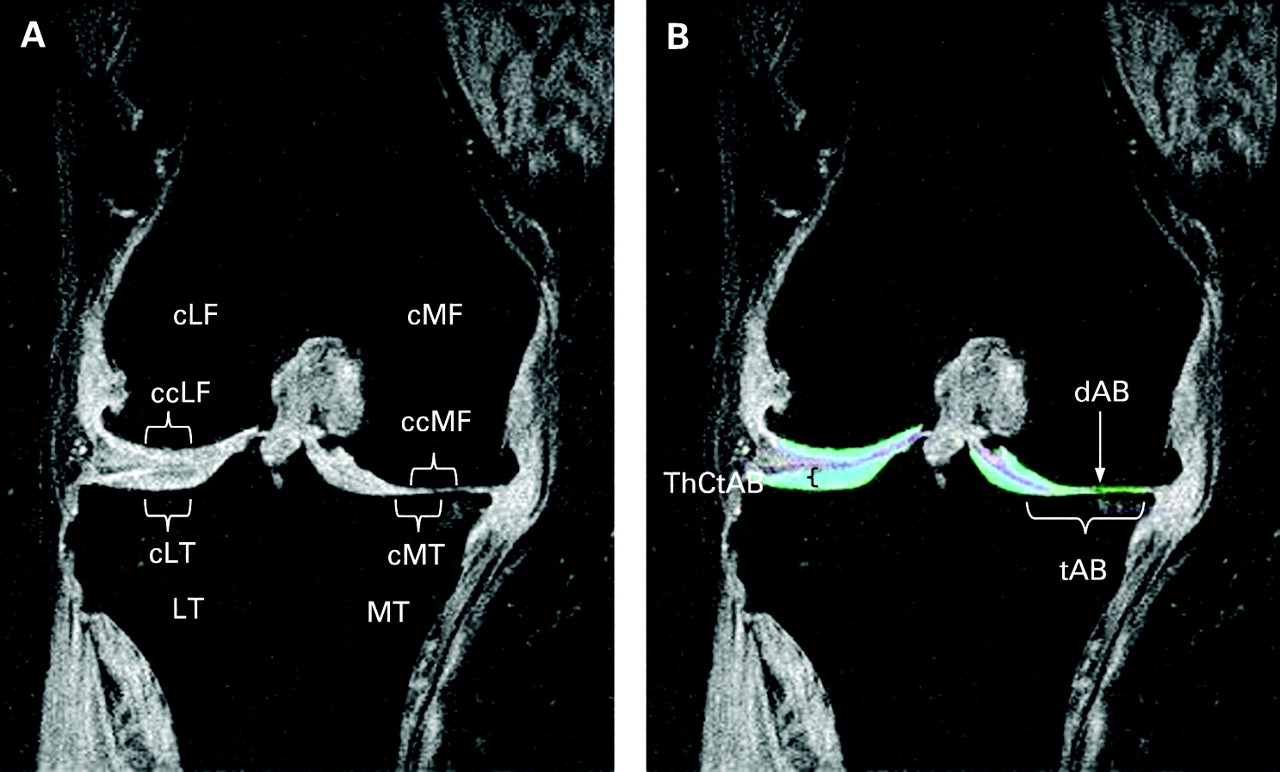
Coronal magnetic resonance image of the knee of a patient with medial osteoarthritis (Kellgren/Lawrence grade 4). (A) Without segmentation of the cartilage, showing the different regions (medial tibia (MT) and lateral tibia (LT); central medial femur (cMF) and central lateral femur (cLF) and subregions (central parts of the regions: central medial tibia (cMT), central lateral tibia (cLT), ccMF and ccLF). (B) Same plane with segmentation of the femorotibial cartilage plates (cartilage shown in turquoise). Cartilage thickness (ThCtAB) is preserved in the lateral tibial. There is severe damage on the medial side with a small denuded area of subchondral bone (dAB) (this is just to the lateral side of the turquoise cartilage). The total area of subchondral bone (tAB) does not include osteophytes (eg, there is a small medial osteophyte that is excluded).
To identify subregions of cartilage loss in mild/advanced osteoarthritis and using recently published technology,20 the medial tibia and lateral tibia plates were subdivided into five subregions (each covering approximately 20% of the total subchondral bone area) and the central medial femur and central lateral femur plates in three subregions (each covering 33% of the total subchondral bone area), respectively. Based on recent work suggesting early loss in central areas,21 22 we focused specifically on the central medial and lateral tibia and on the central medial and lateral femora. In a previous study, test–retest coefficients of variations (with joint repositioning) ranged from 2.0% to 3.6%.4 Regional measurement displayed precision errors between 1.5% and 4.7%.20
Semiquantitative analysis
Using the proton density-weighted fat suppressed sequences, MRI were analysed with the semiquantitative WORMS method by two experienced musculoskeletal radiologists (AG, FR), which in its full scope incorporates various features of different diarthoidal tissues.12 For the purposes of this paper, we focused only on articular cartilage integrity so as to create a parallel with other measures of cartilage loss. Scores for cartilage using WORMS range from 0 (normal) to 6 (no cartilage remaining in a region) (see supplemental file 3 for details of scoring, available online only). Cartilage was evaluated in 10 subregions of the tibiofemoral joint: anterior, central and posterior segments of the medial and lateral femur and tibia. Because our focus was only on cartilage in the tibiofemoral joint, we did not include patellofemoral regions in our analysis. To adapt the WORMS scores to the plate areas described above, we assigned the following WORMS subregions to the plates: the central medial tibia subregion corresponds to the central medial tibia plate and the central medial femur to the central medial femur plate. We averaged the three subregions read for WORMS in the medial tibia (anterior, central and posterior) to depict the medial tibia plate. In a random sample of 170 knees, interrater agreement for cartilage semiquantitative scoring showed a weighted k value of 0.73 (95% CI 0.71 to 0.75).
Assessment of radiographs
In all subjects, bilateral fixed flexion weight-bearing posteroanterior23 views of the knees were obtained. All radiographs were read for the Kellgren/Lawrence (K/L) grade (0–4)24 (weighted kappa (intrarater reliability) 0.83; 95% CI 0.74 to 0.91) by an academically based musculoskeletal radiologist (PA). Kellgren and Lawrence used different descriptions of their grades,25 with grade 2 usually described as having definite osteophytes and possible narrowing, but with non-weight-bearing films used in their atlas. To standardise this approach, because osteoarthritis is usually defined as showing cartilage loss and because in our highly standardised weight-bearing films, we rarely encountered a knee with definite osteophytes that did not show probable narrowing, we agreed in advance that K/L grade 2 would be defined as definite osteophytes and probable mild narrowing.
Analysis plan
The overall goal of the analysis was to determine whether knees with osteoarthritis (K/L grades 1–4) had quantitative and semiquantitative measurements that differed from knees with no osteoarthritis (K/L grade 0), with a special emphasis on whether this was true for mild osteoarthritis (K/L grade 2). We pursued two different analytical approaches.
First, we performed plate-specific analysis to examine differences between different cartilage measurements (quantitative: cartilage volume, total subchondral bone area, cartilage thickness, denuded area of subchondral bone and cartilage thickness excluding denuded cartilage area; semiquantitative: WORMS score) and the K/L grades (0–4); this was done separately for men and women, as gender is an important confounder,26 27 28 29 and for medial and lateral compartments. Because some knees would be expected to have osteoarthritis in the lateral compartment and in that case the medial compartment cartilage would be unaffected, we diagnosed medial tibiofemoral osteoarthritis as follows: JSN present only in the medial compartment or medially more than laterally on radiographs. If we could not decide upon the location of the disease based on this rule, we made the distinction based on the location of the largest osteophytes.30 Lateral disease was diagnosed similarly, and these definitions were applied for each K/L grade of 1 or greater. For each cartilage measure, we calculated medians with interquartile ranges. Differences between K/L grades in median cartilage measurements were tested using the Wilcoxon rank sum test. As WORMS are ordinal data, only non-parametric tests can be used in their analysis. Given this, we also chose to use non-parametric tests for continuous outcomes so as to permit comparison between the results of different analysis.
Second, one might argue that in knees with K/L grade 0 many knees would already have some kind of cartilage damage. We therefore performed a sensitivity analysis, defining a subgroup of knees with K/L grade 0 that included only knees without any indication of cartilage damage (maximum WORMS score in all of the 10 tibiofemoral subregions for cartilage equal 0).
For all analyses, p values less than or equal to 0.05 (two-tailed tests) were considered significant. All analyses were conducted using SAS software, version 9.1.
Results
A total of 948 participants in the offspring and community cohorts provided information in all three imaging modalities: proton density-weighted fat-suppressed images for WORMS readings, three-dimensional FLASH-water excitation sequences for quantitative measurements and radiographic information on K/L grades. These subjects had a mean age of 63.6 years and a mean body mass index of 28.6 kg/m2. Twenty-five per cent reported knee pain on most days in the studied knee; 57% were women. More than three-quarters did not show evidence of osteoarthritis in the knee joint studies (76% had a K/L grade of 0). Of knees with osteoarthritis, we classified 189 (83%) as having medial osteoarthritis. In medial osteoarthritis K/L grade 1, 15% had a radiographic JSN grade 1, and 89% in K/L grade 2. All K/L grade 3 had a JSN grade 2, and all K/L grade 4 had a JSN grade 3.
Table 1 (women) and table 2 (men) present the data for cartilage volume, total subchondral bone area, cartilage thickness and WORMS by K/L grade separately for the medial compartment. We found similar findings for the lateral compartment. However, the numbers for each K/L stratum for lateral disease were sparse, ranging from two to seven subjects per stratum and are therefore not presented.
Median (interquartile range) for semiquantitative and quantitative MRI measurements of the medial tibiofemoral joint in women
Median (interquartile range) for semiquantitative and quantitative MRI measurements of the medial tibiofemoral joint in men
In general, no significant difference was seen comparing cartilage volume in knees with K/L grade 2 compared with knees with K/L grade 0, and in some analyses cartilage volume was actually higher in knees with K/L grade 2, eg, in the medial tibial plate in women (1684 mm3 (interquartile range 1498–1895) in K/L grade 0 compared with 1870 mm3 (1675–2111) in K/L grade 2; p<0.001). For some but not all cartilage regions, cartilage volume was lower in K/L grade 3 knees than in those with K/L grade 0 (see tables 1 and 2). A consistent decrement in cartilage volume was seen in knees with K/L grade 4 compared with K/L grade 0.
In women, cartilage thickness was generally not different for K/L grade 2 compared with K/L grade 0, with the exception of the central region of the central medial femur, where thickness was lower in knees with K/L grade 2 (see table 1). In men, cartilage thickness was diminished in K/L grade 2 knees compared with those with K/L grade 0 both in general and in the central medial femur region and both central subregions of the medial femoral and tibial plates, but it was not true for the larger medial tibia region.
When we examined K/L grade 3 knees, we found significantly lower values for cartilage thickness than for K/L grade 0 knees in both men and women. Again cartilage thickness of the subregions (central medial tibia and the central region of the central medial femur) differentiated better between K/L grade 3 and K/L grade 0 than cartilage thickness of total plates (medial tibia, central medial femur). For cartilage volume, we found conflicting results. In men, cartilage volume was diminished in K/L grade 3 knees compared with those with K/L grade 0, whereas for women it was not.
In K/L grade 0, only few MRI showed any exposed regions of denuded areas of subchondral bone (range from 2.5% of knees in men in medial tibia to 0.3% in women in central medial femur). In K/L grade 2, less than 20% of all knees had denuded areas of subchondral bone, and less than 60% among knees with K/L grade 3 had denuded areas of subchondral bone. However, in K/L grade 4, all knees had measurable areas of exposed bone (denuded areas of subchondral bone >0). Therefore, although often present in severe osteoarthritis, denuded area of subchondral bone scores did not discriminate between K/L grade 2 and K/L grade 0.
The semiquantitative WORMS score consistently showed significant differences between K/L grade 2 and K/L grade 0 knees. To understand better how a semiquantitative assessment could be sensitive to mild changes of osteoarthritis, we looked at the distribution of WORMS cartilage scores by K/L grade (fig 2). WORMS scores of 0 and 1 reflect preserved thickness and no morphological lesions. As WORMS scores 2 and 3 reflect focal erosions with preserved cartilage thickness, we combined these scores. WORMS scores of 4 or greater indicate diffuse cartilage thinning. In K/L grade 0 the predominant score (approximately 80% of knees) was WORMS 0 for the medial tibia and central medial femur, whereas in K/L grade 1 and K/L grade 2, WORMS scores of 2 and 3 predominated, representing focal erosions of cartilage and not diffuse loss or thinning. In K/L grades 3 and 4, WORMS scores above 4 predominated.

Percentages of different whole-organ magnetic resonance imaging score (WORMS) categories for the medial tibia (MT) and central medial femur (cMF) plate are plotted against Kellgren/Lawrence (K/L) grade (men and women). WORMS score categories 0 and 1 represents unimpaired cartilage, score 2, 2.5 or 3 signify focal thinning/erosions in small areas, and WORMS scores equal or greater than 4 indicate diffuse cartilage thinning.
Because K/L grade 0 could include knees with mild osteoarthritis on MRI, we reperformed analyses in which we restricted non-osteoarthritis knees to those that not only had K/L grade 0, but that also had WORMS scores of 0 (we found almost no knees with scores of 1). These results, displayed in tables 1 and 2 in the second column, were similar compared with results for all knees with K/L grade 0. We did not find different results when analysing for the two cohorts separately. Also, analyses of those with knee pain and mild osteoarthritis showed similar findings to those of all knees with mild osteoarthritis irrespective of knee pain.
Discussion
Quantitative measurement of cartilage volume did not distinguish mild osteoarthritis (K/L grade 2) from non-osteoarthritis. We also found that cartilage thickness over entire cartilage plates, such as the medial tibia, failed to distinguish knees with mild osteoarthritis from those without osteoarthritis. For women, even some subregional measurements showed no significant differences between mild osteoarthritis and non-osteoarthritis knees, but we did find more consistent differences between mild osteoarthritis and non-osteoarthritis when we focused on subregional cartilage plates, especially in men. Denuded area had a value of 0 in most knees with mild osteoarthritis, suggesting that its value in differenting osteoarthritis from non-osteoarthritis is limited. A semiquantitative assessment did distinguish mild from non-osteoarthritis knees, and most of the mild osteoarthritis knees showed scores of 2 or 3, evidence of focal erosive cartilage lesions that might not be detected using quantitative measurement that summarises morphology over broad areas.
We are not aware of previous attempts to evaluate different cartilage measurement techniques in a large cross-sectional study. Most studies have focused on only one quantitative measurement, eg, volume9 11 An additional strength of this study is its large sample size and the independent assessment of quantitative and semiquantitative measurements by MRI radiologists who were blinded to the K/L status.
How can we interpret our findings that cartilage volume was actually increased in all plates in women with mild osteoarthritis (K/L grade 2) compared with non-osteoarthritis (K/L grade 0)? Cartilage volume is a function of cartilage thickness and the size of the area of the total subchondral bone area. In our cohort, as described previously,31 total subchondral bone area values (bone area) increased in almost all K/L grades 1–4 compared with K/L grade 0, thus providing an explanation as to why cartilage volume was higher, eg, in K/L grade 2. It was shown in the past that volume should be adjusted for bone size, and our results confirm these findings.8
For cartilage thickness measurements, which adjust for bone size, the only sites where there was a significant reduction in cartilage thickness among knees with mild osteoarthritis (K/L grade 2) were the central subregions such as the central medial femur and central medial tibia (for men only) and in the central part of the medial femur for both genders. As cartilage loss occurs most frequently at the load-bearing sites,15 we are probably sampling from the regions where cartilage loss is occurring. Cartilage thickness includes denuded areas of subchondral bone, and the question remains as to whether cartilage thickness measured for remaining cartilage only would perform better in differentiating early osteoarthritis from non-osteoarthritis. However, only approximately 20% of knees with K/L grade 2 had any denuded area, and the figures for cartilage thickness excluding denuded cartilage area and cartilage thickness therefore differ not at all for K/L grades 0, 1 and 2 (results not shown).
Why are quantitative measures not very sensitive to the development of radiographic osteoarthritis even at a stage when the x ray shows evidence of disease? One might argue that in K/L grade 2 JSN is not impaired, as described by some authors.32 However, in our sample, almost all radiographs with K/L grade 2 had JSN grade 1 (86% in women and 94% in men). The most comprehensive explanation might provide insights from the semiquantitative measures and regional measures. As shown in fig 2, in K/L grade 2 the predominant WORMS scores are 2 and 3, representing small areas of focal thinning that may not be picked up by quantitative measures that describe the entire cartilage plates. In addition, the swelling of cartilage surrounding cartilage defects could negate the effect of focal losses on quantitative measurements that sum cartilage morphometry over a large region. Cartilage swelling has been shown in animal models to be a feature of early stages of experimental osteoarthritis.33
This study has several limitations. Despite the large number of participants, this was a community sample and most individuals did not have osteoarthritis. As a consequence there were small numbers of subjects with osteoarthritis of a given compartment, especially those with advanced stages and with lateral disease. However, in the compartment of most interest, the medial tibiofemoral compartment with mild osteoarthritis (K/L grade 2), we had 80 subjects contributing to the measurements. Furthermore, we cannot make any conclusions pertaining to longitudinal findings. The reproducibility of cartilage volume and surface has been shown to be excellent,20 34 35 and it is likely that these measurements are a very sensitive tool for detecting changes over time.36 Whereas radiographic osteoarthritis is not the optimal gold standard measure of osteoarthritis, it is still the standard used to define osteoarthritis. Framingham Study radiograph readings have provided referenced estimates of the population prevalence of osteoarthritis. As we do not yet know how best to define osteoarthritis on MRI, osteoarthritis defined on radiographs is necessarily the standard for the current work.
In conclusion, cartilage loss in mild osteoarthritis tends to be focal and such loss is best detected by experienced readers applying semiquantitative methods. For cross-sectional studies whose goal is to identify those with radiographic osteoarthritis, these methods may be optimal. Cartilage volume does a poor job of distinguishing osteoarthritis from non-osteoarthritis knees. Decreases in cartilage thickness, which take into account bone size, could probably only be used if there is a focus on subregions within the larger cartilage plates.
REFERENCES
Supplementary materials
Web Only Data 69/1/143
Files in this Data Supplement:
Footnotes
▸ Additional supplementary files 1–3 are published online only at http://ard.bmj.com/content/vol69/issue1
Funding This study was supported by National Institutes of Health (NIH) AR47785, NIH AG18393 and by the National Heart, Lung, and Blood Institute’s Framingham Heart Study N01-HC-25195. SR is the recipient of an educational grant by the Swiss Society of Rheumatology.
Competing interests FE is CEO of Chondrometrics GmbH, a company providing magnetic resonance image analysis services. He provides consulting services to Pfizer, MerckSerono, AstraZeneca, and Wyeth. MH has a part-time appointment with Chondrometrics GmbH. AG is president of Boston Imaging Core Lab, LLC (BICL), a company providing radiological image assessment services. He is a shareholder of Synarc, Inc. FR is a shareholder of BICL. Other authors declare no conflict of interest.
Ethics approval Approval for the study was obtained from the Boston University Medical Center Institutional Review Board.
Patient consent Obtained.