Article Text

Abstract
Objectives: To describe the natural history of subchondral bone marrow lesions (BMLs) in a sample of subjects with knee osteoarthritis (OA) or at risk of developing it. Additionally, to examine the association of change in BMLs from baseline to 30-month follow-up with the risk of cartilage loss in the same subregion at follow-up.
Methods: 1.0 T MRI was performed using proton density-weighted, fat-suppressed sequences. BML size and cartilage status were scored in the same subregions according to the WORMS system. Subregions were categorised based on comparison of baseline and follow-up BML status. A logistic regression model was used to assess the association of change in BML status with cartilage loss over 30 months using stable BMLs as the reference group.
Results: 395 knees were included. 66% of prevalent BMLs changed in size; 50% showed either regression or resolution at follow-up. The adjusted odds ratios (95% confidence intervals) of cartilage loss in the same subregion at follow-up for the different groups were 1.2 (0.5 to 1.6) for regressing BMLs, 0.9 (0.5 to 1.6) for resolving BMLs, 2.8 (1.5 to 5.2) for progressing BMLs, 0.2 (0.1 to 0.3) for subregions with no BMLs at baseline and follow-up and 3.5 (2.1 to 5.9) for newly developing BMLs. BML size at baseline was associated with risk of subsequent cartilage loss.
Conclusions: The majority of pre-existing BMLs decreased in size at follow-up. Absence of BMLs was associated with a decreased risk of cartilage loss, while progressing and new BMLs showed a high risk of cartilage loss in the same subregion.
Statistics from Altmetric.com
Subchondral bone marrow lesions (BMLs) are one of the hallmarks of knee osteoarthritis (OA) on magnetic resonance imaging (MRI). Radiologically, BMLs in OA are non-cystic subchondral areas of ill-defined hyperintensity in T2-weighted or proton density-weighted, fast spin echo images on MRI.1,2,3 BMLs are observed regularly in conjunction with cartilage alterations in the same region.4,5,6 Higher grades of cartilage damage seem to be associated with higher prevalence and greater volume of concomitant BMLs.7 As the disease progresses, an increase in oedema volume in the same region subchondrally is positively correlated with an increase in cartilage loss and radiographic joint space narrowing.4,8,9 Recently, the term BML has also been applied to traumatic bone contusions, which are a result of direct or indirect impact.10
However, clinical experience has shown also that regression or even complete resolution of subchondral oedema occurs in a minority of patients. The published data available on the natural history of BMLs are controversial. Kornaat et al reported that in the Dutch GARP study the majority of lesions increased or appeared at 2-year follow-up, but 20% of prevalent BMLs decreased or resolved.11 In the BOKS study <1% of patients showed a decrease of BMLs in size in the tibiofemoral joint after 30-months’ follow-up.4 In another longitudinal study with a smaller patient population, regression of BMLs was seen more regularly.12
Although the size of BMLs at baseline and an increase in BML size are strong predictors of cartilage loss in the same subregion of the knee, it is not known if new BMLs exhibit a higher risk of cartilage loss than progressive BMLs. Furthermore, it would be interesting to know if decreasing or resolving BMLs are associated with a decreased risk of cartilage loss in comparison with size-stable BMLs. We examined these questions in a cohort of subjects with prevalent OA or at risk for OA participating in a large multicentre OA study—the Multicenter Osteoarthritis (MOST) Study.
Patients and methods
Study design and subjects
Subjects were participants in the MOST Study, a prospective epidemiological study of 3026 people aged 50–79 years with a goal of identifying risk factors for incident and progressive knee OA in a sample either with OA or at high risk of developing the disease. Those considered at high risk included people who were overweight or obese, those with knee pain, aching or stiffness on most of the past 30 days, a history of knee injury that made it difficult to walk for at least 1 week, or previous knee surgery.
Subjects were recruited from two US communities, Birmingham, Alabama and Iowa City, Iowa through mass mailing of letters and study brochures, supplemented by media and community outreach campaigns. The study protocol was approved by the institutional review boards at the University of Iowa, University of Alabama, Birmingham, University of California, San Francisco and Boston University Medical Campus.
Subjects were excluded from MOST if they screened positive for rheumatoid arthritis,13 had ankylosing spondylitis, psoriatic arthritis, Reiter’s syndrome, had renal insufficiency that required haemodialysis or peritoneal dialysis, a history of cancer (except for non-melanoma skin cancer), had or planned to have bilateral knee replacement surgery, were unable to walk without assistance, or were planning to move out of the area in the next 3 years.
In this study we included all participants with available baseline and 30-months’ follow-up MRI. These knees were selected for reading for one or more of three substudies in MOST: (a) for structural progression in knees with baseline radiographic OA, a random sample with baseline Kellgren/Lawrence (K/L) grades of 2–314; (b) for a nested case–control study of incident radiographic OA, knees with incident K/L grade 2–4 OA and a random sample of controls from the same source population; (c) for a similar nested case–control study of new onset knee pain, cases and controls.
Radiographs
At baseline, all subjects underwent weight-bearing posteroanterior fixed flexion knee radiography using the protocol by Peterfy et al and a plexiglass positioning frame (SynaFlexer).15 A musculoskeletal radiologist and a rheumatologist experienced in reading study films, both blinded to case–control status and clinical data, graded all posteroanterior films according to the K/L scale. Radiographic tibiofemoral OA was considered present for a K/L grade ⩾2. If readers disagreed on the presence of radiographic OA, the film readings were adjudicated by a panel of three readers.
MRI acquisition
MRIs were obtained in both knees with a 1.0 T dedicated MR system (OrthOne, ONI Medical Systems, Wilmington, Massachusetts, USA) with a circumferential extremity coil using fat-suppressed fast spin echo proton density-weighted sequences in two planes, sagittal (TR 4800 ms, TE 35 ms, 3 mm slice thickness, 0 mm interslice gap, 32 slices, 288×192 matrix, two excitations (NEX), 140 mm2 field of view (FOV), echo train length (ETL) 8) and axial (TR 4680 ms, TE 13 ms, 3 mm slice thickness, 0 mm interslice gap, 20 slices, 288×192 matrix, 2 NEX, 140 mm2 FOV, ETL 8), and a STIR sequence in the coronal plane (TR 6650 ms, TE 15 ms, TI 100 ms, 3 mm slice thickness, 0 mm interslice gap, 28 slices, 256×192 matrix, 2 NEX, 140 mm2 FOV, ETL 8).
MRI interpretation
Two musculoskeletal radiologists, blinded to case–control status and clinical data, read the BMLs and cartilage status according to the Whole-Organ Magnetic Resonance Imaging Score (WORMS) method.16 Baseline and follow-up MRIs were read paired and with the chronological order known to the readers. BMLs and cartilage were assessed simultaneously. BML size was scored from 0 to 3 based on the extent of regional involvement. BMLs were scored in each of the five subregions in the medial and lateral compartments and in four subregions of the patellofemoral compartments, for a total of 14 subregions. Cartilage signal and morphology were scored according to the WORMS system from 0 to 6 in the same 14 articular surface regions. In a modification of WORMS developed for longitudinal readings, a score of 0.5 for any of the BML or cartilage lesions was introduced to reflect a within-grade change (+0.5 reflecting progression for cartilage lesions, +0.5 or −0.5 reflecting within-grade enlargement or regression, respectively). Any change of ⩾0.5 was defined as cartilage loss and any increase or decrease of ⩾0.5 as a change in BMLs. The weighted κ coefficients of inter-reader reliability for the readings of bone marrow lesions (comparing 0–3 scores in each subregion) and cartilage (comparing 0–6 scores in each subregion) were 0.64 and 0.77, respectively.
An additional validation exercise of BML and cartilage scoring for the 1.0 T images was performed by both readers in consensus for 53 knees that also had received a 1.5 T MRI with the same sequence protocol. The weighted κ coefficients of the reliability readings for cartilage and BML scoring were 0.74 and 0.71, respectively. Sensitivity of cartilage assessment using the 1.5 T readings as a reference standard was 85.2%, specificity was 89.1%. Sensitivity and specificity for BML assessment were 73.0% and 96.4%, respectively.
Knees that showed typical radiological signs of traumatic bone contusions, osteonecrosis, fracture or malignant bone infiltration were excluded from the analysis. However, of all analysed MRIs, only one knee showed a subacute tibial depression fracture at follow-up and was excluded.
Analysis approach
For each subregion, we considered status of BML change from baseline to follow-up in five categories: (a) prevalent BML at baseline and no change in BML volume at follow-up (“stable BML”); (b) prevalent BML at baseline and decrease or resolution of BML at follow-up (“regressing BML”); (c) prevalent BML at baseline and progression of BML at follow-up (“progressive BML”); (d) no subchondral BML at baseline and follow-up (“absent BML”); (e) no BML at baseline but BML at follow-up (“new BML”).
We examined the relation of BML change to the risk of cartilage loss in the same subregion using logistic regression models adjusted for age, gender and body mass index (BMI) and baseline K/L grade. In the regression model, the subregion with size-stable BMLs was used as a reference group. We used generalised estimating equations to account for correlation of multiple subregions within a knee. We also analysed the grade of baseline BML size in subregions with prevalent BMLs as a predictor of cartilage loss. All statistical calculations were performed using SAS software (version 9.1 for Windows; SAS Institute; Cary, North Carolina, USA).
Results
Characteristics of the study population
Readings of the baseline and 30-month follow-up knee MRIs were available for 395 knees in 373 subjects. On average the subject sample was elderly (mean (SD) 62.9 (8.2) years), predominantly female (254 subjects, 68.1%) and obese (BMI 30.0 (5.1) kg/m2). The baseline K/L grades of the knees with MRI data were: K/L 0: 172 (43.5%) knees, K/L 1: 93 (23.5%) knees, K/L 2: 58 (14.7%) knees, K/L 3: 57 (14.4%) knees, K/L 4: 15 (3.8%) knees (table 1).
Characteristics of study sample (395 knees in 373 subjects)
Natural history of BMLs
A total of 5309 subregions in 395 knees had baseline and follow-up BML scores as well as baseline and follow-up cartilage scores in the same subregions. In 4869 (91.7%) subregions no BMLs were present at baseline. Four hundred and forty (8.3%) subregions exhibited prevalent BMLs at baseline. Two hundred and fifty-two (4.7%) subregions showed new or size-progressive BMLs at follow-up, while 219 (4.1%) subregions showed regression or resolution of pre-existing BMLs.
In the subgroup with pre-existing BMLs, a decrease of BML size was observed in 41 (9.3%) and complete resolution of BMLs was observed in 178 (40.5%) subregions (fig 1). An increase in BML size was seen in 70 (15.9%) subregions and no change in BML size in 151 (34.3%) subregions. One hundred and eighty-two new BMLs were observed at 30-months’ follow-up. The majority of the pre-existing BMLs that showed complete resolution were grade 1 lesions. However, some grade 2 (n = 21) and grade 3 (n = 11) lesions also resolved completely. For new BMLs a similar distribution was observed. Most new BMLs were small (grade 1) lesions, but a subgroup was classified either as grade 2 (n = 35) or grade 3 (n = 14).

Example of resolving bone marrow lesion (BML). (A) Coronal STIR image. Prevalent large BML in posterior medial tibial plateau (arrowheads). (B) Coronal STIR image. Note complete resolution of pre-existing BMLs. No BML is observed at follow-up.
At baseline, prevalent BMLs in any of the 14 subregions were observed in 244/395 (61.8%) knees. The natural history of these lesions summarised at the level of the knee is presented in table 2. Nearly one-third of knees with no BMLs at baseline exhibited new BMLs at follow-up. Of knees with BMLs at baseline, most showed either no change (23.8%), only progressing (10.2%) or only regressing (38.9%) BMLs. The remaining knees had various combinations of stable, progressing and regressing lesions (fig 2).

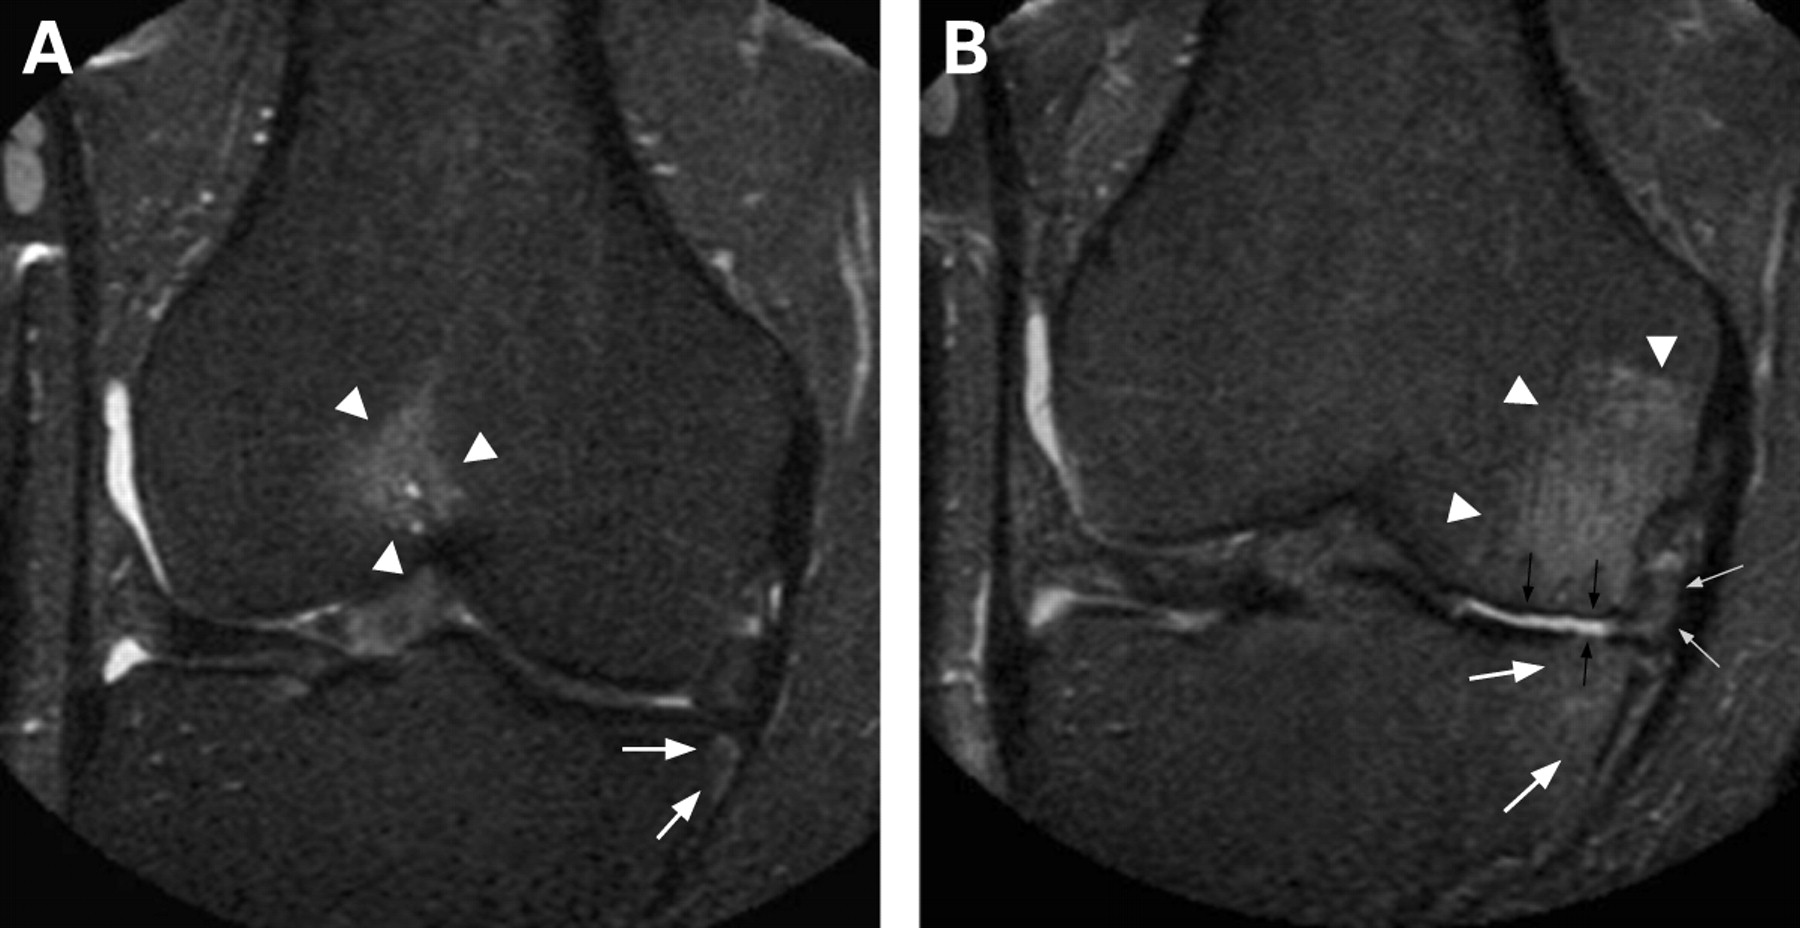
Example of changing bone marrow lesions (BMLs) from baseline to 30-month follow-up in the same knee. (A) Coronal STIR image. Prevalent BML anterior femur (arrowheads) and small BML medial tibia (arrows) at baseline examination. (B) Coronal STIR image. Resolution of anterior BML, large new BML medial femur (arrowheads) and volume-progressive BML medial tibia (white arrows) in the same knee. Note concomitant cartilage loss medial compartment (small black arrows) and progressive medial meniscal subluxation (small grey arrows).
Status of bone marrow lesion (BML) change from baseline to follow-up in knees with prevalent BMLs*
Association of change of BMLs and cartilage loss
The association of change from baseline to follow-up in a BML with cartilage loss in the same subregion at follow-up is shown in table 3. Stable BMLs are the reference group. A strong association between changes of BML size and changes in the adjacent cartilage was observed. The adjusted odds ratios for progressive cartilage loss in a subregion with prevalent BML at baseline were increased by 2.8 when the BML size increased from baseline to follow-up. The highest risk of cartilage loss was shown for the group with new BMLs at follow-up with an odds ratio of 3.5 in comparison with the stable BML subgroup. Subregions with regressing and resolving BMLs showed the same risk of cartilage loss as the reference group with stable BMLs. Complete absence of BMLs at baseline and follow-up appeared to be strongly related to a decreased risk of cartilage loss with an odds ratio of 0.2 in comparison with the reference group.
Bone marrow lesion and cartilage status in subregions at 30-month follow-up
Discussion
As far as we know, this study provides the first detailed longitudinal data from a large sample describing the natural history of individual BMLs in articular subregions, as well as at the level of the knee as a whole, and relates different types of longitudinal change in individual BMLs to the risk of cartilage loss in the same subregion of the articular surface. We found that over 30 months a substantial proportion of existing BMLs decreased in size (many resolving completely) while increase in size, including development of new BMLs, was also common. Most knees with prevalent BMLs at baseline showed either no change or changes in only one direction (increase or decrease), but a smaller proportion of knees simultaneously displayed combinations of stable, increasing and decreasing BMLs. In comparison with subregions with BMLs that were stable during the study, the risk of cartilage loss was substantially increased for enlarging or new BMLs. The risk of cartilage loss was substantially decreased when a subregion had no BMLs at both baseline and follow-up. Subregions in which BMLs decreased in size or resolved had the same risk of cartilage loss as those with stable BMLs.
Studying the natural history of BMLs, we found that 66% of the pre-existing BMLs showed a change in size over 30 months. This is a higher percentage than that obtained by the GARP study that reported change in only 24% of pre-existing BMLs when analysing individual lesions.11 In particular, we found that the proportion of baseline BMLs that decreased in size or disappeared (about 50%) was strikingly higher than previously reported.4,11 Hunter et al reported regression in only 0.6% of their subjects; one can only speculate on the reasons for this discrepant finding in comparison with our results. The subjects in the BOKS study had symptomatic knee OA, were predominantly male and older than our cohort. Cartilage scores were summed for the medial and lateral tibiofemoral compartments in the BOKS publication and it is not clear if compartmental analysis was also applied to BMLs or if individual lesions were assessed.
We also evaluated prevalence and changes over time in individual BMLs summarised over the whole knee. Although our sample was heterogeneous and included knees with and without OA, the proportion of knees with a BML at baseline (65%) was similar to that in studies of patients with symptomatic OA (57–75%), consistent with the high risk profile, including obesity, of our sample.4,11,12 We found that about one-quarter of knees with any BML at baseline simultaneously displayed combinations of stable, increasing and decreasing BMLs at follow-up. The importance of this finding remains unclear, but it lends support to the idea that BMLs are closely linked to highly localised biomechanical stresses and changes in the integrity of the adjacent cartilage.
This study confirms previous findings that prevalent subchondral lesions of the bone marrow are a predictor of cartilage loss.4,17 A cross-sectional MRI study found that higher grades of cartilage defects are associated with higher prevalence and larger size of adjacent subchondral BMLs.7 In comparison with subregions with stable BMLs, subregions with progressive and new BMLs showed a significantly higher risk of cartilage loss in the same subregion at follow-up MRI. Subregions with regression and resolution of BMLs exhibited the same risk of cartilage loss as the subregions with stable BMLs. One possible explanation for this finding is the relatively short follow-up interval. A longer observational period might clarify whether persistent regression of BMLs is associated with a lower risk of adjacent cartilage loss than size-stable lesions. Absence of BMLs at baseline and follow-up was associated with a decreased risk of cartilage loss.
As the main aim of the study was the structural relation between BMLs and adjacent cartilage over time we did not include data on pain or function. Felson and coworkers showed recently that development of knee pain is associated with an increase in BMLs as revealed on MRI.18 Whether or not regressing or resolving BMLs are associated with an improvement in pain or function remains to be shown.
Our study has a number of limitations that need mentioning.
Concerns have been raised that image quality of 1.0 T extremity systems might be inferior to commonly used 1.5 T or 3.0 T systems. For this reason a validation exercise was performed, which showed good agreement, sensitivity and specificity for cartilage and BML scoring. Thus, we believe that image quality in our study was adequate to obtain reliable readings.
As the main aim of our study was to assess change in BMLs and cartilage over time, the MRIs were not read blinded to time point. This might result in a slight tendency to read more change in comparison with a blinded reading. However, it has been shown that scoring without knowing the chronological sequence substantially decreases sensitivity in the detection of clinically relevant changes in comparison with scoring in chronological order.19,20 These studies showed that blinding to time point can lead to misclassification of the longitudinal change in a feature and that it may compromise the assessment of the relation of that feature and its outcome. However, we have to acknowledge that to date longitudinal OA studies comparing semiquantitative MRI assessment blinded and non-blinded to chronological order have not been carried out.
Unfortunately, semiquantitative MRI assessment of OA does not allow for separate assessment of two adjacent features such as BMLs and cartilage as both features are visualised within the same image and one feature cannot be blinded for the other.
It is difficult to prove that BMLs actually precede cartilage loss. We could prove a strong association between the new development of BMLs and cartilage loss at follow-up, but the chronological order of these structural changes remains unclear. Only repeated examinations with markedly shorter time intervals might ultimately answer these questions. Results of a recently published animal study investigating the development of cartilage defects in a small number of cruciate-deficient dogs suggest that newly developing cartilage defects are preceded by BMLs in the same subregions.21 Whether progressive cartilage loss predicts incident or progressive BMLs should be tested in future studies.
Previous studies have shown that the presence of BMLs may be associated with loading.4,8,22 We adjusted our analysis for BMI as one of the risk factors of structural OA progression. Malalignment is another important predictor of structural progression in OA, and in the BOKS study explained the association of progression of BMLs and cartilage loss. However, the direct subregional association of BML status at baseline and follow-up with cartilage status at follow-up will persist even when malalignment might be the actual trigger for progression.
Finally, there are radiological differential diagnoses for subchondral BMLs, the most common being traumatic bone contusion.23 Although histologically similar, bone contusions should be regarded as distinct from non-traumatic BMLs in conjunction with cartilage defects and OA.10,24 We excluded knees with unequivocal radiological differential diagnoses before analysis.
In summary, we found that subchondral BMLs, unlike cartilage, are a highly variable feature in patients with knee OA or at risk of developing it and that the majority of prevalent BMLs showed regression or resolution over time, which has not been reported before. Second, absence of BMLs was associated with a decreased risk of adjacent cartilage loss while subregions with new and progressive BMLs exhibited a high risk of cartilage loss at follow-up. Whether BML change might become a target for treatment remains to be shown but the underlying mechanical abnormalities such as knee mechanical alignment or meniscal pathology influencing cartilage loss and BMLs need to be fully understood.
Acknowledgments
We thank the participants and staff of the MOST study at the clinical sites in Birmingham, Alabama and Iowa City, Iowa and at the Coordinating Center at UCSF, San Francisco, California.
REFERENCES
Footnotes
Funding Supported by NIH grants from the National Institute of Aging to CEL (U01-AG-18947), JT (U01-AG-18832), MCN (U01-AG-19069) and DTF (U01-AG-18820).
Competing interests AG is president of Boston Imaging Core Lab, LLC (BICL), Boston, Massachusetts, USA, a company providing radiological image assessment services; and shareholder of Synarc Inc. FWR is vice president of BICL. None of the other authors have declared any conflict of interest.
Ethics approval The study was conducted in compliance with the ethical principles derived from the Declaration of Helsinki and in compliance with local institutional review boards, informed consent regulations and International Conference on Harmonization Good Clinical Practices Guidelines.