Article Text

Abstract
OBJECTIVES The three x ray assessors of the GRISAR study (blinded to treatment) gave consensual erosion and damage scores to the baseline and 12 month radiographs of 284 rheumatoid arthritis (RA) patients using three different methods: single readings (blinded as to patient and chronological sequence of the x rays), paired readings (blinded as to sequence), and chronologically ordered paired readings. The aim was to evaluate which of these reading procedures is the most appropriate for clinical trials.
METHODS The progression of the scores obtained using each procedure was compared by means of descriptive statistics, principal components analysis, and intra-patient correlation coefficients of pairs of methods. Bootstrap estimates of the variance of the difference in the means of two equally sized random samples were calculated to evaluate the power of the statistical analysis performed to assess the possible treatment effect for both paired and chronological reading methods.
RESULTS (a)The standard deviations of the paired and chronological readings were similar, but that of the single readings was higher. (b) The knowledge that two x rays were of the same patient accounted for a sizeable proportion of the between method variability. (c) Agreement was satisfactory between the paired and chronological methods for both scores but, between them and the single readings, it was modest for erosions and poor for damage. (d) The bootstrap estimate of the variance of the difference was smaller for the paired than the chronological method, possibly giving it greater power to test treatment effect.
CONCLUSIONS These results suggested that paired readings were the most suitable for evaluating the progression of joint damage in the GRISAR study.
- x ray assessment
- rheumatoid arthritis
- clinical trials
Statistics from Altmetric.com
Radiography has traditionally been considered the most objective measurement technique for assessing the severity and progression of rheumatoid arthritis (RA). Serial radiographs directly reflect the pathological process of the disease, provide a permanent record of films that may be collected and compared,1 and are readily available and inexpensive.
A number of issues need to be clarified when radiographs are used in clinical trials, and various limitations concerning their use in evaluating RA have been identified.2 ,3 Fine detail radiographs are essential 4 and, in prospective trials, these must be taken using the same projection and the same technique.
Radiographs of the feet may show greater damage than those of the hands5; other sources of variability could be disagreement over the interpretation of the various radiographic findings and the selection and use of scoring systems. In evaluating disease progression, it is desirable to use methods that are not only sufficiently detailed but also ‘user friendly’. This is underlined by the currently available systems,1 ,4 ,6-8 the most widely used are those of Sharp, which scores a number of hand and wrist joints on a graded scale for erosions and narrowing,1 and Larsen-Dale, which scores radiological appearance in comparison with a set of reference x rays.7
Both of these scoring systems have facilitated the discrimination of small changes in serial radiographs and been shown to be more sensitive to changes over time, given that the assessors are aware of the chronological sequence of the x rays. However, for a newly designed drug trial in which disease progression is to be measured prospectively in a large number of patients in whom the degree of progression could be different, the sensitivity of the scoring method may be outweighed by the time involved in scoring, so that a simple count of abnormal joints may be the main requirement.9
This study was based on the results obtained using the Larsen-Dale method, because the radiologists were highly experienced in its use, and it is recognised as being both quicker and easier than that of Sharp.10 ,11
Fries et al investigated as to whether films should be read separately or in pairs when a comparison over time is required, concluding in favour of paired readings.12 However, as far as we know, the possible differences between paired readings that are chronologically ordered and those that are not have never been investigated, nor has the impact that different reading procedures may have on the power requirements for clinical trials.
Evaluation of these aspects was thought to be an important issue of methodological concern when planning the GRISAR study and, with this in mind, the readers (FP, MC, LB), all of whom were always blinded as to trial treatment were asked to assess the same radiographs using each of the following procedures: (1) as single observations: the radiographs were randomly selected and assessed, the reader knowing neither the patient number nor the chronological sequence of the radiographs; (2) as paired observations: the reader was aware that he was assessing two radiographs of the same patient (baseline and after 12 months of treatment), but not their chronological sequence; (3) as chronological observations: the reader was also aware of the chronological sequence of the two radiographs for each patient.
The aim of this study was to compare the results obtained using these different procedures, to evaluate their performance from the viewpoint of assessing treatment efficacy in clinical trials.
Methods
A detailed account of the conduct and results of the GRISAR study has been published elsewhere.13 Three hundred and sixty one early rheumatoid patients, arthritis with a disease duration of between six months and four years, were enrolled in 32 Italian centres and randomised to be treated with cyclosporin A or conventional second line drugs (disease modifying antirheumatic drugs). Postero-anterior projections of their hands/wrists and frontal views of their feet were taken at baseline and after 12 months, using low sensitive, high definition industrial film without a reinforcing screen. The originalx rays were collected centrally and scored by each of three skeletal radiologists (FP, MC, LB) forming an independent committee, who were unaware of the clinical and laboratory findings, as well as of the administered treatment. The three radiologists had to reach a consensus agreement on the score to be given to each joint.
Using the validated Larsen-Dale method,7 ,11 ,14 the radiographs were evaluated in relation to a total of 32 joints: the wrists, metacarpophalangeal I–V, interphalangeal I and proximal interphalangeal II-V of the hands, and the interphalangeal I and metatarsophalangeal II–V of the feet. For the Larsen-Dale Damage Score (DS), each joint was compared with standard reference films and assigned a score ranging from 0 (normal) to 5 (mutilating changes); the other considered changes were soft tissue swelling and juxta-articular osteoporosis (1 point), as well as joint space narrowing, ankylosis, and malalignment (2–4 points). The scores of the 32 joints were added together (the score for each wrist being weighted by multiplying it by a factor of 5) and the total constituted the DS (0–200). For the Eroded Joint Count (EJC) , a count was made of the number of target joints with juxta-articular erosions (0–32). The progression over time of each score (PDS and PEJC, respectively), defined as the 12 month– baseline difference, was the response variable used in the trial.
STATISTICAL METHODS
The data collected from the intention to treat sample of 284 radiologically evaluated patients formed the basis for the analyses of this study, whose aim was to compare the three procedures used by the radiologists in assessing the results of the clinical trial. To this end, the random allocation of patients to the treatment arm appeared to be irrelevant and, consequently, the analyses were carried out on the PES or PDS values obtained from the single, paired, and chronological readings of each of the 284 patients.
Method comparison studies are routinely performed on diagnostic tests, and a number of papers dealing with the appropriate techniques for analysing this kind of data can be found in the statistical literature. However, these could not be applied in the present context because the measurement scale was ordinal, and so the linear model currently used to investigate functional and structural relations between two random variables15 could not be postulated. Consequently, an approach mainly founded on descriptive statistics was adopted: (a) simple data description; (b) principal component analysis (PCA); (c) the intrapatient correlation coefficients of pairs of reading procedures (single-paired, single-chronological, and paired-chronological); (d) and bootstrap estimates16 of the variance of the difference (θ) in the means of two equally sized (n=142) samples.
The object of the PCA was to take the three values of PES or PDS (xsj, xpj, xcj, s=single p=paired, c=chronological, j=1,2,...,284) for each patient and find combinations of these to produce mutually uncorrelated indices (z1j, z2j, z3j). This lack of correlation is an appealing feature because the indices are measuring different ‘dimensions’ in the data by contrasting the original xi(i=1, 2, 3) progression of the eroded joint count and damage scores (PEJC and PDS), and zi can give some precise suggestions for explaining the differences emerging from the three reading procedures. Moreover, the indices are also ordered so that z1 displays the largest, z2 the second largest, and z3 the smallest amount of variation.
Bootstrap estimates of the variance of the difference (θ) of the means of two equally sized (n=142) samples were obtained by generating 10 000 bootstrap replications from the empirical distribution of the m = 284 PEJC or PDS values from the paired reading procedure. The same process was applied to the m = 284 PEJC and PDS values obtained from the chronological readings. Comparison of the two variance estimates makes it possible to evaluate the reading procedures in terms of the power of the statistical analysis accomplished to assess the possible treatment effect.
Results
SIMPLE DATA DESCRIPTION
Table 1 gives the summary statistics of PEJC and PDS, regardless of the randomly allocated treatment. For both erosion and damage, the progression score averages obtained using the three reading procedures were in the same sequence (from low to high): paired, single, and chronological. The paired reading procedure had the smallest, and the single reading procedure the greatest standard deviation; in particular, the standard deviation of the PDS of the single readings was noticeably larger than that of the other two procedures, which appeared to be comparable.
Summary statistics for PEJC and PDS of the three reading procedures
Figures 1 and 2 show the histograms of the PEJC and PDS values obtained using the three reading methods.

Distribution of the progression of eroded joint count (PEJC) using the three radiograph reading methods (that is, single, paired, and chronological readings).

Distribution of the progression of damage score (PDS) using the three radiographic reading methods (that is, single, paired, and chronological readings).
PRINCIPAL COMPONENTS ANALYSIS (PCA)
Table 2 shows the results of the PCA.
Results of principal component analysis on PEJC and PDS
The first PC accounts for nearly three quarters of the total variability; the coefficients of the paired and chronological procedures are equal and slightly different from those of the single reading procedure. As they are all positive, the first PC could be interpreted as a ‘global time variation value’, as assessed by combining the information elicited by each of the three procedures.
The second PC accounts for respectively 17% and 21% of the total variability of PEJC and PDS; the coefficients of the paired and chronological procedures are quite similar and of opposite sign to those of the single reading method. Contrasting this last against the paired and chronological procedures, the second PC reflects the advantage that the readers were taking from the information that the radiographs belonged to the same patient.
Finally, the coefficients of the third PC for the single reading procedure were approximately null, whereas those of the other two procedures were quite similar in absolute terms but of opposite sign. Contrasting the paired and chronological reading procedures, this PC can be attributed to the knowledge of the x ray sequence; however, it only accounted for less than 10% of the total variability.
INTRAPATIENT CORRELATION COEFFICIENTS
Table 3 gives the intrapatient correlation coefficients of the three reading procedures. The agreement between the single reading procedure and the other two appeared to be modest for PEJC and poor for PDS, whereas the agreement between the paired and chronological readings was satisfactory.
Intrapatient correlation coefficients for PEJC (upper right half) and for PDS (lower left half): 95% confidence limits in brackets
BOOTSTRAP ESTIMATES
As expected, the averages of the 10 000 differences in the means of two samples of equal size (n1=n2=142)were null; the variances are given in table 4.
Bootstrap estimates of the variance of the difference in the means of two samples of equal size
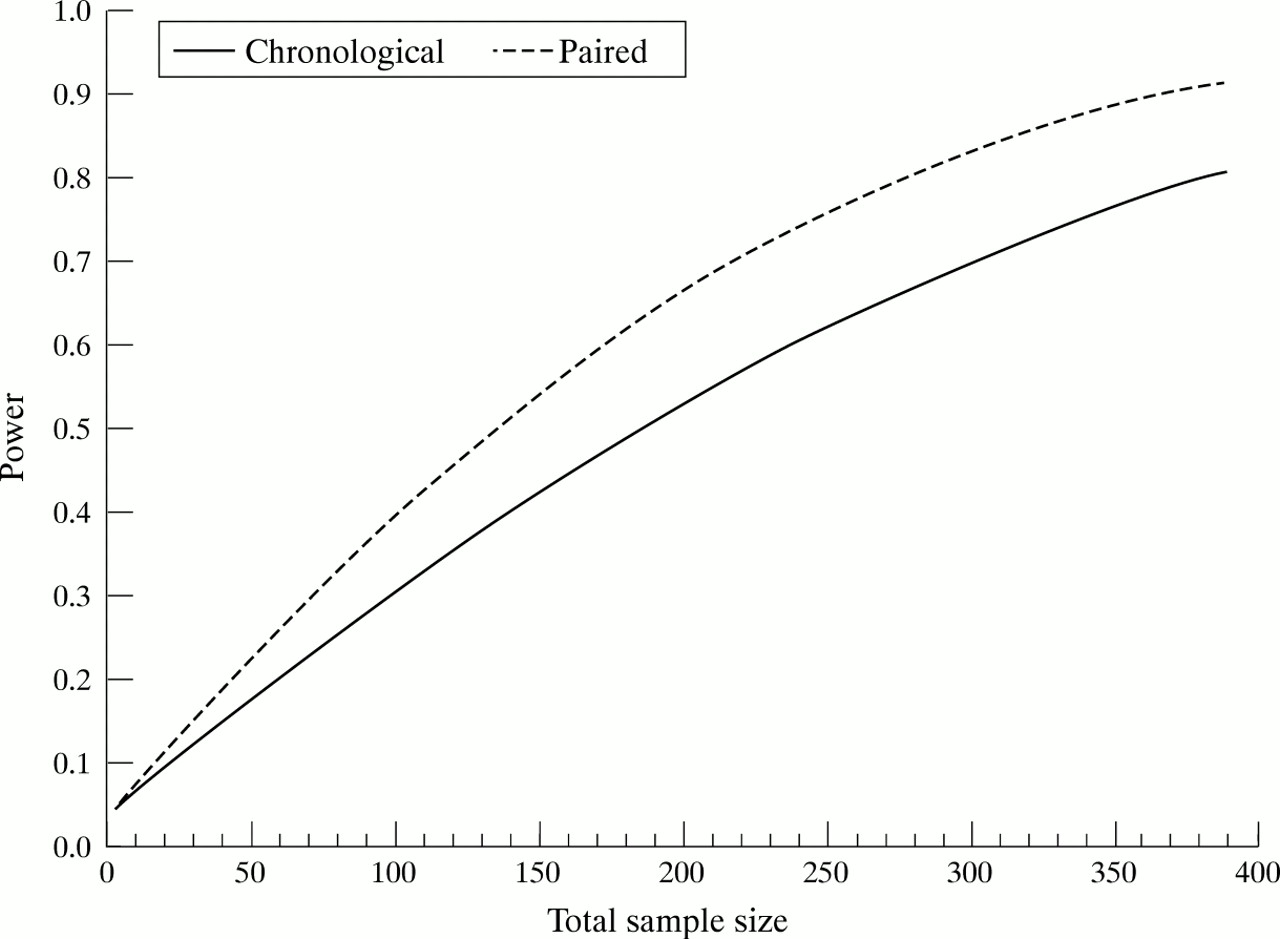
To be able to appreciate the difference between the paired and chronological reading procedures better, these variances were used to draw the power curves of the test suitable for comparing two treatment means against the total sample size. Figures 3 and 4 show the curves obtained, assuming a two tailed test with α=0.05 and a clinically relevant difference between the two treatments (δ) of at least 1 for PEJC and 3 for PDS.

Power curves of the test suitable for comparing two treatment means as a function of total sample size (m); α = 0.05 (two tailed test), difference of at least 1 in the progression of eroded joint count (PEJC).

Power curves of the test suitable for comparing two treatment means as a function of total sample size (m); α = 0.05 (two tailed test), difference of at least 3 in the progression of damage score (PDS).
For PEJC, the ratio between the sample sizes calculated using the chronological and paired reading procedures is constant and equals 1.385: that is, 38.5% more patients are needed with the chronological reading procedure to detect the same minimum relevant difference, regardless of the power. This value reflects the ratio of the variances of the two reading procedures. For PDS, the ratio equals 1.118, which means that 11.8% more patients are needed with the chronological reading procedure.
Discussion
Radiological assessment is an objective standard for evaluating joint damage progression in RA. Antirheumatic treatments are evaluated on the basis of their effectiveness in delaying radiological progression, as indicated by joint damage and erosions and expressed by means of the PDS and PEJC.
Fries et al 12 concluded that ‘averaging the scores of 3 or more readers greatly increases the reliability of progression scores’, thus highlighting the question of estimating reliable scores rather than that of inter-reader variability; our own procedure of requiring a single score for each joint agreed upon by the three radiologists is consistent with this. Furthermore, the radiologists scored the radiographs of the same patient in different sessions, each time using one of the three different procedures of single, paired, and chronological readings; therefore, any intra-reader variability would be confounded with between procedure variability.
In trying to quantify the erosion or damage emerging from two radiographs, the radiologists could take advantage of the knowledge that the two x rays belonged to the same patient as they moved from the single to the paired and to the chronological procedure. As the standard deviation of the paired and chronological readings was lower than that of the single reading procedure, the availability of this information reduced the between patient variability of both the PEJC and PDS measures (table 1). The results of the PCA show that there was an effect resulting from the introduction of the knowledge of the within subject x ray pairing, which accounted for a sizeable proportion of the variability and clearly distinguished the single reading procedure from the other two (table 2: second principal component). Furthermore, as is shown by the intrapatient correlation coefficients (table 3), the agreement between the single readings and both of the other procedures was modest for PEJC and poor for PDS. These findings consistently suggest that the single reading procedure can be considered less informative than either the paired or chronological procedure. The third principal component (table 2) showed that only about 10% of the variability was accounted for by the difference between the paired and chronological procedures. Moreover, as shown in table 3, the agreement between these two procedures appeared to be satisfactory (about 0.7 for both PEJC and PDS).
From the trialist point of view, a very important feature of response measurement tools is their precision, because this makes it possible to minimise the number of patients to be treated with the inferior treatment. Given the asymmetric and highly peaked distributions of the PEJC and PDS, a bootstrap procedure was used to obtain reliable estimates of the variances of the difference between the means of two equally sized samples. The results for both PEJC and PDS produced by the paired readings compared favourably with those obtained using chronologically plus ordered readings. Figures 3 and 4 make the difference between the two reading procedures easier to grasp in terms of sample size and the power of a test aimed at comparing the effect of two treatments. The curves given by the paired reading procedure were slightly but consistently above those given by the chronological procedure, thus indicating that the comparison of two treatments was more powerful with the first than with the second. All of these findings seem to favour paired readings as the most suitable procedure for generating PEJC and PDS values, and led to their adoption for the analysis of the GRISAR study.
Although it might be expected that having information on the time sequence of the two radiographs would enable the readers to make a more thorough assessment of the images, it can also be argued that having such information may introduce biases relating to the ‘a priori’ expectations of the readers concerning the natural course of the disease. However, this is a dilemma that remains to be solved.
References
Footnotes
↵* Gruppo Reumatologi Italiani Studio Artrite Reumatoide