Article Text

Abstract
Objective We investigated whether rheumatoid arthritis (RA)-related autoantibodies were associated with systemic inflammation in a prospective cohort of first-degree relatives (FDRs) of RA probands, a population without RA but at increased risk for its future development.
Methods We studied 44 autoantibody positive FDRs, of whom 29 were rheumatoid factor (RF) positive, 25 were positive for the high risk autoantibody profile (HRP), that is, positive for anti-cyclic citrullinated peptide and/or for at least two RF IgM, IgG or IgA isotypes, and nine FDRs who were positive for both; and 62 FDRs who were never autoantibody positive. Twenty-five cytokines/chemokines were measured using a bead-based assay in serum. As a comprehensive measure of inflammation, we calculated a Cytokine Score by summing all cytokine/chemokine levels, weighted by their regression coefficients for RA-autoantibody association. We compared C-reactive protein, individual cytokines/chemokines and Cytokine Score to the outcomes: positivity for RF and for the HRP using logistic regression.
Results Adjusting for age, sex, ethnicity and ever smoking, the Cytokine Score and levels of IL-6 and IL-9 were associated with both RF and HRP. IL-2, granulocyte macrophage-colony stimulating factor (GM-CSF), and interferon (IFN)-γ were associated with HRP only. Associations between the Cytokine Score and RF and HRP positivity were replicated in an independent military personnel cohort.
Conclusions In first-degree relatives of patients with RA, RA-related autoimmunity is associated with inflammation, as evidenced by associations with multiple cytokines and chemokines.
Statistics from Altmetric.com
Introduction
Rheumatoid arthritis (RA) is a chronic systemic inflammatory disease that leads to significant disability and reduced life expectancy.1 ,2 While the processes leading to the development of RA are not completely understood, multiple studies utilising retrospective databases and biobanks show RA-related autoantibodies as well as numerous other biomarkers (including cytokines/chemokines and C-reactive protein) are elevated in individuals years prior to the development of RA.3–13 Specifically, Jorgensen et al showed that IL-1α, -1β, -1ra, -4, -10, tumor necrosis factor (TNF)-α, and sTNFr1 are elevated only in the 5-year interval prior to an RA diagnosis.14 Additionally, Deane et al12 established that the number of elevated circulating cytokines and chemokines increased in the preclinical period of RA development, and that one could utilise this information to predict, in an age-dependent manner, the time period in which RA becomes clinically apparent and is diagnosed.
These findings indicate that there is a substantial period of autoimmunity and inflammation prior to the onset of clinically-apparent disease. In order to better understand this pre-clinical period of RA, additional information is needed regarding how these inflammation biomarkers associate with other preclinical markers of RA, such as autoantibodies, in a population without RA, but at risk for its future development.
To understand the relationships between circulating inflammation and RA-related autoimmunity, we evaluated first-degree relatives (FDRs) of probands with RA, who are at substantially increased risk for RA (3–9-fold) over the general population.15 ,16 Moreover, since specific cytokines and chemokines have not been convincingly implicated in preclinical RA development, we aggregated all 25 cytokines and chemokines into a single value, a Cytokine Score, in order to better reflect overall inflammation in preclinical RA and to evaluate its association with RA-related autoantibodies.
Methods
Studies of the Aetiology of Rheumatoid Arthritis
Studies of the Aetiology of Rheumatoid Arthritis (SERA) is a multi-centre study designed to examine the role of environmental and genetic factors in the development and progression of RA-related autoimmunity, and to explore preclinical immunological changes and pathophysiological processes in the absence of confounders such as treatments or secondary complications of active disease.17 The SERA cohort consists of FDRs (parent, sibling or offspring) of probands with RA, who are selected for prospective study because of increased RA risk.15 ,16 FDRs are recruited through probands (identified from academic centres, Veterans’ hospitals and rheumatology clinics) or through responses to advertising, and are unique in that they have not accessed the healthcare system for RA-related complaints. FDRs are eligible to participate if they do not have an RA diagnosis at the time of their initial visit, as defined by 1987 American College of Rheumatology (ACR) Criteria,18 and are ≥18-year-old. At research visits, FDRs complete disease and exposure assessment questionnaires, undergo a standardised interview and 68-count joint examination by a trained study physician or nurse, and have blood drawn. FDRs positive for any RA-related autoantibody at any visit are seen annually, and autoantibody negative FDRs are seen biennially.
Measurement of autoantibodies
All samples were tested for rheumatoid factor (RF), RF isotypes RF-IgM, -IgG and -IgA and anti-cyclic citrullinated peptide (anti-CCP2) autoantibody. RF (IU/ml) was measured by nephelometry using the Dade Behring BN100 system. RF isotypes IgM, IgG, and IgA (IU/ml) were measured using ELISA (Quanta Lite) kits to manufacturer's specifications (INOVA Diagnostics, Inc, San Diego, California, USA); anti-CCP2 (U/ml) was measured using anti-CCP2 ELISA assay (Diastat, Axis-Shield Diagnostics, Ltd., Dundee, Scotland, UK). A dichotomous cut-off for each RF assay was established according to 1987 ACR RA criteria specifying a ‘positive’ RF if present in <5% of control subjects, by determining a <5% cut-off in 491 blood donor controls, separate from the SERA FDR population.18 Anti-CCP2 was considered positive if greater than the kit cut-off of 5 U/ml, which corresponded to a <2% cut-off in the same 491 blood donor controls.
Definition of autoantibody phenotype
In our current population, too few FDRs with anti-CCP2 positivity (n=8) prevented analysing anti-CCP2 positivity as an outcome. However, we and others have found a high risk autoantibody profile (HRP), which includes positivity for anti-CCP2 and/or two or more RF isotypes, has improved sensitivity for future RA over anti-CCP2 alone (perhaps due to earlier appearance of RF isotypes in the preclinical period, and RA ie, CCP2 negative).8 ,9 ,19–21 This profile also has high specificity (>96%) for future RA onset.8 ,9 ,12 ,19–21 Therefore, to increase the number of FDRs with an autoantibody profile present in a greater number of subjects than anti-CCP2 alone, yet still maintain high specificity for future disease, we utilised the HRP as an autoantibody phenotype. A second autoantibody phenotype that we examined was RF positivity by nephelometry.
Study population
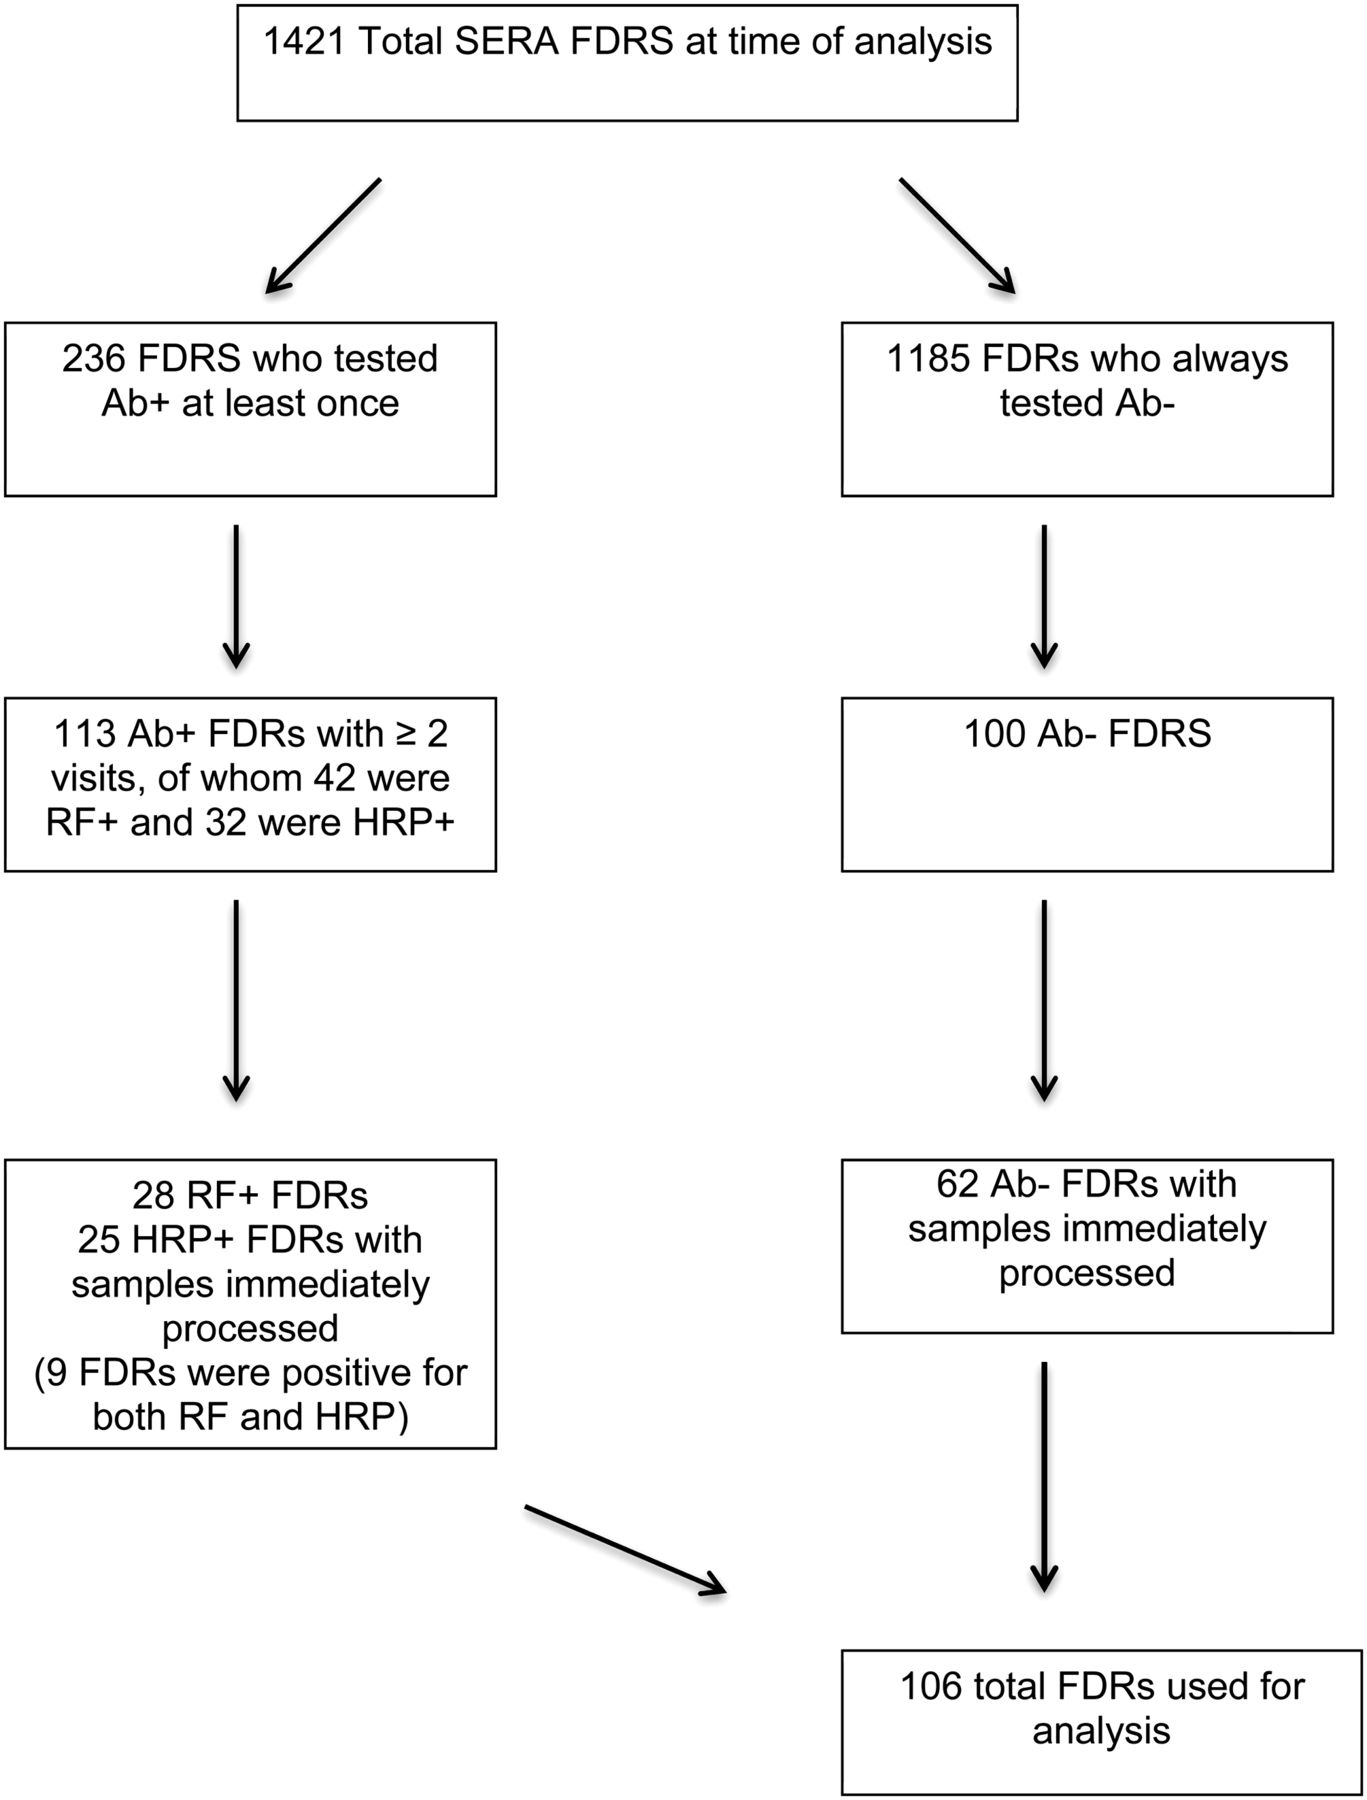
At the time of this analysis, 1421 FDRs had been seen at least once for SERA (figure 1). From this cohort, 236 had been positive for any of five RA-associated autoantibodies on at least one visit. Of these, we selected 113 autoantibody positive FDRs who had completed two or more study visits, 28 of these FDRs were RF+, 25 were HRP+, with nine FDRs positive for both RF and HRP. We also selected 100 FDRs who had never been autoantibody positive at any visit, frequency matched to the 113 autoantibody positive FDRs on age, sex and ethnicity. In 32% of the FDR visits, blood was shipped overnight on ice, and processed approximately 20–30 h after blood was drawn. Concerned that delay in blood processing may result in variation in cytokine/chemokine levels, we limited our analyses to only those samples that were processed immediately. Therefore, our analysis population was limited to 28 RF+ FDRs, 25 HRP+ FDRs (with 9 positive for both) and 62 FDRs who were negative for all autoantibodies (a total of 106 FDRs). Cytokines/chemokine levels at the first positive visit of the RF+ and HRP+ FDRs were compared with levels in the autoantibody negative FDRs in this cross-sectional analysis.
Selection of study population. FDR, firstdegree relatives; HRP, high risk autoantibody profile; RF, rheumatoid factor; SERA, Studies of the Aetiology of Rheumatoid Arthritis.
Measurement of C-reactive protein, cytokines and chemokines
Serum samples from the first RF and HRP positive visit in the autoantibody positive FDRs and the selected visit in the autoantibody negative FDRs were tested for high sensitivity C-reactive protein (hsCRP, mg/l) and 25 RA-associated cytokines and chemokines (listed in table 3). hsCRP was tested by a nephelometric assay (BN II Nephelometer, Dade Behring, Deerfield, Illinois, USA); and cytokines/chemokines were tested using a bead-based multiplex assay (Beadlyte kit, Upstate, Charlottesville, Virginia, USA), the Luminex xMAP 100IS platform (Luminex, Austin, Texas, USA), and a BioPlex array reader (Bio-rad Laboratories, Hercules, California, USA) with Luminex fluorescent bead technology.
Quantitative levels of cytokines were determined by comparison to standard curves (pcg/ml). Additionally, as RF-IgM may cause false-positive results in this bead-based assay by crosslinking the capture and detection antibodies, Heteroblock reagent (Omega Biologicals Inc., Bozeman, Montana, USA) was used in all samples (3 μg/ml of serum) to minimise the effect of RF.22 Due to recent reports describing use of higher Heteroblock concentrations,23 ,24 additional validation studies using a higher Heteroblock concentration (50 μg/ml of serum) were performed, and produced similar results to those reported herein. Validation of this bead-based assay for determination of cytokine levels in inflammatory joint disease has been performed against ELISA assays for individual cytokines in prior studies and values have been found to be highly correlated.25 ,26
Creation and validation of the Cytokine Score
The rationale behind the Cytokine Score is to assign a single value indicating the level of overall inflammation, determined by the cumulative contribution of 25 individual cytokines/chemokines, in relationship to autoantibody elevations. This has some similarities to the weighted genetic risk score, which quantifies the risk for disease attributed to the cumulative effect of multiple risk alleles. Instead of summing the number of risk alleles into a single score while weighting alleles by their association with the phenotype (for the weighted genetic risk score), to create the Cytokine Score, we summed levels of 25 cytokines/chemokines while weighting them by their association with the number of positive RA-related autoantibodies. Specifically, we first log-transformed and standardised (by using the SD) all 25 cytokines/chemokines. Then, we took the regression coefficients of each cytokine and chemokine generated from a linear regression model that tested associations between the number of positive autoantibodies (dependent variable) and all cytokines/chemokines in the same model (independent variables), and used them as weights. The transformed and standardised cytokine/chemokine levels were weighted by these respective regression coefficients and summed for a total Cytokine Score. By generating these weights, the cytokines or chemokines that explained the most variance in their association with the number of autoantibodies contributed most to the score and therefore the overall level of inflammation, or the Cytokine Score.
To validate the Cytokine Score, we created a test sample as well as a validation sample. We calculated the Cytokine Score in a randomly selected half (n=53) of the total number of observations (n=106) (the test sample).27 ,28 We then applied the regression coefficients from the regression model calculated from the test sample to the remaining half (n=53) (validation sample), and compared coefficients of multiple determination, R2=Sum of Squares Model / Sum of Squares Total, which provides the proportion of variability in the number of autoantibodies explained by the Cytokine Score and subjects. From these values for R2, we were able to apply a Fisher's z transformation to calculate the CI for each model's R2 value. Therefore, R2test=0.74 (95% CI 0.591 to 0.842) and R2validation=0.30 (95% CI 0.031 to 0.526), which indicates that the Cytokine Score, which explained 59%–84% of the variation in our test sample, continued to explain 3%–53% of the variation in the validation sample (table 1 ).
Validation of the Cytokine Score
Statistical analysis
We examined associations of hsCRP, individual cytokines/chemokines, and the Cytokine Score with (1) presence of RF and (2) presence of HRP. All analyses were conducted in SAS (SAS V.9.2, Cary, North Carolina, USA).29 To present descriptive characteristics of FDRs by RF and HRP status, we compared data using t-tests for means and χ2 tests for proportions (table 2). We further described (through medians, means, and SD) hsCRP, individual cytokines/chemokines, and the Cytokine Score by both RF status (table 3) and HRP status (table 4). All cytokines and chemokines were log-transformed to approximate a Gaussian distribution, prior to statistical analysis. Relationships between cytokines/chemokines (as predictors) and RA-related autoantibodies (as outcomes) were calculated using a logistic regression model. Results are reported as OR, which were calculated to indicate the change in risk for RA-related autoimmunity for a SD increase in cytokine or chemokine level, or a unit increase in hsCRP or Cytokine Score. All multivariate analyses were adjusted for age, sex, ethnicity and ever smoking.
Descriptive characteristics of FDRs by RF and HRP positivity in FDRs from the Studies of the Aetiology of Rheumatology (SERA) cohort
Association between Markers of Inflammation and RF Positivity in FDRs from the Studies of the Aetiology of Rheumatoid Arthritis (SERA) Cohort
Association between markers of inflammation and HRP positivity in FDRs from the Studies of the Aetiology of Rheumatoid Arthritis (SERA) Cohort
Replication of the Cytokine Score
To replicate the Cytokine Score in an independent population, we measured the same panel of 25 cytokines/chemokines described above, in a population consisting of military personnel, described previously by Deane and others.12 We selected pre-diagnosis samples from 82 military subjects who developed RA, and 82 military subjects who did not develop RA, matched on age at diagnosis, sex, ethnicity, duration of sample storage, number of samples available and geographic region of recruitment to the military. Utilising the methods described above, we summed each cytokine and chemokine with their respective weights in order to create a single Cytokine Score for each sample.
The associations between the Cytokine Score (as a predictor) and RF and HRP positivity (as outcomes) were tested using a logistic regression model. Results are reported as OR, to indicate the change in risk for RA-related autoimmunity for every unit increase in Cytokine Score, adjusting for age, sex and ethnicity.
Results
Demographic characteristics of study population
Twenty-eight FDRs were positive for RF and 25 were positive for HRP; nine FDRs within these 28 RF+ and 25 HRP+ FDRs were positive for both phenotypes (table 2). There were no significant differences by autoantibody status.
Associations between RF and markers of inflammation
Table 3 describes non-log transformed hsCRP, individual cytokines and chemokines, and the Cytokine Score in the 29 RF+ FDRs and the 78 RF− FDRs. The OR indicates the association between RF status and each of the log-transformed cytokines and chemokines, while adjusting for age, sex, ethnicity and ever smoking. RF+ FDRs were 1.9 times as likely to have higher levels of IL-6 and 2.3 times as likely to have higher levels of IL-9 than RF− FDRs. The Cytokine Score, a measure of overall inflammation, was strongly associated with RF positivity (OR 5.67, 95% CI 2.64 to 12.17).
Associations between HRP and markers of inflammation
Table 4 describes non-transformed hsCRP, individual cytokines and chemokines, and the Cytokine Score in the 25 HRP+ FDRs and the 81 HRP− FDRs. Of the five cytokines/chemokines associated with HRP+, IL-6 and IL-9 demonstrated the strongest associations, where HRP+ FDRs were three times as likely to have higher IL-6 and IL-9 than FDRs who were HRP−. The Cytokine Score was strongly associated with HRP positivity (OR 7.67, 95% CI 3.23 to 18.19).
Replication of Cytokine Score associations
In order to evaluate the association of the Cytokine Score with RF and HRP in an independent population, we calculated the Cytokine Score using the same panel of cytokines in samples from a previously described military cohort.12 The mean Cytokine Score for RF+ subjects at their first RF+ visit was 2.66 (±1.4) vs 0.86 (±0.78) in RF− subjects; and was 2.32 (±1.39) in HRP+ subjects at their first HRP+ visit compared to 0.77 (±0.73) in HRP− subjects (table 5). In this military cohort, RF+ subjects were 7.2 times more likely to have a unit increase in Cytokine Score than RF− subjects; and HRP+ subjects were 5.3 times more likely to have a unit increase Cytokine Score than HRP− subjects.
Cytokine Score replication study: associations between Cytokine Score and RF and HRP positivity in samples from a military cohort
Discussion
Higher levels of multiple cytokines and chemokines are associated with RA-related autoantibody positivity in FDRs without clinically-apparent RA. Through the creation, validation and replication of the Cytokine Score, we were able to combine the cytokines and chemokines into a single measure of overall inflammation, and demonstrate that RF and the HRP are associated with overall circulating inflammation.
We observed consistently significant associations of IL-6 and IL-9, with both RF and HRP, and these cytokines constituted the two heaviest positive weights (ie, regression coefficients) in the Cytokine Score. Previous clinical studies have reported significant associations of IL-6 and IL-9 with the development of RA, as these two cytokines, along with others, are elevated in RA30 and are upregulated prior to the onset of RA.12–14 Our study is consistent with these findings, and extends them by demonstrating that these cytokines, and potentially their common pathway, the Th17 pathway,31 are associated with both RF and HRP in an at-risk population without clinically apparent RA. Previous studies hypothesised that elevations in autoantibodies constituted the earliest biomarker changes,12 ,13 followed by elevated cytokines and chemokines. Our findings, however, indicate that even in this earliest period of RA-related autoimmunity, there is still systemic inflammation.
IL-2, GM-CSF, and IFN-γ were significantly associated with HRP, but not with RF, suggesting that these inflammatory markers may indicate a later or more specific stage in RA-related autoimmunity.12 The lack of associations between either RF or HRP and hsCRP, suggests that cytokines and chemokines may add information about early autoimmune period beyond hsCRP.
The purpose of creating the Cytokine Score was to indicate an overall level of systemic inflammation, serving a similar purpose as the ‘cytokine count,’12 without requiring cut-offs for each cytokine/chemokine to establish positivity. Due to inaccessibility to appropriate samples from healthy controls, we were unable to establish cut-offs for cytokine/chemokine positivity. However, our Cytokine Score has strengths over the cytokine count approach in that it weights most heavily cytokines/chemokines that have the strongest associations with an increasing number of RA-related autoantibodies, thus providing more of a gradient value for the assessment of systemic inflammation than a count. Finally, the Cytokine Score allows the evaluation of systemic inflammation in populations with unknown cut-offs for cytokine positivity, such as ours, and further allows comparisons of systemic inflammation among various studies. We successfully reproduced our findings in pre-RA diagnosis samples from a military cohort that had transitioned to RA, thus supporting our use of this score in populations who do not have RA, but may go on to develop it.
We did not use a population control group, due to the inaccessibility of appropriate samples. Instead we utilised Ab- FDRs as our comparison group, which has many methodological advantages, including the comparability of data acquisition and blood processing, and the lack of selection biases that limit studies using external control groups. Since we were unable to define positivity, we analysed cytokines/chemokines as continuous variables, which allowed us to observe potentially more subtle relationships between these and RA-related autoantibodies, which may be more appropriate in individuals without clinically-apparent disease.
Another consideration is that our study population has yet to progress to RA. While this is an unknown, we have the opportunity to screen and follow an at-risk population from a state where there is no autoantibody positivity, to states with autoimmunity and symptom development. At the time we selected samples for cytokine/chemokine analysis, the 2010 ACR/European League Against Rheumatism (EULAR) classification criteria had not been published.32 ,33 However, later applying these criteria to our selected population, there were two FDRs who received a score of ≥6 at the time of their visit, suggesting that they met the EULAR criteria for definite RA.34 The ability to prospectively follow our subjects allows us to better understand processes leading to disease onset, and will allow us to potentially predict the onset of disease as we can utilise the combination of RA-related autoantibodies, inflammatory markers, clinical signs and markers of genetic risk in our FDRs. Further, our population was selected from an at-risk population, meaning that their genetic risk for RA predisposes them to RA by 2%–3%, which allows us to maximise the proportion of the study population that goes go on to disease compared with a screened general population.
Conclusion
In first-degree relatives of patients with RA, we have demonstrated the association between RA-related autoantibodies and circulating cytokine and chemokine biomarkers of inflammation.
References
Footnotes
-
Contributors JMH contributed to the concept and design, analysis plan, cleaned and analysed the data, drafted and revised the paper; KDD and VMH contributed to the concept and design, analysis plan, drafting and revision of the paper; LAD contributed to the concept and design, monitored data collection and cleaned and assembled the data; GOZ contributed to the analysis plan, supervised data analysis, and revised the paper; JS and LJL contributed to the assay design and interpretation and revised the drafted paper; JRK, MHW, JHB, TRM, JRO, RMK, and PKG contributed to the concept and design and revised the drafted paper; WHR created the assay, contributed to the concept and design, and revised the drafted paper; JMN contributed to the concept and design, analysis plan, supervision of data analysis and draft and revision of the paper. All authors approved the submitted version of this paper.
-
Funding Funding for this research was made possible by grants from the NIAMS (R01 AR051394) and NIAID (Autoimmunity Prevention Center U19 AI050864), the ACR Research and Education Foundation Within Our Reach: Finding a Cure for Rheumatoid Arthritis campaign (II-T-11-14), and the Walter S. and Lucienne Driskill Foundation.
-
Competing interests A patent application that includes Drs. Deane, Robinson and Holers has been filed for the use of biomarkers to predict clinically actionable events in rheumatoid arthritis. In addition, licensing agreements regarding the use of biomarkers have been established.
-
Patient consent Obtained.
-
Ethics approval Colorado Multiple Institutional Review Board.
-
Provenance and peer review Not commissioned; externally peer reviewed.