Article Text

Abstract
Objectives Epigenetics can influence disease susceptibility and severity. While DNA methylation of individual genes has been explored in autoimmunity, no unbiased systematic analyses have been reported. Therefore, a genome-wide evaluation of DNA methylation loci in fibroblast-like synoviocytes (FLS) isolated from the site of disease in rheumatoid arthritis (RA) was performed.
Methods Genomic DNA was isolated from six RA and five osteoarthritis (OA) FLS lines and evaluated using the Illumina HumanMethylation450 chip. Cluster analysis of data was performed and corrected using Benjamini–Hochberg adjustment for multiple comparisons. Methylation was confirmed by pyrosequencing and gene expression was determined by qPCR. Pathway analysis was performed using the Kyoto Encyclopedia of Genes and Genomes.
Results RA and control FLS segregated based on DNA methylation, with 1859 differentially methylated loci. Hypomethylated loci were identified in key genes relevant to RA, such as CHI3L1, CASP1, STAT3, MAP3K5, MEFV and WISP3. Hypermethylation was also observed, including TGFBR2 and FOXO1. Hypomethylation of individual genes was associated with increased gene expression. Grouped analysis identified 207 hypermethylated or hypomethylated genes with multiple differentially methylated loci, including COL1A1, MEFV and TNF. Hypomethylation was increased in multiple pathways related to cell migration, including focal adhesion, cell adhesion, transendothelial migration and extracellular matrix interactions. Confirmatory studies with OA and normal FLS also demonstrated segregation of RA from control FLS based on methylation pattern.
Conclusions Differentially methylated genes could alter FLS gene expression and contribute to the pathogenesis of RA. DNA methylation of critical genes suggests that RA FLS are imprinted and implicate epigenetic contributions to inflammatory arthritis.
Statistics from Altmetric.com
Introduction
Rheumatoid arthritis (RA) is an immune-mediated disease marked by symmetric inflammation in diarthrodial joints and destruction of the extracellular matrix. Genomics has rapidly advanced our understanding of susceptibility and severity of RA, and many associated polymorphisms in key genes have been described. However, identical twins have a concordance rate of 12%–15%1 ,2 suggesting that epigenetic influences can affect either the onset or progression of disease. One of the most widely studied epigenetic mechanisms is DNA methylation, which plays a key role regulating gene expression and could potentially contribute to immune dysregulation.3 ,4
Fibroblast-like synoviocytes (FLS) form the synovial intimal lining of joints and play an integral role in RA by producing key cytokines, small molecule mediators and proteases.5 Rheumatoid FLS exhibit a unique aggressive phenotype that could contribute to the cytokine milieu and joint destruction. Recent data in a severe combined immunodeficiency (SCID) mouse model show that RA synoviocytes can migrate between joints, thereby serving as a mechanism that spreads the RA phenotype and cartilage damage to distant sites.6
The mechanism of the aggressive rheumatoid phenotype is uncertain, although several studies implicate abnormal tumour suppressor gene structure and function.7 An alternative explanation is that differential DNA methylation might alter gene expression and synoviocyte function. To address this question, we evaluated DNA methylation patterns in RA FLS and compared them with FLS derived from individuals with non-inflammatory joint disease. The data show that the RA FLS display a DNA methylome signature that distinguishes them from osteoarthritis (OA) and normal FLS, with differentially methylated (DM) genes that are critical to cell trafficking, inflammation and cell–extracellular matrix interactions.
Methods
FLS and patient phenotype
FLS were isolated from synovial tissues obtained from female RA and OA patients at the time of joint replacement as described previously.8 The mean ages of RA and OA patients were 53±9 and 68±16, respectively. Clinical information on four patients (two RA and two OA) was limited because the samples were de-identified. The erythrocyte sedimentation rates for the remaining RA and OA patients were 38±15 and 19±10, respectively. Of the four RA patients with clinical information, three were seropositive for serum rheumatoid factor and/or anti-cyclic citrullinated peptide antibody. Four were treated with low dose prednisone, two with methotrexate, two with a tumour necrosis factor (TNF) blocker and one with leflunomide. OA patients were treated with acetaminophin and narcotics for pain. Confirmatory studies were performed with an additional five RA, six OA and six normal FLS lines. Normal FLS were obtained from the San Diego Tissue Bank.
Isolation of genomic DNA and qPCR analysis
Fifth passage FLS were grown to 80% confluence and harvested. Genomic DNA of 106 FLS was isolated using the MagMAX DNA Multi-Sample Kit (Applied Biosystems, Foster City, California, USA). mRNA from cultured FLS was isolated using RNA-STAT (Tel-test, Friendswood, Texas, USA). OD 260/280 was routinely ∼2.0. cDNA was prepared from 1 µg of total RNA and qPCR was performed with TaqMan reagents (Life Technologies, Carlsbad, California, USA). Gene Ct values were normalised to glyceraldehyde 3-phosphate dehydrogenase expression using a standard curve methodology to obtain relative cell equivalents, as previously described.9
Infinium HumanMethylation450 BeadChip analysis
The Infinium HumanMethylation450 BeadChip was processed as described by the manufacturer (Illumina, San Diego, California, USA). This chip covers 96% of RefSeq genes and provides comprehensive gene region coverage, targeting multiple sites with promoter, 5′ UTR (untranslated region), 1st exon, gene body and 3′ UTR. The methylation level of a locus was measured as β=M/(U+M+100) where M was the fluorescence level of the methylation probe and U was the methylation level of the unmethylated probe. A constant value of 100 was added as a pseudocount to prevent division by a small number (or 0) for background subtraction. The β values vary from 0 (no unmethylation) to 1 (100% methylation). To measure the difference in methylation at a locus between OA and RA, the average β levels were compared as described in the Results section.
Pyrosequencing
Sodium bisulphite modification of genomic DNA was performed with the Epitect bisulphite kit (Qiagen, Valencia, California, USA). The primers for PCR amplification and sequencing were designed using PyroMark (Qiagen) assay design SW 2.0. PCR was performed with biotinylated primers to convert the PCR product to single-stranded DNA templates. Pyrosequencing reactions and methylation quantification were performed by the Stanford Protein and Nucleic Acid Facility (http://pan.stanford.edu). The following loci were evaluated: TNF (chr6:31543300, 31543289), FERMT3 (chr11:63974123, 63974131, 63974162), ITGA4 (chr2:182321373, 182321354), MYEF2 (chr15:48470794, 48470754), SYNJ2 (chr6:158404121, 158404061) and CHI3L1 (chr1:203156625).
Enrichment of multiple methylated loci
DM loci were ranked by their individual corrected p values (see Results section for statistical methods). For each gene associated with loci where p was less than 0.05, relative methylation was calculated as its enrichment factor (EF).
For enriched genes (EF>1), a p value for the level of enrichment was calculated using the hypergeometric distribution. The resulting p values were adjusted with the Benjamini–Hochberg correction. If a gene was enriched at multiple loci DM levels then only the level with the lowest enrichment p value was reported.
Pathway and GO analyses
Pathway enrichment analysis was carried out for genes with DM using the Kyoto Encyclopedia of Genes and Genomes (KEGG) human pathways and modules (www.genome.jp/kegg/download). The resulting p values were adjusted with the Benjamini–Hochberg correction. As the KEGG pathways represent groups of related bimolecular pathways, a p value cut-off of <0.1 was used as previously described.10 ,11 Gene ontology (GO) analysis was carried using human GO term associations (www.geneontology.org). GO term enrichment analysis was carried out using model-based gene set analysis which uses probabilistic inference to identify the active GO terms.12 Marginal probability values >0.50 were considered significant.
Evaluation of confirmatory cell lines
To assess the predicative capability of the original 11 RA/OA FLS lines on the new 11 RA/OA FLS lines, an support vector machine (SVM) model was trained on the original data using the 20 differentially methylated loci (DML) with the most significant p values and classified the new lines using R (http://www.R-project.org/). The SVM model used the default radial basis kernel with the following parameters: cost=8 and γ=1/64. The 1859 DML were then ranked based on the similarity of the two RA outliers to the average methylation frequency of the original six RA FLS lines and their dissimilarity to the average methylation frequency of the original five OA FLS lines. The DML were ranked and the top 20 DML were selected for hierarchical clustering. To assess the predictive capability of these 20 DML in all 28 RA/OA/normal FLS lines, an SVM model was trained using these 20 DML via twofold cross validation. Twofold cross validation was repeated 100 times to adequately sample various training and test dataset combinations. The SVM accuracy, sensitivity and specificity statistics were determined by counting the number of test cases where an RA sample was classified as RA/non-RA (ie, OA or normal) and the number of the cases where a non-RA sample was classified as RA/non-RA.
Results
Initial probe and data filtering
The Infinium HumanMethylation450 BeadChip (Illumina, Inc.) was used to determine the methylation status of 485 512 loci from FLS isolated from 11 patients at the time of total joint replacement surgery (six RA; five OA). Loci were removed from subsequent analysis if any of the probes for a locus could not be disguised from background with a p value <0.01 or if not enough beads were present upon the chip for accurate measurement of their methylation level. After filtering, 476 331 loci were available for further analysis.
Global methylation status
To assess global methylation status of RA and OA FLS, the methylation scores over all filtered loci within a sample were summed. The difference between the two samples was assessed using Student t test. Initial analysis included all loci and was then repeated for only loci located in promoters. Overall, global hypermethylation or hypomethylation in RA FLS was not observed in the loci evaluated by the Illumina chip (p values 0.528 and 0.627, respectively). This observation was confirmed by evaluating LINE-1 methylation using pyrosequencing to quantify global methylation status.13 LINE-1 methylation was 70.2±0.62% in the RA and 70.9±0.13% in OA FLS (p>0.10).
Analysis of DM individual loci
Although global methylation was not different for RA and OA in the array, DM loci clustered to the two populations. To identify the autosomal loci that are DM between OA and RA, two filters were used: (i) an average difference in methylation level was greater than 0.1 and (ii) a p value <0.05 calculated using the Student t test and corrected for multiple testing with the Benjamini–Hochberg adjustment. A total of 1859 loci in 1206 different genes (732 of which were hypomethylated and 1127 which were hypermethylated) were identified as significantly DM in RA FLS (table 1). Examples of key individual loci are shown in table 2 and the complete list of 1859 loci is shown in supplementary online table S1. Many of the DM loci are associated with genes that have relevance to joint architecture and inflammation. For example, CHI3L1 is a cartilage specific antigen, also known as gp39, which is the target for autoimmunity in RA. STAT3 is a key signalling protein that is activated in RA and is associated with interleukin (IL)-6 function. TNF signalling (TRAF2), IL-1 regulation (caspase 1) and purinoreceptors were also hypomethylated in RA.
Number of hypermethylated and hypomethylated sites
Examples of genes with individual differentially methylated loci
Permutation analysis was carried out to assess the significance of loci identified as DM. The 11 samples were randomly assigned to OA and RA while maintaining the same number of OA and RA labels, that is, five OA and six RA. The permutation analysis was repeated 1000 times. The average number of significant loci during the permutation analysis was 4.9, compared with 1859 for the correct disease identification. The permutation analysis strongly supports these loci as DM and not a result of random chance.
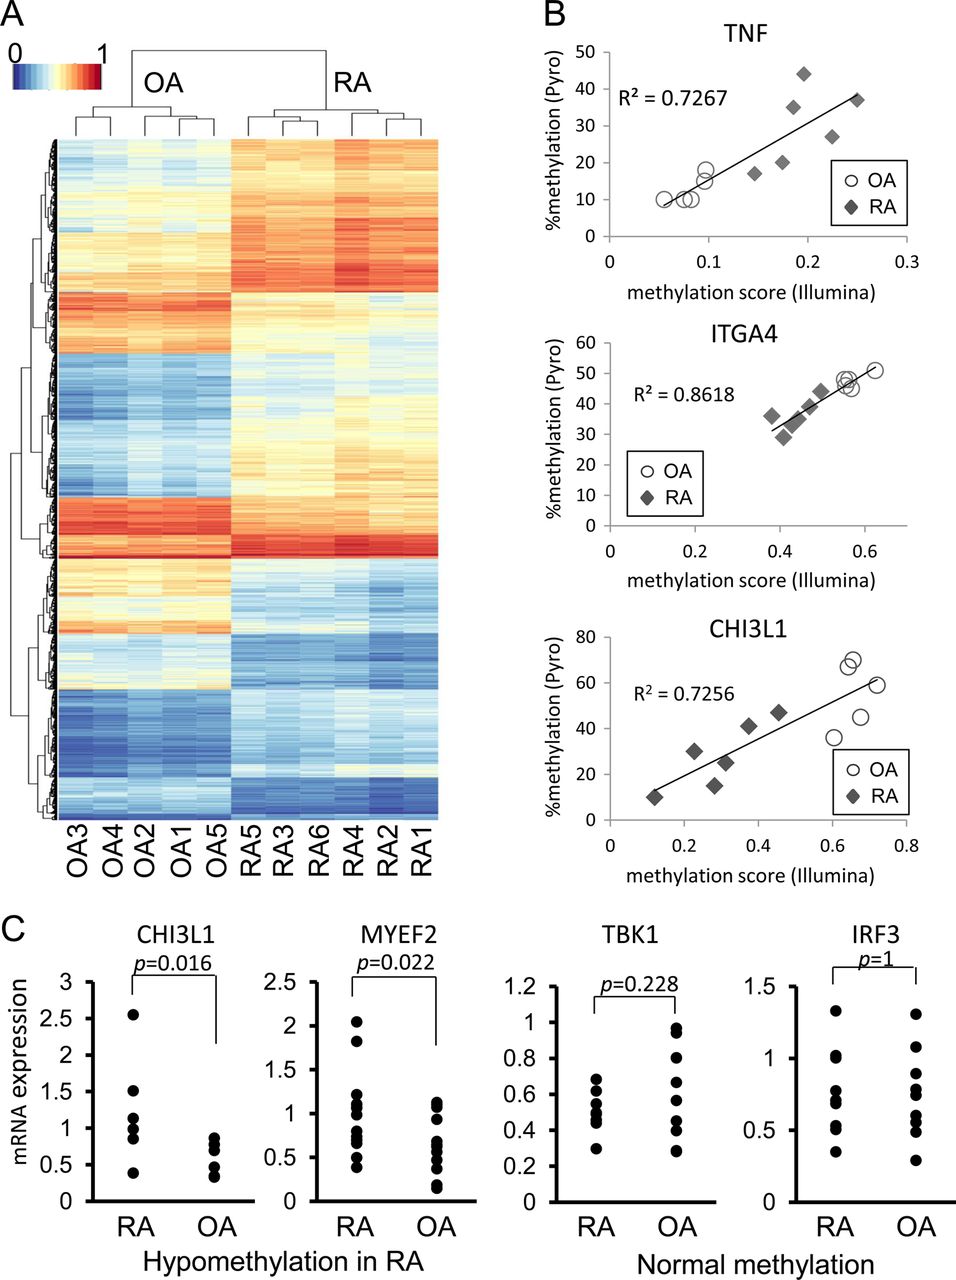
To assess the ability of the 1859 loci to distinguish OA from RA, the methylation patterns at the loci across the 11 samples were hierarchically clustered by measuring the Euclidian distance between methylation levels across the loci (figure 1A). The clustering of the samples distinguishes OA from RA, which significantly segregate according to diagnosis (p<0.05). The clustering of loci also shows that groups of loci have similar patterns of DM across the samples. To confirm the Illumina chip data, we repeated the study using new aliquots of the original 11 FLS lines and obtained similar results (data not shown). In addition, pyrosequencing was used to confirm 10 DM loci of five genes (TNF, FERMT3, CHI3L1, ITGA4 and MYEF2) and validate the chip methodology. Results obtained for all 10 loci were in accordance with results obtained by methylation array with average Spearman's rank correlation coefficient rs=0.90±0.02 (mean±SEM, p<0.01) (figure 1B for representative examples). Therefore, the chip results correlate highly with pyrosequencing and minimise the need for additional sequencing to confirm data in additional DM loci.

Hierarchical clustering and heatmap of differentially methylated (DM) loci. The methylation levels at the 1859 significantly DM loci were used for hierarchical clustering. (A) The clustering of the samples is shown by the dendrogram at the top and the clustering of the loci is shown by the dendrogram on the left. The methylation levels at the loci are shown in the heatmap. (B) Representative correlation in DM loci between the HumanMethylation450 BeadChip and pyrosequencing. DM loci of five genes (TNF; 2, FERMT3; 3, CHI3L1; 1, ITGA4; 2, and MYEF2; 2 loci) of the HumanMethylation450 BeadChip were validated by pyrosequencing (all 11 samples; six rheumatoid arthritis (RA), five osteoarthritis (OA)). The correlation is shown for a hypermethylated locus (TNF) and hypomethylated loci (IGTA4 and CHI3L1) (TNF, chr6:31543300; ITGA4, chr2:182321354; CHI3L1, chr1:203156625, GRCh37/hg19). The y-axis shows the percent methylated cytosines. The x-axis shows the mean methylation score from the Illumina chip. p Value <0.01 for all loci. (C) Gene expression of hypomethylated genes in RA fibroblast-like synoviocytes (FLS). Gene expression was determined by PCR in 6–13 separate OA and RA FLS lines for seven genes that were significantly hypomethylated (CHI3L1, COL1A1, MYEF2, ITG4A, SYNJ2, STK24, MAP3K5). Representative examples are shown for hypomethylated genes. Taken as a group, expression of hypomethylated genes in RA was significantly greater than OA (p<0.01). As a group, expression of genes that were normally methylated in RA was similar to OA (representative examples shown) (AXIN, IKKE, TBK1, NANOG, POU5F1, MAP2K6, IRF3).
Analysis of genes with multiple DM loci
We then identified the genes with multiple DM loci (see Methods section). In all, 207 genes were enriched for multiple hypermethylated or hypomethylated loci (table 1). Representative examples of DM genes are shown in table 3, and the complete lists of genes are provided in supplementary online table S2. Of interest, several genes associated with matrix regulation are affected, including several collagen proteins, proteases (ADAM12) and protease inhibitors (TIMP2).
Representative genes with more than one differentially methylated loci
Correlation of gene expression and methylation status
Functional analysis of the DM was then performed by evaluating expression of 14 separate genes with hypomethylated and normally methylated loci in RA FLS by qPCR (see figure 1C for representative examples). Although there was individual variation, expression of genes with hypomethylated loci was significantly greater in RA FLS than in OA FLS (n = 7 genes; p<0.01). On the other hand, expression of normally methylated genes was similar in RA and OA FLS (n=7 genes; p>0.10). Therefore, expression levels of a broad panel of genes correlated with methylation status.
Pathway and GO analyses
The biological pathways and gene ontologies that are enriched with DM loci were examined. Loci were mapped to pathways via their relationships to genes within KEGG pathways and for GO using all 1859 DM loci identified (see table 1). As shown in table 4, pathway analysis showed that interactions between cells and the matrix and cell recruitment were especially prominent in the DM group, including focal adhesion, cell adhesion molecules, leukocyte transendothelial interactions and ECM–receptor interactions. Other pathways, such as mTOR signalling and adipokine signalling, were also DM in the RA cells. Examples of genes in the ‘Focal adhesion’ pathway, which are enriched with hypomethylated loci in RA, include ITGA, ITGB, Actinin, RTK, Parvin, DOCK1 and Bcl-2. Supplementary online table S3 shows a complete list of the DM pathways. The complete list of differential GO terms is shown in supplementary online table S4. Of interest, the number of GO terms associated with hypomethylated DNA in RA was greater than for hypermethylated DNA (14 vs 3) and included the PcG protein complex, which is associated with remodelling chromatin to permit epigenetic gene silencing. Thus, hypomethylated terms clustered in RA especially related to membrane and transcription factor biology.
Examples of gene ontology (GO) and Kyoto Encyclopedia of Genes and Genomes (KEGG) analysis of hypomethylated and hypermethylated genes in rheumatoid arthritis (RA)
Confirmatory cell lines
Methylation was then determined with 11 new FLS lines (five RA and six OA). All 22 RA/OA lines were hierarchically clustered using the 1859 DML from the original dataset to determine if the methylation patterns of the new lines matched the original dataset. Hierarchical clustering of three of five new RA and six of six new OA cell lines conformed to the RA/OA signatures found in the original data. There were no distinguishing clinical features in the two RA FLS that did not conform with the other nine. An SVM model trained on the initial 11 RA/OA FLS lines using the 20 most significant DM loci was able to predict the diagnosis of the 11 new RA/OA lines with 100% accuracy (100% sensitivity and 100% specificity). To identify a DM locus subset that distinguishes all 11 RA lines via hierarchical clustering, the original 1859 DM loci were then ranked based on the similarity of the two non-conforming RA FLS lines to the original six RA lines to expand the definition of the RA signature. The top 20 DM loci from this new ranking (see Supplementary online table S5, including loci in key genes like ANGPT1, TRAF2, MMP20, and STK24) distinctly clustered all 11 RA lines from all 11 OA, including the six new OA lines and three new RA lines that were not included during DM loci ranking (see figure 2). Further confirmation was obtained with six additional normal FLS lines, which clustered with OA and did not overlap with RA (see figure 2). Using these 20 DM loci and twofold cross validation on all 28 FLS lines (RA/OA/normal), the SVM model predicted RA with 100% accuracy (100% sensitivity and 100% specificity).

Hierarchical clustering and heatmap of differentially methylated (DM) loci. Hierarchical clustering was performed using the top 20 DM loci as described in the text. Note that the osteoarthritis (OA) fibroblast-like synoviocytes (FLS) lines were completely segregated from rheumatoid arthritis (RA) using these loci, including three new RA and six new OA FLS lines that were independent of the algorithm. In addition, six new normal FLS lines clustered with OA. See supplementary online table S5 for identification of the loci used in the model.
Discussion
FLS contribute to the pathogenesis of RA by producing inflammatory mediators and contributing to cartilage damage.14–,16 Understanding the molecular mechanisms that regulate FLS activation could provide insights into the pathogenesis of RA and lead to novel therapeutic strategies. In the present study, we evaluated the epigenetic profile of RA FLS by exploring DNA methylation patterns in an unbiased fashion. A novel methylome signature was identified, especially involving pathways relevant to cell movement, adhesion and trafficking. A simplified algorithm identifying a limited subset of DM loci that distinguishes RA from OA was developed and confirmed with new FLS lines from patients with arthritis as well as normal individuals. These data strongly support the notion that RA FLS methylation patterns are distinct from control and normal FLS.
Rheumatoid FLS exhibit a unique aggressive phenotype that contributes to the cytokine milieu and joint destruction.17 Functional studies suggest that RA cells are imprinted in situ and maintain these features after many passages in tissue culture. For example, RA FLS, unlike OA or normal synoviocytes, adhere to and invade cartilage explants in SCID mice.18 RA FLS can grow under anchorage-independent conditions, are less susceptible to contact inhibition and resistant to apoptosis.19 ,20 RA synoviocytes can potentially ‘metastasize’ and transfer the invasive phenotype from one joint to another.6
Several mechanisms have been implicated in the aggressive phenotype, including abnormal sentrin or phosphatase and tensin homologue expression, preferential shunting of stressed cells to DNA repair rather than programmed cell death,21–,23 and somatic mutations of regulatory genes.24–,29 Micrcosatellite instability has also been identified in RA synovium, in part due to decreased DNA repair.30 These genetic modifications potentially affect the natural history of disease.
Epigenetics can also profoundly influence cell activation and gene expression through a variety of mechanisms, including DNA methylation, histone modification and microRNA production.31 Normal ontogeny relies on a carefully orchestrated sequence of DNA methylation to repress regulatory genes by methylating cytosine in CpG loci, either in promoters or in genes themselves.32 Methylation abnormalities have been associated with many diseases, most notably cancer where expression or suppression of key genes allows cells to escape normal homeostatic controls.33 Hypomethylation and hypermethylation are associated with many malignancies and can contribute to transformation.34
DNA methyltransferases (DNMTs) are responsible for initiating and maintaining CpG methylation in the human genome by converting cytosine to methylcytosine.35 In mammalian cells, DNMT1, DNMT3a and DNMT3b are the primary enzymes responsible for CpG methylation. DNMT3a and DNMT3b mainly regulate de novo methylation while DNMT1 maintains methylation, especially during cell division. DNMT expression and DNA methylation are not immutable but are influenced by the environment and modify gene expression throughout life and even in progeny. For instance, pregnant mice fed a diet rich in methyl donors give birth to pups with increased levels of DNA methylation and increased airway reactivity in murine asthma for at least two subsequent generations.36 ,37
Global hypomethylation has been described in peripheral blood mononuclear cells of patients with RA, although the specific genes involved are not known.38 Using chip technology to evaluate methylation of 809 CpG sites, no differences were observed in unfractionated peripheral blood mononuclear cells of twins disconcordant for RA.39 We used an alternative approach by focusing on a homogeneous population of cells from the site of disease and chip technology that evaluates many more loci (>450 000 methylation sites). Modest global hypomethylation was also reported in cultured RA FLS when compared with OA cells, and treating RA FLS with a DNMT inhibitor decreased methylation further.40 Our studies suggest that global methylation levels are similar in OA and RA FLS for the specific loci assayed.
The genome-wide analysis identified distinct methylation profiles of OA and RA FLS involving 1859 loci located in 1206 genes. Cluster analysis showed that the two types of FLS could be distinguished based solely on methylation. Additional analysis identified 207 genes with multiple hypermethylated or hypomethylated loci. Many of these genes play a key role in inflammation, matrix regulation, leukocyte recruitment and immune responses and could represent novel therapeutic targets. Gene expression levels correlated with methylation status, with high expression in hypomethylated genes in RA FLS and normal expression in genes that were not DM. General concordance between methylation and mRNA levels was observed despite the large number of factors that can influence gene expression. The differences are especially interesting in light of the fact that most loci are in the body of genes rather than the promoter regions, as previously described.41
Analysis of DM KEGG pathways revealed a preponderance of DM genes related to cell adhesion, movement and trafficking. The traditional view of synoviocytes as relatively static cells that remain in the synovial intimal lining requires considerable revision. Instead, they are a dynamic population that move within the synovium to the surface of cartilage, disengage from the intimal lining to populate the synovial fluid compartment and mediate destruction. Synoviocytes can also release from the extracellular matrix and migrate to other joints. The combination of functional observations related to the ‘spread’ of RA via migrating FLS and imprinting cell movement via the methylome provides evidence that targeting genes in these KEGG pathways could be effective in RA.
These data provide evidence that epigenetic changes occur in RA synoviocytes and that they persist in culture. Imprinting could potentially occur before clinical disease and contribute to susceptibility. Alternatively, the changes could be induced after initiation of synovitis. The inflammatory milieu could potentially contribute to synoviocyte imprinting and affect their function. Thus, local inflammation could alter the expression of enzymes responsible for initiating and maintaining DNA methylation. Additional studies on cells from patients with high risk for developing RA would be needed to resolve this question. Experiments to evaluate the effects of the inflammatory milieu on the methylome and the stability of differential methylation are also needed.
The ability to distinguish RA FLS based on DNA methylation could provide insights into how synoviocytes are altered and contribute to the pathogenesis of this disease. Evidence of RA phenotypic stratification based on the transcriptome also supports this concept,42 and epigenetic imprinting is one potential mechanism. Therefore, defining the methylome in FLS offers a new way to explore these differences and identify novel therapeutic targets.
Acknowledgments
The authors thank Josh Hillman for outstanding technical assistance and Dr Scott Ball and Dr William Bugbee for providing clinical samples and Dr Olivier Harismendy and the Clinical and Translational Research Institute BioComputational Center for assistance designing pyrosequencing experiments. The authors are also indebted to Dr Robert Shoemaker from NexDx, Inc. for assisting with the algorithms on the confirmatory cell lines.
References
Supplementary materials
Supplementary Data
This web only file has been produced by the BMJ Publishing Group from an electronic file supplied by the author(s) and has not been edited for content.
Files in this Data Supplement:
- Data supplement - Online table 1
- Data supplement - Online table 2
- Data supplement - Online table 3
- Data supplement - Online table 4
- Data supplement - Online table 5
Footnotes
-
Contributors KN, DB and GF designed methods and experiments, analysed the data, and interpreted the results. KN also carried out the laboratory experiments, JW and WW developed the bioinformatic algorithms and analysed array data. KN, WW, JW and GF wrote the paper. All authors have contributed to, seen and approved the manuscript.
-
Funding This project was supported by grant number UL1RR031980 from the NIH National Center for Advancing Translational Science.
-
Competing interests GSF and WW are on the Scientific Advisory Board of NexDx, Inc.
-
Patient consent Written, informed consent was obtained from participants at the time of sample collection.
-
Ethics approval All study protocols related to human studies were approved by the Institutional Review Board of the University of California San Diego.
-
Provenance and peer review Not commissioned; externally peer reviewed.