Article Text

Abstract
Background Indocyanine green (ICG)-enhanced fluorescence optical imaging (FOI) is an established technology for imaging of inflammation in animal models. In experimental models of arthritis, FOI findings corresponded to histologically proven synovitis. This is the first comparative study of FOI with other imaging modalities in humans with arthritis.
Methods 252 FOI examinations (Xiralite system, mivenion GmbH, Berlin, Germany; ICG bolus of 0.1 mg/kg/body weight, sequence of 360 images, one image per second) were compared with clinical examination (CE), ultrasonography (US) and MRI of patients with arthritis of the hands.
Results In an FOI sequence, three phases could be distinguished (P1–P3). With MRI as reference, FOI had a sensitivity of 76% and a specificity of 54%, while the specificity of phase 1 was 94%. FOI had agreement rates up to 88% versus CE, 64% versus greyscale US, 88% versus power Doppler US and 83% versus MRI, depending on the compared phase and parameter. FOI showed a higher rate of positive results compared to CE, US and MRI. In individual patients, FOI correlated significantly (p<0.05) with disease activity (Disease Activity Score 28, r=0.41), US (r=0.40) and RAMRIS (Rheumatoid Arthritis MRI Score) (r=0.56). FOI was normal in 97.8% of joints of controls.
Conclusion ICG-enhanced FOI is a new technology offering sensitive imaging detection of inflammatory changes in subjects with arthritis. FOI was more sensitive than CE and had good agreement with CE, US in power Doppler mode and MRI, while showing more positive results than these. An adequate interpretation of an FOI sequence requires a separate evaluation of all phases. For the detection of synovitis and tenosynovitis, FOI appears to be as informative as 1.5 T MRI and US.
This paper is freely available online under the BMJ Journals unlocked scheme, see http://ard.bmj.com/info/unlocked.dtl
Statistics from Altmetric.com
Introduction
With recent advances in the management of rheumatic diseases, imaging plays a major role in early diagnosis, estimation of prognosis and evaluation of therapeutic outcome. In rheumatoid arthritis (RA), treat-to-target strategies1 and the adequate use of disease-modifying drugs1 2 require sensitive instruments that allow a valid detection of affected joints.
Careful clinical examination (CE) is a prerequisite but may miss subclinical inflammation in early disease as well as in clinical remission under treatment.3,–,5 Conventional radiography is commonly used as an indicator of prognosis and represents the standard outcome measure of disease progression in clinical studies but is displaying the result of previous inflammatory processes rather than presenting current disease activity. MRI is considered the gold standard for imaging of synovitis, and MRI bone marrow oedema has been shown to be the strongest independent predictor of radiographic progression in RA.6 7 However, broader usage of MRI in clinical routine settings may be restricted by workflow considerations, cost and limited availability.
Ultrasonography (US) in greyscale mode (GSUS) and US in power Doppler mode (PDUS) have been demonstrated as valid tools for the assessment of synovitis and scoring of clinical activity in RA.8,–,10 In daily clinical practice, PDUS is more available than MRI and often used for fast and dynamic assessment of joint inflammation.11 However, apart from clinical studies, the examination procedure is usually limited to a reduced number of joints12 due to time constraints.
Fluorescence optical imaging (FOI) is an established technology that has been evaluated for imaging of inflammation in a variety of animal models.13 In experimental models of arthritis, indocyanine green (ICG)-enhanced FOI findings corresponded to histologically proven synovitis.14 15 The feasibility of this approach in humans was tested,16 17 and an FOI system with fixed optical geometry was developed (Xiralite X4; mivenion GmbH, Berlin, Germany).
We report the results of the first comparative study of this commercially available FOI system with CE, US and contrast-enhanced MRI in two major cohorts of patients with arthritis and allied conditions and controls.
Patients and methods
Patients
Two hundred and fifty-two subjects with arthritis and allied conditions were recruited in two centres. One hundred and fifty-three consecutive FOI examinations were evaluated in centre 1. Ninety-nine outpatients were recruited randomly in centre 2. Inclusion criteria were symptoms in the hands and agreement for participation in the study. Two patients did not want to participate in the study after detailed information. Six healthy individuals and six subjects with arthralgia without any sign of an inflammatory rheumatic disease served as the control group.
The study was performed in compliance with the Declaration of Helsinki. The study protocol was approved by the ethics committee of the Charité University Clinic Berlin. All study participants had signed consent forms after receiving written and oral information.
Clinical and laboratory assessment
CE and laboratory tests (erythrocyte sedimentation rate (ESR) and C reactive protein (CRP)) were performed. Clinical swollen and tender joints (including distal interphalangeal joint (DIP)) were scored for presence and absence (0–1). The Disease Activity Score 28 (DAS28)18 was used to assess disease activity in patients with RA, psoriatic arthritis (PsA) and undifferentiated arthritis (uA).
Ultrasonography
Seventy-four subjects from centre 2 were examined by GSUS and PDUS (Mylab 70 XVG, Esaote, Genova, Italy). Nine hundred and sixty-two joints (wrist, metacarpophalangeal joint (MCP) 2–5, proximal interphalangeal joint (PIP) 2–5 and DIP 2–5 of the clinically dominant hand) were evaluated semiquantitatively (grades 0–3) for synovitis and synovial/tenosynovial vascularity in a standardised manner.9 12 Tenosynovitis was scored for presence and absence (0–1). For individual patients, a US sum score over the evaluated joints was calculated.
Magnetic resonance imaging
Fat-saturated coronal proton-density (FS-PD-TSE), non-enhanced and enhanced T1-TSE with subtraction, coronal and axial fat-saturated postintravenous gadolinium (Dotarem, 0.2 ml/kg/body weight) (FS-T1-TSE) sequences of the clinically dominant hand were performed in 25 patients (1.5 T MRI; Siemens Magnetom Symphony, Erlangen, Germany). MRI findings (MCP 1–5, interphalangeal joint finger 1 (IP), PIP 2–5, DIP 5 and wrist as a whole) were scored according to the OMERACT (Outcome Measures in Rheumatoid Arthritis Clinical Trials) criteria.19,–,21 The RAMRI score was calculated.
Fluorescence optical imaging
Background of the technology and details of the Xiralite system (figure 1) are described in a supplementary text (only online available). The FOI examination follows a standardised procedure: both hands are placed on a preformed hand rest. Ten seconds after starting the examination, an ICG bolus is injected (ICG-Pulsion, 0.1 mg/kg/body weight intravenously). The system acquires one image every second. Any alteration of fluorophor concentration can be depicted as alteration of signal intensity. In a pilot study, it was found that the signal enhancement had significantly decreased after an examination period of 6 min. Therefore, this duration was determined as the standard examination time.

Schematic display of the Xiralite system. A preformed hand rest is used for reliant positioning of both hands. High-power light-emitting diodes (LEDs) illuminate the field of view with dark red light, whereas a specialised digital camera system (charge-coupled device) records the fluorescence signal intensities in the near-infrared spectrum.
FOI findings were analysed separately for an individual sequence of 360 images and an electronically generated composite image (CI), automatically obtained by means of the integrated software XiraView (version 3.6). A semiquantitative score was applied for assessment of FOI findings (0=no signal enhancement, 1=low (≤25%), 2=moderate (>25%, ≤50%), 3=strong (>50% of affected joint area)). For individual patients, a sum score over all joints (DIP 2–5, PIP 2–5, IP, MCP 1–5, wrist and both hands; range 0–90) was calculated. All FOI findings were analysed and reported by one reader.
Statistical analysis
Data evaluation and statistical analysis were performed using SAS 9.2 (SAS Institute, Cary, North Carolina, USA). Analyses were conducted at the patient and individual joint level. MRI, GSUS and PDUS were used as the standard reference method for calculation of sensitivity and specificity. The agreement rates (ARs) between pairs of modalities (FOI, CE, US and MRI; swollen and tender joints, synovitis and tenosynovitis), sensitivities and specificities were calculated along with confidence intervals on all joints with non-missing data using a modified adjusted χ2 test22 to cover correlations of multiple joints within the same patient. The AR was determined taking into consideration all joints that were affected (grades 1–3) or not affected (grade 0) in both modalities. Comparisons of AR of subgroups (RA, uA and PsA) were performed using appropriate contrasts within logistic regression models. For further analyses of efficacy, summary statistics, frequency counts and 95% confidence intervals were computed as appropriate. The correlations of the scores were calculated using Spearman's rank correlation coefficient. Statistical significance was concluded with two-sided p values below 0.05.
Results
Patients' characteristics
The main clinical, laboratory, MRI and US characteristics are detailed in table 1.
Demographic and clinical data of study population
Morphological FOI findings
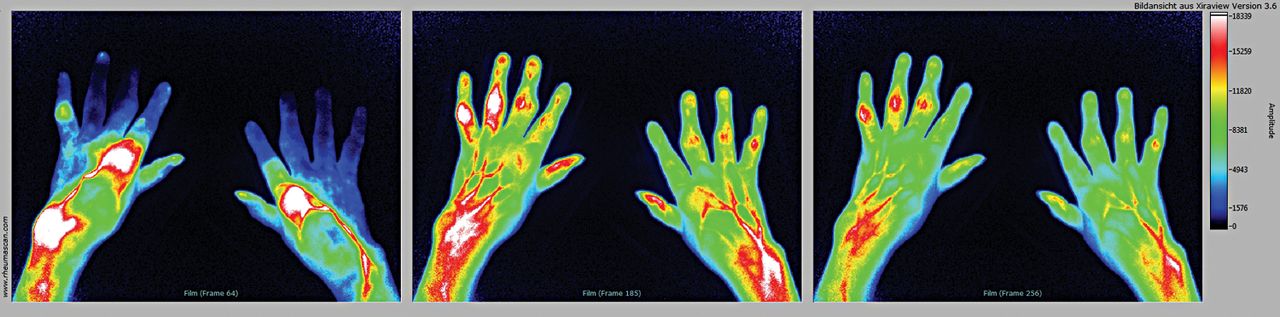
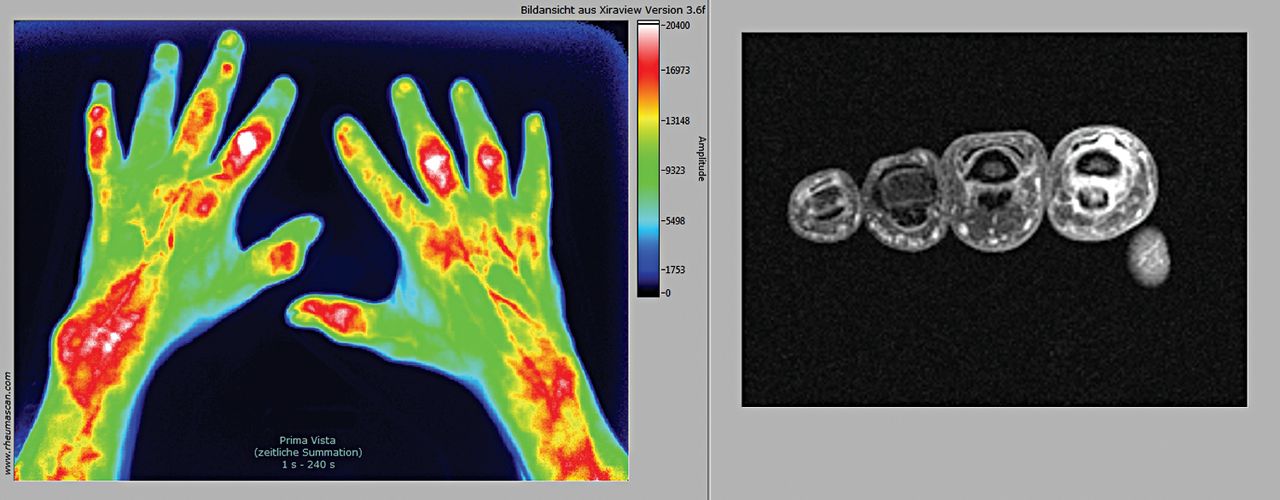
Analysing a single FOI sequence, we found that, within each image stack, three phases (P1–P3) may be distinguished as defined by the different time points' increased signal intensities in the fingertips. Figure 2 shows a typical FOI image of highly active RA, displaying focal increased signal intensity in all three phases. Inflammatory activity in a variety of affected structures was also detected in PsA (figure 3). A triangular, slightly arcuate enhancement from nail bed into DIP was observed in 60 out of 64 (94%) subjects with PsA compared with 8 out of 38 (21%) in patients with definite RA (sensitivity 94%, specificity 79%, positive predictive value 0.88, negative predictive value 0.88; subjects with both RA and psoriasis have been excluded from the calculation).

FOI findings in active rheumatoid arthritis (RA). Phase 1 (A) displays focal increases signal intensities until first increased signals in fingertips (early enhancement phase), phase 2 (B) shows increased signal intensities at the same time as signals in fingertips (intermediate phase), and phase 3 (C) is reached after increased signal intensities of fingertips has decreased (late phase).

FOI (CI) and GSUS in psoriatic arthritis (PsA). FOI shows signal intensities in projection of the joints, tendons, osseous and periosteal structures corresponding to clinical dactylitis. Besides, triangular, slightly arcuate enhancements in projection of the nail bed in fingers 3 and 4 of the right hand are seen. GSUS presents an anechoic structure (*) around the hyperechoic flexor tendon (t) corresponding to tenosynovitis. CI, composite image; FOI, fluorescence optical imaging; GSUS, ultrasonography in greyscale mode; PsA, psoriatic arthritis.
Centre 1
FOI findings were compared with clinical findings in 750 joints (128 tender, 148 swollen, 83 swollen and tender). FOI was compared with MRI findings in 300 joints (figure 4). Fifty-nine joints showed MRI synovitis, and 75 joints showed synovitis or tenosynovitis. MRI detected inflammatory changes in 31 out of 194 (16%) clinically asymptomatic joints. FOI displayed positive findings in 387 out of 750 (77%) joints and in 250 out of 557 (45%) clinically asymptomatic joints.

Comparison of FOI (CI) and MRI findings. Corresponding signal intensities in FOI and contrast-enhanced (gadolinium) MRI in PIP 2, 3, and 5 of the left hand (A, B). CI, composite image; FOI, fluorescence optical imaging.
Sensitivity and specificity
Taking MRI as the gold standard for inflammatory changes (synovitis or tenosynovitis), CE had a sensitivity of 53% and a specificity of 81%. FOI had a sensitivity of 76% and a specificity of 54%. Specificity of phase 1 (P1) and phase 3 (P3) was high (94% and 89%), with corresponding low sensitivity (27% and 47%) (table 2).
Sensitivity and specificity of FOI and CE versus PDUS, GSUS and MRI (synovitis or tenosynovitis) as standards of reference along with 95% confidence intervals
Agreement rates
AR of CE and MRI ranged from 63% to 87%, AR of CE and FOI ranged from 44% to 88% and AR of MRI and FOI ranged from 48% to 88%, depending on the parameter and subgroup (tables 3, 4, S1 and S2). The disagreement mainly resulted from the higher rate of positive findings in FOI. The highest agreement was found for P1, and the lowest was found for phase 2 (P2).
ARs of fluorescence optical imaging with CE, MRI and US
Correlations of FOI with assessments of disease activity
FOI scores correlated significantly and relevantly with the Rheumatoid Arthritis MRI Score (RAMRIS) (r=0.66, p<0.0001) and RAMRIS synovitis (r=0.56, p<0.0001), weakly correlated with DAS28 (r=0.32, p<0.0001) and did not correlate with laboratory parameters of systemic inflammation (ESR and CRP).
Centre 2
FOI findings were compared with clinical findings in 1110 joints (244 tender, 261 swollen, 85 tender and swollen). FOI was compared with GSUS and PDUS findings of the clinically dominant hand in 962 joints. Four hundred and fifty-three joints were positive in GSUS, 148 in PDUS and 136 in GSUS and PDUS (including tenosynovitis). A total of 303 out of 522 (58%) clinically asymptomatic joints showed positive findings in GSUS and 53 out of 522 (10%) showed positive findings in PDUS. FOI displayed positive findings in 864 out of 1110 (78%) joints and in 473 out of 615 (77%) clinically asymptomatic joints.
Sensitivity and specificity
Taking GSUS as reference, CE had a sensitivity of 25% and a specificity of 90% and FOI had a sensitivity of 70% and a specificity of 48%. With PDUS as reference, CE had a sensitivity of 43% and a specificity of 88% and FOI had a sensitivity of 74% and a specificity of 42%. Specificity of P1 and P3 were high (GSUS: 95% and 78%; PDUS: 90% and 69%) with corresponding lower sensitivity (GSUS: 22% and 51%; PDUS: 33% and 60%) (table 2).
Agreement rates
ARs of CE and GSUS ranged from 56% to 60%, ARs of CE and PDUS ranged from 76% to 84%, ARs of CE and FOI ranged from 35% to 88%, ARs of GSUS and FOI ranged from 53% to 72% and ARs of PDUS and FOI ranged from 46% to 82%, depending on the parameter and subgroup (tables 3, 4, S1 and S3). The disagreement mainly resulted from the higher rate of positive findings in FOI. The highest agreement was found for P1, and the lowest was found for P2.
ARs of CE with MRI, US and fluorescence optical imaging
Correlation of FOI with assessments of disease activity
FOI scores correlated significantly and relevantly with DAS28 (r=0.41, p<0.0001) and US (r=0.40, p=0.0008) but not with laboratory parameters (ESR and CRP).
Subgroup analysis
Generally, the AR did not differ significantly in RA, PsA or uA. Exceptions were the AR for FOI versus CE (s+t) in RA and uA (p=0.0309) and the AR of FOI and GSUS in RA compared to uA (p=0.0018) and PsA (p=0.0017, tables S2 and S3).
Control group
In 12 controls (6 healthy and 6 with arthralgia without any sign of inflammatory rheumatic disease; median age 30 years, range 21–56 years, 3 women), 360 joints were evaluated. FOI did not detect any positive findings in 97.8–100% of joints (figure S1), depending on the evaluated image or phase. FOI displayed positive findings in 1 out of 360 joints (0.3%) in CI, 8 out of 360 joints (2.2%, grade 1 changes) in P2 and none in P1 and P3. MRI was available in five controls. While MRI was normal, FOI showed minimal changes in CI and P2 (1 out of 60 joints, 1.2%, and 2 out of 60 joints, 3.3%) and none in P1 and P3.
Safety
In all subjects, the procedure was well tolerated. Adverse events were not observed.
Discussion
ICG-enhanced FOI with the Xiralite system is a new imaging technology. To our knowledge, this is the first study to evaluate the application in patients with arthritis and to compare it with CE, US and MRI.
We found that FOI agreed well with CE, MRI and US. FOI was more sensitive for detecting synovitis and tenosynovitis than CE. FOI showed a higher rate of positive findings than the other compared modalities. In an FOI sequence, three phases could be distinguished, with different sensitivity and specificity as well with different AR. FOI scores correlated significantly with assessment of disease activity (DAS28, US score, RAMRIS). In healthy subjects, FOI was negative in almost all joints.
FOI relies on the fluorescence optical detection of vascularity in inflamed tissues by the means of ICG as a fluorophor.23 24 Angiogenesis is an early event and is highly dysregulated in inflammatory disorders such as arthritis or psoriasis.25 In RA, hypervascularisation and angiogenesis of the synovial membrane are considered to be primary pathogenic mechanisms responsible for the aggressiveness of the rheumatoid pannus on the joint and are suggested as the link to bone destruction.26 Synovial vascularisation correlated with the disease activity of a given joint,27 28 with radiographic progression29 and with the therapeutic response in patients with RA.5
In animal models, FOI has been shown as an appropriate method to identify inflammatory changes in arthritic joints.15 29 The histopathological findings of these studies showed early inflammatory changes in FOI-positive joints.
In the present study, FOI was compared to CE, MRI and US in two larger cohorts of patients with arthritis and in healthy controls. The major findings were comparable in both centres.
FOI versus CE
FOI agreed well with clinically swollen and tender joints. Disagreement of FOI and CE mainly resulted from the higher rate of positive findings in FOI. The highest agreement was seen for FOI P1 and swollen and tender joints, indicating that P1 displays joints with high clinical activity. With MRI or US as reference, FOI was more sensitive than CE.
FOI versus MRI
FOI agreed well with MRI synovitis and tenosynovitis. Taking MRI as reference, FOI had a sensitivity of 76% and a specificity of 54%, with a higher specificity (94% and 89%) and a lower sensitivity (27% and 47%) for P1 and P3, respectively. AR was up to 88%. Thus, FOI is able to detect MRI synovitis and tenosynovitis reliably. Disagreement of FOI and MRI mainly resulted from the higher rate of positive findings in FOI. A possible explanation is that the different imaging modalities display distinct aspects of the underlying inflammatory pathology. This hypothesis can be proven only by histological examinations.
FOI versus US
FOI agreed well with US. With GSUS or PDUS as reference, we found a sensitivity of 70% and 74% and a specificity of 48% and 42%, respectively. A higher specificity and a lower sensitivity were seen for P1 (GSUS 95% and 22%; PDUS 90% and 33%) and P3 (GSUS 78% and 51%; PDUS 69% and 60%). AR was up to 82% with PDUS. Thus, FOI displayed US synovitis and tenosynovitis reliably. Similar to MRI, the disagreement of FOI and US mainly resulted from the higher rate of positive findings in FOI. FOI agreed in a higher range with PDUS, which also displays vascularity.
In a comparative study30 with MRI as reference, US revealed a sensitivity of 40–70% for synovitis and an agreement (73–100%) comparable to our findings for FOI. Especially for the inflammatory changes, the sensitivity and agreement of US were lower than those for destructive changes. Similar results were obtained in other studies.31 32 US and MRI display both morphological changes (eg, pannus, erosions) and dynamic changes (eg, hyperaemia, hypervascularity, hyperperfusion). FOI only displays the dynamic changes. Because of the broader range of dynamic changes compared to morphological changes, we strongly believe that interpretation of findings is more difficult and this may have an influence on sensitivity and AR.
Controls
In the control group, FOI was normal in 97.8% joints. None of the 360 joints was FOI positive in P1 or P3. Positive findings were in low grade. This observation supports the interpretation that the disagreement of FOI with MRI and US in the majority of cases did not result from false-positive findings.
Subgroups
AR did not differ significantly between patients with RA, PsA and uA in most scenarios. Thus, this finding suggests that FOI is able to detect inflammatory changes independently of the underlying disease.
Phases
AR of FOI and CE, MRI and US differed for the CI and the phases. FOI P1 showed the highest agreement with CE and PDUS, which suggests that P1 displays high local disease activity with high vascularity. The specificity of P1 and P3 was high. Thus, findings in these phases seem to be of special interest. The highest sensitivity was seen in P2 and is comparable to the sensitivity of US with MRI as reference reported from other studies.30 32 While the meaning of the phases is still unclear, an adequate interpretation of an FOI exam requires a specific reading of all the phases.
Subclinical inflammation
MRI, GSUS and PDUS showed positive findings in 16%, 58% and 10% of clinically asymptomatic joints, respectively. This is in alignment with results of other studies where MRI and US detected a higher rate of affected joints than CE.3 30,–,32 In our study, FOI showed positive findings in 45% of clinically asymptomatic joints, indicating that FOI also detects subclinical inflammation.
Differential diagnostic aspects
A characteristic pattern of signal distribution was seen in patients with PsA. The morphological aspect indicates an association with the synovio-entheseal complex.33 This sign may provide additional information for differential diagnosis but has to be validated with a larger number of patients.
Correlations with scores of disease activity
We found that FOI correlated significantly with disease activity scores (DAS28, US score, RAMRIS). Monitoring of disease activity and valid assessment of remission, the special target for RA treatment,1 are a crucial aspect with respect to the rapidly growing armamentarium of disease-modifying drugs. Our data indicate that FOI may be an additional tool for the assessment of disease activity in arthritic conditions.
Limitations
We are aware of some limitations concerning the image interpretation and quantification of pathological changes. While the examination procedure itself has been standardised in detail, consistent standards for image adjustment and interpretation are not yet established. In this study, we have chosen a semiquantitative evaluation of FOI findings, comparable to US image interpretation. Generally, the digital technology of the Xiralite system allows an automatic image interpretation and quantitative analysis of image sequences, but appropriate software is not yet available. With a substantial34 intrareader (κ=0.73) and inter-reader (κ=0.73) agreement (separate study, data not published), our method of image interpretation seems to be reliable.
In conclusion, ICG-enhanced FOI with the Xiralite system is a new imaging technology that allows a sensitive and valid assessment of inflammation in arthritis. FOI was comparable to 1.5 T MRI and US in detecting synovitis and tenosynovitis. Thereby, it is a fast and safe imaging screening tool for patients with suspected arthritis. Furthermore, FOI is useful for objectifying treatment response and treatment monitoring. FOI was more sensitive than CE. In addition, FOI could be helpful in the differentiation of nail involvement and arthritis of DIPs in patients with psoriasis and/or PsA. However, further investigations are needed for a comprehensive definition of FOI pathologies, advancement of methodical standards and evaluation of sensitivity to change and prognostic value.
References
Footnotes
H-EL and SO contributed equally
-
Funding This study was supported by BMBF project “ArthroMark”, subproject no. 7 “Clinical study on Biomarkers and Imaging”. One of the technical devices (FOI) was provided via an unrestricted educational grant by Pfizer Company, Berlin, Germany. Statistical analysis was funded by mivenion GmbH, Berlin, Germany.
-
Competing interests M Schirner and M Bahner are shareholders of mivenion GmbH.
-
Patient consent Obtained.
-
Ethics approval This study was conducted with the approval of the ethics committee of the Charité University Clinic Berlin.
-
Provenance and peer review Not commissioned; externally peer reviewed.
Linked Articles
- Miscellaneous