Article Text

Abstract
Objective Dual-energy CT (DECT) detects and quantifies monosodium urate (MSU) crystal deposition with high precision. This DECT study assessed crystal deposition in patients with gout treated with stable-dose allopurinol, and investigated potential clinical determinants for crystal deposition.
Methods Patients with gout treated with allopurinol ≥300 mg daily for at least 3 months were prospectively recruited from the USA and New Zealand, using monitored enrolment to include approximately 25% patients with palpable tophi and approximately 50% with serum urate (sUA) levels <6.0 mg/dL (<357µmol/L). MSU crystal deposition was measured in the hands/wrists, feet/ankles/Achilles and knees bilaterally. The presence and total volume of crystals were assessed by DECT and analysed according to sUA levels and gout characteristics.
Results Among 152 patients receiving allopurinol ≥300 mg/day for 5.1 years on average, 69.1% had crystal deposition on DECT, with a median total crystal volume of 0.16 cm3 (range: 0.01–19.53 cm3). The prevalence of crystal deposition ranged from 46.9% among patients with sUA <6.0 mg/dL and no palpable tophi to 90.0% among those with sUA ≥6.0 mg/dL and tophi. Total volume of crystal deposition was positively associated with sUA ≥6.0 mg/dL, gout flares within the past 3 months and tophi. Total volume of crystal deposition correlated positively with Patient Global Impression of Disease Activity scores.
Conclusion A substantial proportion of patients without palpable tophi have MSU crystal deposition, despite receiving allopurinol doses ≥300 mg/day for a considerable duration. Patients with higher sUA and clinical features of severe disease have a higher frequency and greater volume of MSU crystal deposition.
- gout
- treatment
- patient perspective
This is an Open Access article distributed in accordance with the Creative Commons Attribution Non Commercial (CC BY-NC 4.0) license, which permits others to distribute, remix, adapt, build upon this work non-commercially, and license their derivative works on different terms, provided the original work is properly cited and the use is non-commercial. See: http://creativecommons.org/licenses/by-nc/4.0/
Statistics from Altmetric.com
Introduction
Individuals with chronic hyperuricaemia are predisposed to the deposition of monosodium urate (MSU) crystals in the musculoskeletal and other tissues. Over time, this leads to chronic inflammation, acute gout flares, joint damage and disfiguring tophi.1 Achieving a sustained reduction in serum urate (sUA) levels to target levels, for example,<6.0 mg/dL (<357 µmol/L) (or <5.0 mg/dL (<297 µmol/L) for more severe cases), is associated with the dissolution of MSU crystals, which in turn leads to a reduction in gout flare rates and resolution of tophi.2–5
Allopurinol, a xanthine oxidase inhibitor, is a widely used urate-lowering therapy in patients with gout.6 Management guidelines recommend titrating doses of allopurinol to a maximum of 800 or 900 mg/day, according to local prescribing information.7 8 Many patients, however, fail to receive allopurinol doses above 300 mg/day and the majority of patients do not achieve their target sUA using allopurinol monotherapy at lower doses.9 10
Physical examination alone is frequently incapable of detecting MSU crystal deposits while arthrocentesis is not performed routinely, and so the ability of different imaging techniques has been investigated to detect and monitor crystal deposits.11–13Dual-energy CT (DECT) has been shown capable of detecting MSU crystals with high precision and can accurately measure crystal volume, with the potential to monitor response to therapy.14–20 DECT additionally demonstrates high reproducibility for assessing the joint erosions associated with crystal deposition.21
The main objectives of this DECT study were to assess the presence and volume of MSU crystal deposition in the peripheral joints and to investigate potential clinical determinants of crystal deposition in patients with gout treated with stable-dose allopurinol. Correlations of crystal deposition with patient and physician-reported assessments of pain, disease activity and disease control were also investigated.
Materials and methods
Study design and patients
This prospectively recruited, non-interventional, multicentre study was performed in the USA (n=9 centres) and New Zealand (n=1 centre), with the centralised DECT reading centre at the Vancouver General Hospital in Canada (Dr Savvas Nicolaou, principal radiologist). The study was conducted between April 2015 and October 2016 in accordance with the ethical principles of Good Clinical Practice according to the International Council on Harmonisation, Harmonised Tripartite Guideline and in compliance with the Helsinki Declaration (NCT02393560).
The study included a day 1 visit, an imaging visit that included DECT scans of the patient’s hands/wrists, feet/ankles/Achilles and knees conducted at a study-specified imaging facility and a follow-up visit approximately 28 days after imaging to review the DECT results with the patient (figure 1).

Study design and patient disposition. *Primary reason for not completing the study. DECT, dual-energy CT; PRO, patient-reported outcomes.
Adult patients (aged 18–85 years) were eligible if they had American Rheumatism Association Criteria for the Classification of Acute Arthritis of Primary Gout22 and had been treated with allopurinol as the sole urate-lowering therapy at a stable dose ≥300 mg daily for ≥3 months prior to study day 1. Patients with concomitant medical or psychological conditions that might interfere with study protocol requirements were excluded.
Monitored enrolment was implemented on eligible subjects to ensure that the DECT imaging population included approximately 25% of patients with palpable tophi and approximately 50% with sUA <6.0 mg/dL.
DECT assessments
DECT examinations were performed using the second-generation 128-slice Definition Dual Source scanner and routine 64-slice scanners at tube voltages of 80 kV and 140 Sn kV. 4D tube current modulation was deployed with a collimation of 0.6 mm and slice thickness of 0.75 mm. Two data sets were generated, one at 80 kV and one at 140 Sn kV, which were constructed with the B30 kernel.
Gout software (syngo.via VB10 software package, Siemens, Forchheim, Germany) used characteristic differences in attenuation at these voltages to produce digital color-coded images that rendered urate green, cortical bone blue and trabecular bone purple. Green-rendered areas were required to have a minimum diameter of 3 mm to be described as urate positive. Regions had to be globular, focal and confluent to be considered as tophi for counting purposes.
The data that coded urate deposition as green were loaded separately in a dedicated automated volume assessment software program (syngo.via VB10 software package), with minimum and maximum values of –1 and –1000, respectively. This technique allowed rapid, reproducible measurement of urate deposits.16 The radiologist circled the entire bodily region (eg, forefoot, knee, wrist) to determine total urate volume at each site, and the volume at each site was summed for the total volume measurement used in this analysis.
Erosions were identified on plain radiographs or at CT as breaks or defects in the cortical bone surface, often accompanied by loss of adjacent trabecular bone. Erosions could be central, periarticular/juxta-articular or marginal.
The presence and the volume of MSU crystals and the presence of joint erosions were assessed by two DECT radiologists. In cases of discrepancy, a consensus meeting was held between the two readers and the consensus value was used in the analysis.
Patient and physician-reported assessments
Patient-reported assessments of pain, global disease activity and disease control were performed at day 1 and follow-up visits using visual analogue scales for Pain Assessment (numerical rating scale: 0, no pain; 10, severe pain), Patient Global Impression of Disease Activity (numerical rating scale: 0, very well; 10, very poor) and Patient Impression of Disease Control (numerical rating scale: 0, not at all controlled; 10, fully controlled).
Physician-reported Global Impression of Disease Activity (numerical rating scale: 0, none; 10, extremely active) and Impression of Disease Control (numerical rating scale: 0, not at all controlled; 10, fully controlled) were also performed at day 1 and follow-up visits.
Statistical methods
All subjects with a readable DECT scan were included in imaging analyses. DECT findings for the presence and total volume of crystal deposition, and the presence of joint erosions, were analysed according to demographics (age, gender, race), medical history, clinical features of gout (duration, presence of tophi, number of tophi locations, gout flare history), duration of allopurinol treatment (years), baseline sUA (≥6.0 vs <6.0 mg/dL), body mass index (kg/m2), baseline renal function (glomerular filtration rate <60 vs ≥60 mL/min), allopurinol dose (300 vs >300 mg/day) and other baseline laboratory values.
The Wilcoxon Mann-Whitney test (two levels) and the Kruskal-Wallis test (three or more levels) examined the association between end points in continuous scales (ie, total volume of MSU deposition) and clinical features (eg, age, sex, race, allopurinol dose and duration, presence of tophi and number of gout flares). Pearson’s χ2 test and Fisher’s exact test were used to examine the association between endpoints in categorical scales (ie, presence of MSU deposits and presence of joint erosions) and categorical factors. Logistic regression was used to examine the association between end points in categorical scales and continuous factors. Spearman correlation coefficients are presented to show the correlation between total volume of MSU deposition and continuous factors. Correlation coefficients above the threshold of 0.30 are considered relevant,23 and nominal p values<0.05 are considered statistically significant. Multivariate analyses were not performed in this cross-sectional study.
Results
Patients
Of 223 patients with gout who fulfilled the admission eligibility criteria, 153 patients completed the study with an interpretable DECT scan and constituted the imaging population (figure 1). Sixty-four patients were excluded from the imaging study due to enrolment restrictions, an uninterpretable DECT scan or a scan not performed. Six additional patients were excluded due to protocol violation (n=2) or withdrawn consent (n=4).
Patients in the imaging population were predominately male with a mean age of 58.5 (SD 11.42) years (table 1). The mean gout duration was 14.93 (SD 10.29) years and the mean duration of allopurinol treatment was 5.05 (SD 6.87) years. The mean allopurinol dose was 332.7 mg (SD 81.78 mg, range: 300–750 mg); 81.7% of patients were treated with allopurinol at a stable dose of 300 mg/day and 18.3% at a stable dose >300 mg/day. Palpable tophi were present in 48 patients (31.4%) and sUA was ≥6.0 mg/dL in 75 patients (49.0%).
Demographic and baseline characteristics in imaging population, categorised by palpable tophus status and sUA level
Median laboratory parameters on day 1 were within normal reference ranges, with the exception of estimated creatinine clearance (median 75.0 mL/min; normal range: 85–125 mL/min). Common comorbidities included hypertension (65.4%), hyperlipidaemia (58.2%) and diabetes mellitus (24.2%). The most common concomitant medications were ACE inhibitors (38.6%), HMG CoA reductase inhibitors (35.9%) and oral anticoagulants/antiplatelet agents including aspirin (30.1%).
MSU crystal deposition and joint erosion on DECT
Data on MSU crystal deposition were missing for one patient with a readable DECT scan. Crystal deposits were identified by DECT in 105 of 152 (69.1%) patients overall, including 34 (22.4%), 90 (59.2%) and 81 (53.3%) patients, respectively, with deposits at the hands/wrists, feet/ankles/Achilles and knees.
The highest prevalence of deposition was in patients with both sUA ≥6.0 mg/dL and palpable tophi (90.0%), and the lowest prevalence was in patients with sUA <6.0 mg/dL and no palpable tophi (46.9%) (table 2). Figure 2A, B shows example DECT images of crystal deposition in patients in these respective categories. Crystal deposits were detected by DECT in 35 of 42 patients (83.3%) with flares in the past 3 months versus 70 of 110 (63.6%) patients without flares in the past 3 months (p=0.019), and in 61 of 82 (74.4%) patients with flares in the past 12 months versus 44 of 70 (62.9%) patients without flares in the past 12 months (p=0.16).
Summary of MSU crystal deposition on DECT according to palpable tophus status and sUA level

Dual-energy CT image examples. (A) Patient with sUA 8.5 mg/dL, tophi present, total urate volume 19.53 cm3. Green indicates urate; blue indicates cortical bone; purple indicates trabecular bone. (B) Patient with sUA 5.6 mg/dL, tophi absent, total urate volume 0.52 cm3. sUA, serum urate.
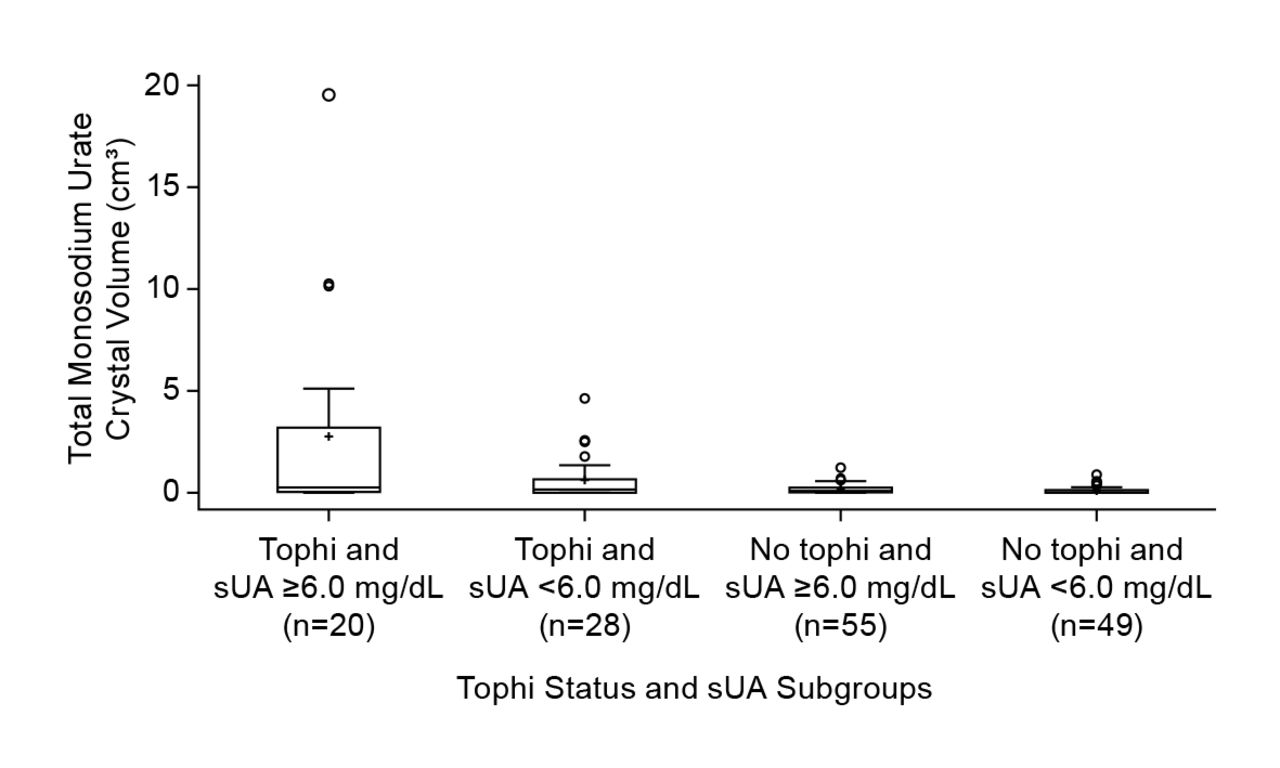
The median total volume of crystal deposition in patients with deposits was 0.16 cm3 (range: 0.01–19.53 cm3). The median and mean total volume of crystal deposition were higher in patients with palpable tophi and lower in patients without palpable tophi (table 2, figure 3). The median total volume of crystal deposition was similar in the hands/wrists, feet/ankles/Achilles and knees at 0.00 cm3 (range: 0.0–3.4 cm3), 0.02 cm3 (range: 0.0–5.4 cm3) and 0.02 cm3 (range: 0.0–18.8 cm3), respectively.

Box plot of mean total volume of monosodium urate crystal deposition by tophus status and sUA at baseline. +, group means; o, values outside 1.5xIQR. sUA, serum urate.
Joint erosions were detected by DECT in the feet/ankles in 110 of 152 (72.4%) patients. The median number of erosions was higher in patients with palpable tophi than in those without (3 and 1, respectively) and in patients with sUA ≥6.0 mg/dL vs <6.0 mg/dL (3 and 2, respectively).
Greater total volume of MSU crystal deposition was associated with presence of palpable tophi (compared with no tophi), sUA ≥6.0 mg/dL (compared with <6.0 mg/dL), ≥1 gout flares in the past 3 or 12 months (compared with no gout flares) and allopurinol dose >300 mg (compared with 300 mg) (table 3). The total volume of crystal deposition also tended to increase with increasing number of palpable tophi locations (none, 1, 2 or >2) (table 3).
Association between total volume of MSU crystal deposition and baseline characteristics
Patients self-reported low levels of pain and disease activity, with high levels of disease control, at baseline and follow-up visit. Median scores on day 1 and follow-up visit were 0.0 and 0.0 for Pain Assessment, 1.0 and 0.0 for Global Impression of Disease Activity and 9.0 and 9.0 for Patient Impression of Disease Control. Median scores on day 1 and follow-up visit were 2.0 and 2.0 for Physician-reported Global Impression of Disease Activity and 8.0 and 8.0 for Impression of Disease Control.
The Patient Global Impression of Disease Activity and the Patient Impression of Disease Control score on day 1 were, respectively, positively (r=0.31, p=0.0001) and negatively (r=–0.25, p=0.002) correlated with the total volume of MSU crystal deposition, while the Pain Assessment score on day 1 was unrelated to total volume of crystal deposition (r=0.08, p=0.34) (online supplementary table 1).
Supplementary file 1
The physician-reported Global Impression of Disease Activity and the Impression of Disease Control score on day 1 were, respectively, positively (r=0.21, p=0.01) and negatively (r=–0.33, p<0.0001) correlated with the total volume of MSU crystal deposition (table 5).
Higher prevalence of joint erosions in the feet/ankles was associated with male (compared with female) sex, presence of palpable tophi (compared with no tophi) and allopurinol dose >300 mg (compared with 300 mg) (online supplementary table 2).
The prevalence of erosions in the feet/ankles was positively associated with the total volume of MSU crystal deposition (Spearman correlation coefficient, r=0.33, p<0.0001) and the volume of crystal deposition in the feet/ankles/Achilles (r=0.34, p<0.0001).
Discussion
In this prospectively recruited, multicentre study, we found that a substantial proportion of patients with gout (69.1%) had crystal deposition on DECT scans, despite being treated with allopurinol at a stable dose of 300 mg or more daily for a mean of 5.1 (SD 6.9) years. The prevalence and total volume of crystal deposition were greater in patients with sUA ≥6.0 mg/dL, supporting the importance of sUA control as a primary treatment target. However, crystal deposits were present in almost one-half of patients with sUA below the target of 6.0 mg/dL and without palpable tophi, suggesting that a more intensive sUA-lowering target than recommended in current guidelines may be needed to reduce the total body urate burden.
The results of our study are consistent with previous reports demonstrating that DECT can identify subclinical tophi in patients both with and without symptomatic gout.11 17 Almost half of the patients with sUA at target and no palpable tophi in our study also had MSU crystal deposition. In addition, higher MSU crystal deposition on DECT was associated with more flares, tophi and greater severity as measured by patient-reported outcomes. Collectively, these findings suggest that DECT may have clinical benefit in assessing the need for more intensive urate-lowering therapy in individual patients.
Crystal deposition was more common in patients with flares compared with patients without flares in the past 3 months (83.3% vs 63.6%), in support of the observed relationship between crystal deposition and disease severity. Although crystal volumes were higher in those with flares in the preceding 12 months, the presence of any crystal deposition was not more common in this group. All participants were on allopurinol, and a single measure of urate crystal deposition may not reflect crystal burden for up to a year before in patients on urate-lowering therapy.
Patient and physician-reported assessments indicated generally low levels of disease activity and pain and well-controlled disease. Nevertheless, the Patient Global Impression of Disease Activity was positively associated with MSU total crystal volume, while the Patient Impression of Disease Control score was negatively associated with crystal volume. These outcomes add further support to the validity and clinical relevance of the DECT findings.
DECT-detected joint erosions in the feet/ankles were present in the majority of patients (72.4%), especially those with characteristics of higher disease severity: greater allopurinol dose (>300 mg vs 300 mg) and presence of palpable tophi. Erosions were associated more commonly with males than females, although this is difficult to interpret given the small number of women in the study. Not unexpectedly, joint erosions were also associated with the presence of MSU crystal deposition.
Strengths and potential limitations of our study deserve comment. Our study prospectively scanned anatomical sites most commonly affected by the clinical features of gout24 with the use of a centralised reading centre with two DECT radiologists. We also correlated the DECT findings with patient and physician-reported outcomes. We adopted enrolment restrictions to ensure the study population provided data across a range of sUA levels and numbers of tophi; however, this could have impacted the generalisability of study outcomes to other patient groups. In addition, our study was cross-sectional and therefore not capable of identifying temporal changes in the correlations we observed. Greater total volume of crystal deposition was also associated with allopurinol doses>300 mg vs 300 mg, which likely reflects the presence of more severe disease and recognition of the need for a higher dose (ie, confounding by indication). Finally, our study included a limited number of female subjects; further studies among females would be valuable.
In conclusion, this DECT study of allopurinol-treated patients with gout demonstrates that the number and total volume of MSU crystal depositions are higher in those with evidence of greater disease severity: more frequent flares and tophi and higher sUA. However, even patients who can be categorised as having ‘controlled’ gout, that is, with sUA at target levels and no palpable tophi, have frequent evidence of crystal deposition (46.9% in this study). DECT imaging may be of benefit in patients with gout to assess the need for more intensive urate-lowering therapy.
Acknowledgments
None
References
Footnotes
Handling editor Tore K Kvien
Contributors Criterion 1: (a) substantial contributions to study conception and design; and/or (b) substantial contributions to acquisition of data; and/or (c) substantial contributions to analysis and interpretation of data. Criterion 2: drafting the article or revising it critically for important intellectual content. Criterion 3: final approval of the version of the article to be published. ND: 1a, 1b, 1c, 2, 3. SN: 1a, 1b, 1c, 2, 3. SB: 1a, 1b, 2, 3. JH: 1a, 1b, 1c, 2, 3. MF: 1a, 1bb, 1c, 2, 3. HK: 1a, 1b, 1c, 2, 3.
Funding This clinical study was funded by AstraZeneca. The study sponsor had a role in the design and conduct of the study; collection, management, analysis, and interpretation of the data; and review and approval of the manuscript. Editorial support for this manuscript was provided by Bill Wolvey of PAREXEL, which was funded by AstraZeneca.
Competing interests ND, grant support from AstraZeneca, participated on speaker bureaus for Menarini, AstraZeneca, Takeda and advisory boards for AstraZeneca, Fonterra, Takeda, Pfizer, Cymabay, and Crealta. SN, University of British Columbia has an MRA with Siemens Healthcare. SB, JH and MF, formerly full-time employees of Ardea Biosciences, a member of the AstraZeneca Group. HKC, grant support from AstraZeneca, consulting fees from Takeda and consulting fees from Selecta.
Patient consent Obtained.
Provenance and peer review Not commissioned; externally peer reviewed.