Article Text

Abstract
Objective To evaluate the associations between (1) antidrug antibody (ADAb) and therapeutic response, (2) ADAb and serum drug trough levels and (3) serum drug levels and therapeutic responses in rheumatoid arthritis (RA) patients receiving adalimumab or etanercept. Secondarily, we aim (1) to evaluate the concordance between radioimmunoassay and bridging ELISA for ADAb assessment and to evaluate the correlation between two different ELISA methods for detecting drug levels, and (2) to determine the optimal cut-off drug levels for good European League Against Rheumatism (EULAR) response.
Methods ADAb levels were determined by bridging ELISA and radioimmunoassay, and drug levels evaluated using sandwich ELISA among 36 adalimumab-treated patients and 34 etanercept-treated patients at the 6th and 12th month. The optimal cut-off drug levels for EULAR responses were determined by receiver-operating characteristic curve analysis.
Results ADAb was detected in 10 (27.8%) and 13 (36.1%) of adalimumab-treated patients after 12-month therapy using bridging ELISA and radioimmunoassay respectively, but not detected in any of etanercept-treated patients. The presence of ADAb was associated with lower EULAR response and lower drug levels compared with those without ADAb (both p<0.001). Drug trough levels were positively associated with DAS28 decrement (ΔDAS28) (all p<0.001). The optimal cut-off trough levels for adalimumab were 1.274 μg/mL and 1.046 μg/mL, and those for etanercept were 1.242 μg/mL and 0.800 μg/mL for good EULAR response assessed at the 6th and 12th month, respectively.
Conclusions ADAb levels were inversely correlated with therapeutic response and drug levels. The positive correlation between drug levels and ΔDAS28 indicates that drug monitoring would be useful to evaluate therapeutic response of TNF-α inhibitors.
- Rheumatoid Arthritis
- Treatment
- TNF-alpha
Statistics from Altmetric.com
Background
Rheumatoid arthritis (RA) is characterised by synovial inflammation and hyperplasia, cartilage degradation and bone erosions.1 Tumour necrosis factor (TNF)-α is a crucial inflammatory mediator in synovitis and subsequent tissue damage in RA.2 ,3 Although anti-TNF-α therapy can be effective and well tolerated for RA patients,4––6 not all patients respond to them from the start (primary failure) and the effectiveness diminishes in some patients over time (secondary failure).7 The exact mechanism of the inadequate response to anti-TNF-α therapy has not been fully explored.8––10
TNF-α inhibitors can elicit immunogenic responses, including the emergence of antidrug antibodies (ADAb), which results in changes of pharmacokinetics.11 ,12 Several studies indicate that the immunogenicity may be associated with low or undetectable drug levels and reduced therapeutic response to TNF-α inhibitors.13––18 Concomitant administration of immunosuppressive agents, such as methotrexate (MTX), reduces immunogenicity.14 ,17 ,18 Because ADAb to one TNF-α inhibitor are specific and do not cross-react with another different TNF-α inhibitor, RA patients with secondary response failure to one TNF-α inhibitor may benefit from a switch to another TNF-α inhibitor.15 ,16
Several different methods have been used to assess ADAb, but these assays have their own advantages and disadvantages,19––21 and scanty information on the clinical potential of these assays has been reported. Moreover, there are limited data regarding the association of ADAb levels with serum drug levels and therapeutic response.14 ,22 ,23 There have also been few studies that examined the optimal cut-off trough levels of etanercept and adalimumab in terms of therapeutic response.24 ,25
The main objective of this study was to evaluate the associations between (1) ADAb and therapeutic response, including low-disease activity and European League Against Rheumatism (EULAR) responses; (2) ADAb levels and MTX dosages or serum drug trough levels; and (3) serum drug trough levels and therapeutic responses in RA patients receiving adalimumab or etanercept. Secondarily, we aim (1) to evaluate the concordance grade between radioimmunoassay (RIA) and bridging ELISA for ADAb assessment and to evaluate the correlation between two different sandwich ELISA methods for detecting drug levels, and (2) to determine the optimal cut-off drug trough level for a good EULAR response.
Patients and methods
Patients
Seventy biologic-naïve patients (62 women and 8 men; mean age±SD, 56.9±12.3 years) who fulfilled the 1987 revised criteria of the American College of Rheumatology for RA26 started anti-TNF-α therapy according to the guidelines of the British Society for Rheumatology.27 Thirty-four patients received etanercept at a dose of 25 mg twice weekly and 36 patients received adalimumab at a dose of 40 mg every other week, with or without concomitant MTX at a stable dose of 7.5–15 mg weekly. Disease activity was assessed by the 28-joint disease activity score (DAS28) at baseline, and at the 6th and 12th month of anti-TNF-α therapy, respectively.28 Low-disease activity was defined as DAS28 ≤ 3.2. The therapeutic response was evaluated after 6 and 12 months of anti-TNF-α therapy using the EULAR response criteria.29 Patients were categorised as good, moderate or poor responders based on the amount of change in the DAS28 and the level of DAS28 reached. Good responders were defined as patients who had a decrease in DAS28 from baseline (ΔDAS28)>1.2 and a DAS28 ≤ 3.2 at evaluation time; moderate responders had either ΔDAS28>1.2 and a DAS28 > 3.2 or ΔDAS28 of 0.6–1.2 and a DAS28 ≤ 5.1 at evaluation time; and poor responders were those who had either ΔDAS28 < 0.6 or a DAS28>5.1 at evaluation time. Blood samples were obtained immediately before etanercept or adalimumab injection at 6 and 12 months of anti-TNF-α therapy. The Ethics Committee of Taichung Veterans General Hospital approved this study, and the written consent of each participant was obtained.
Assessments of antibodies against adalimumab or etanercept
Antibodies against adalimumab and etanercept were detected by bridging ELISA (Progenika Biopharma SA, Derio, Spain) at 6 and 12 months of anti-TNF-α therapy. This assay measures serum levels of free ADAb but lacks sensitivity towards IgG4-ADAb because only the bivalent fraction will be detected.30 The details on this assay are added as online supplementary text.
Antibodies against adalimumab or etanercept were also detected by RIA (Sanquin Diagnostic Services, Amsterdam, The Netherlands) as described previously19 ,20 at 12 months of anti-TNF-α therapy. This assay measures both IgG1 and IgG4 ADAb using an antigen binding test (ABT). Test results were converted into arbitrary units per millilitre (AU/mL) by comparison with dilutions of a reference serum. Patients were defined as positive for anti-adalimumab antibodies if the levels were greater than 12 AU/mL in combination with serum adalimumab levels less than 5.0 mg/L assessed by an ELISA from Sanquin Diagnostic.14 ,20 Similarly, patients were defined as positive for anti-etanercept antibodies if the levels exceeded 12 AU/mL.
Determination of serum trough levels of adalimumab or etanercept
Serum trough levels of adalimumab and etanercept were determined using sandwich ELISA according to the manufacturer's instructions (Progenika Biopharma SA, Derio, Spain) at 6 and 12 months of anti-TNF-α therapy. Serum levels of adalimumab and etanercept were also detected at 12 months of anti-TNF-α therapy by using another ELISA method (Sanquin Diagnostic Services, Amsterdam, The Netherlands) as described previously31 based on the principle that adalimumab or etanercept is captured through their capacity to bind TNF-α. The details on these assays are added as online supplementary text.
Determination of the optimal cut-off trough levels for a good EULAR response
Because serum drug trough levels are positively associated with therapeutic response, a search for the optimal cut-off level for TNF-α inhibitors is important for clinical practice. The optimal drug cut-off level for a good EULAR response was determined using receiver-operating characteristic (ROC) curve analysis.
Statistical analysis
Results are presented as the mean±SD or median (IQR). A Fisher's exact test was used for between-group comparisons of ADAb positivity and therapeutic responses. The Kruskal–Wallis test was used for among-group comparison of drug levels in patients with negative or positive ADAb and in EULAR good, moderate and poor responses. When this test showed significant differences, the exact p values were then determined using the Mann–Whitney U test. We assessed the concordance grade between bridging ELISA and RIA for detecting ADAb using the χ2 tests. The nonparametric Spearman's correlations were determined between (1) ADAb levels and improvement of activity scores (ΔDAS28), MTX dosages, or drug trough levels; (2) two different sandwich ELISA methods for detecting drug levels; and (3) drug trough levels and ΔDAS28. The diagnostic sensitivity, specificity and area under ROC curve (AUC) were determined using MedCalc statistical software V.9.3 (MedCalc Software, Belgium, China). A probability of less than 0.05 was considered significant.
Results
Clinical characteristics of RA patients
The majority of RA patients were women, and all patients had active disease (DAS28, mean±SD, 6.02±0.69). Although etanercept-treated patients were older, there were no significant differences in the positive rate of rheumatoid factor and anticyclic citrullinated peptide antibodies, daily dose of corticosteroids or proportion of the used DMARDs between the adalimumab-treated and etanercept-treated patients (table 1).
Baseline demographic data, clinical characteristics and laboratory findings in rheumatoid arthritis (RA) patients receiving therapy with adalimumab or etanercept*
ADAb levels and their relation to therapeutic response
In 36 adalimumab-treated patients, 8 (22.2%) and 10 (27.8%) were positive for ADAb detected by bridging ELISA at 6 and 12 months of therapy, respectively, while 13 (36.1%) were positive for ADAb using RIA at 12 months of therapy (table 2). After 12 months of adalimumab treatment, ADAb levels in three patients (38, 64 and 180 AU/mL) could be detected by RIA but not by bridging ELISA. The overall agreement between bridging ELISA and RIA was excellent, with a Cohen's kappa coefficient of 0.810 (p<0.001). After 6 and 12 months of etanercept therapy, no patient developed anti-etanercept antibodies.
Antidrug antibodies (ADAb) against adalimumab or etanercept and serum drug trough levels in rheumatoid arthritis patients receiving 6 months and 12 months of anti-tumour necrosis factor-α therapy according to therapeutic responses
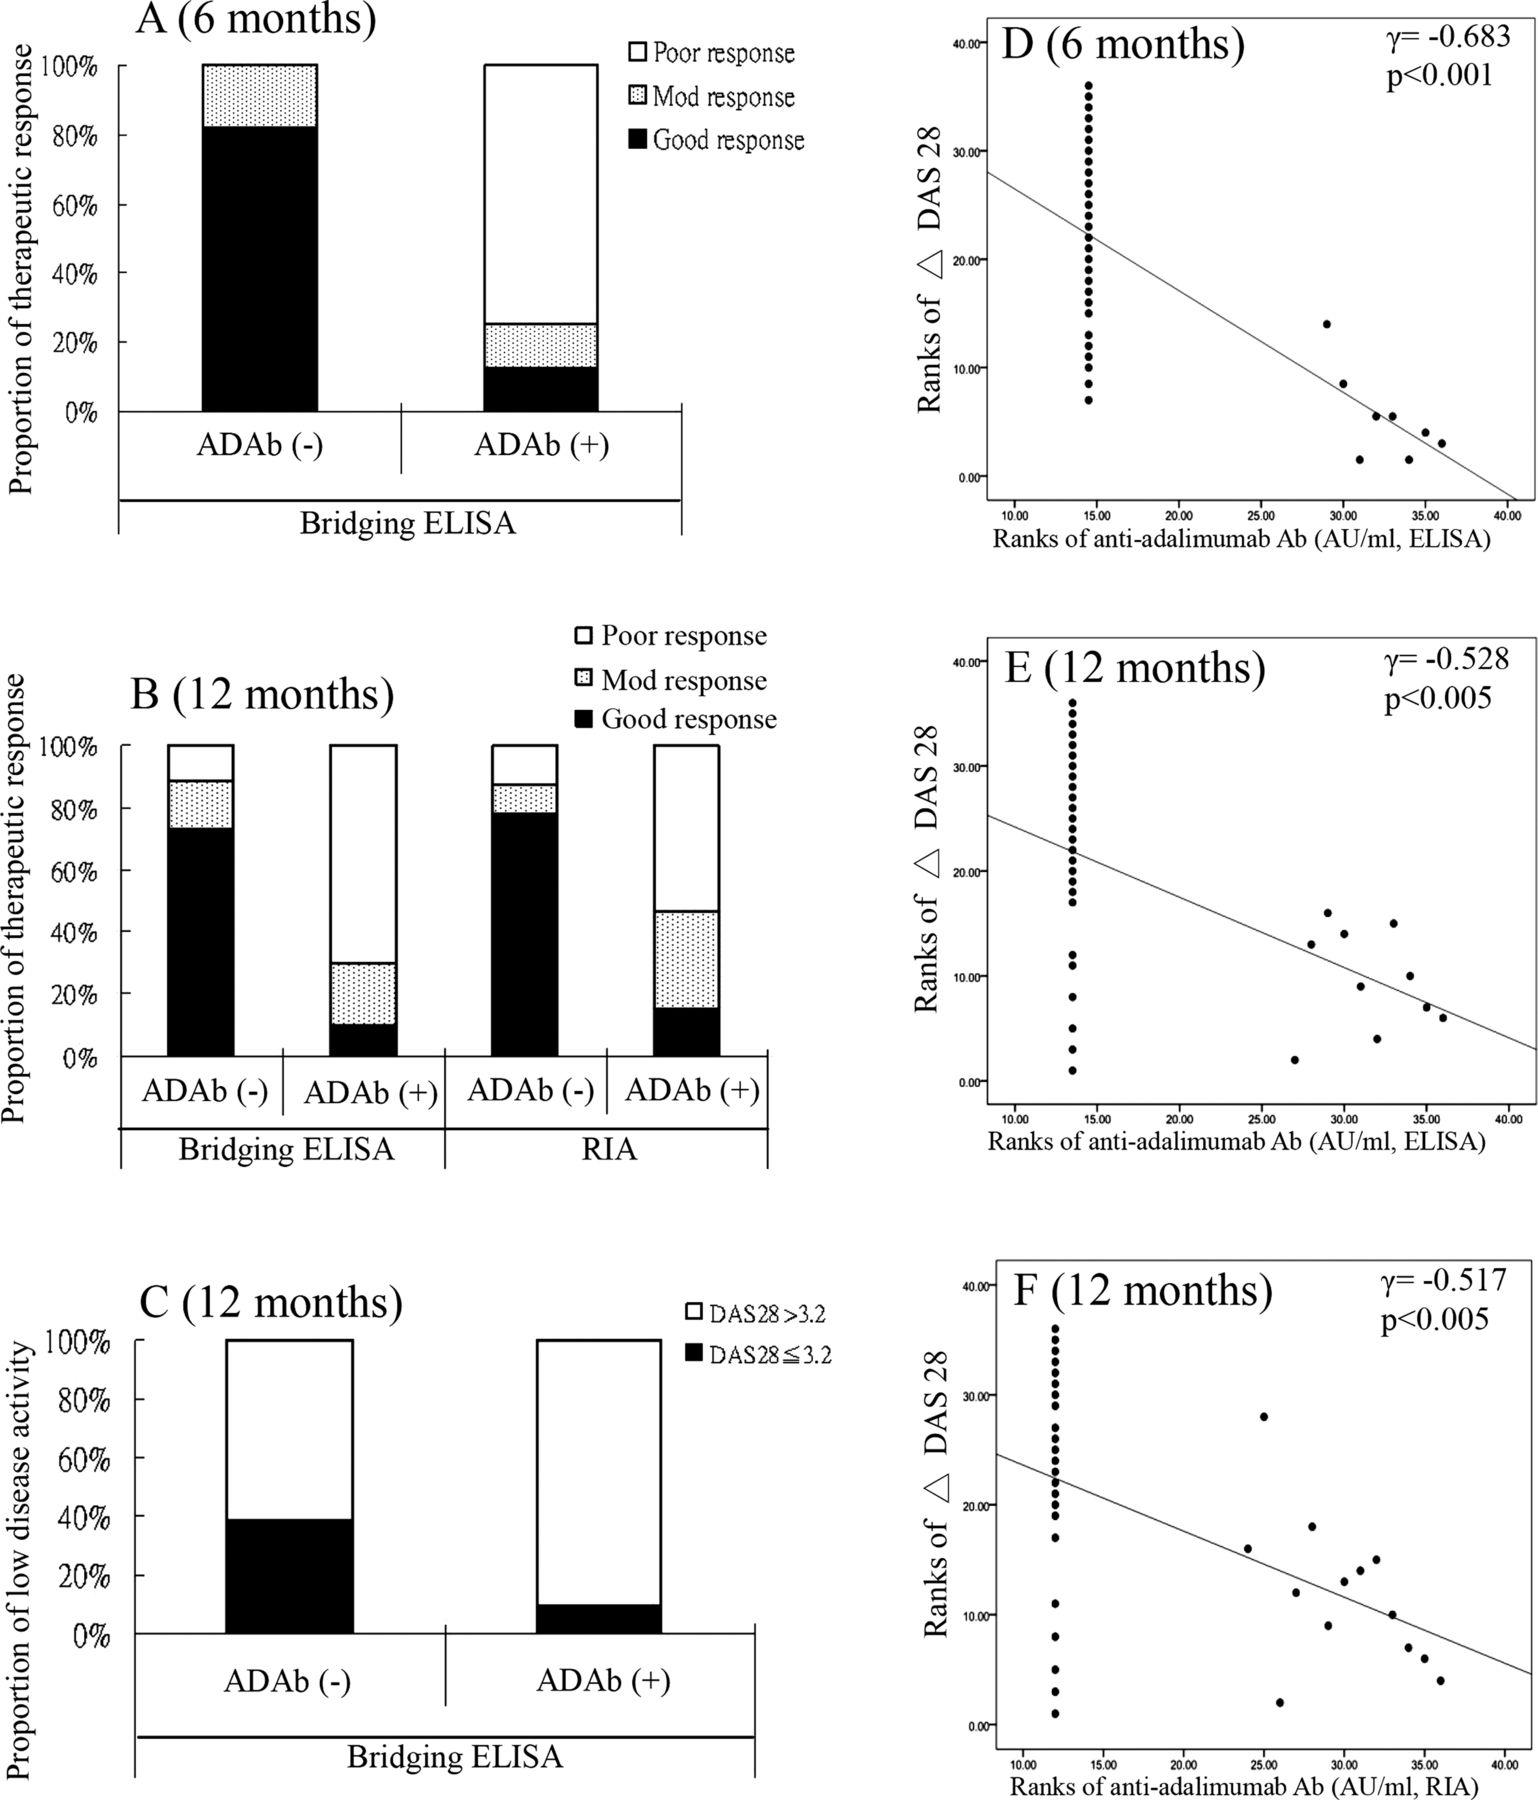
When compared with adalimumab-treated patients with negative ADAb (bridging ELISA), those with positive ADAb had significantly higher rates of a poor EULAR response (75% vs 0% at the 6th month and 70% vs 11.5% at the 12th month, both p<0.001), and lower rates of achieving low-disease activity (DAS28 ≤ 3.2) (10% vs 38.5% at the 12th month, p=0.127; figure 1A–C). There was an inverse correlation between ADAb levels and ΔDAS28 (correlation coefficients, r=−0.683, p<0.001; r=−0.528, p<0.005, detected by bridging ELISA at the 6th and 12th month, respectively; and r =−0.517, p<0.005, detected by RIA at the 12th month; figure 1D–F). In addition, MTX dosages were inversely correlated with ADAb levels (r=−0.503, p<0.005; r=−0.591, p<0.001, detected by bridging ELISA and RIA, respectively, at 12 months of anti-TNF-α therapy).

The association of antidrug antibody (ADAb) levels with EULAR response assessed at the 6th month (A) and at 12th month (B) and with the proportion of achieved low-disease activity at the 12th month (C) was determined by Fisher's exact test. The correlation between ADAb levels and therapeutic response (ΔDAS28) assessed at the 6th month (D) and 12th month (E and F) was obtained by the Spearman rank correlation test. EULAR, European League Against Rheumatism; good EULAR responders are defined as patients who have a decrease in DAS28 from baseline (ΔDAS28)>1.2 and a DAS28≤3.2; moderate responders have either ΔDAS28 Δ 1.2 and a DAS28>3.2 or ΔDAS28 0.6–1.2 and a DAS28≤5.1; and poor responders are those who have either ΔDAS28<0.6 or a DAS28>5.1. Low-disease activity was defined as DAS28≤3.2; RIA, radioimmunoassay.
ADAb levels and their relation to serum drug trough levels
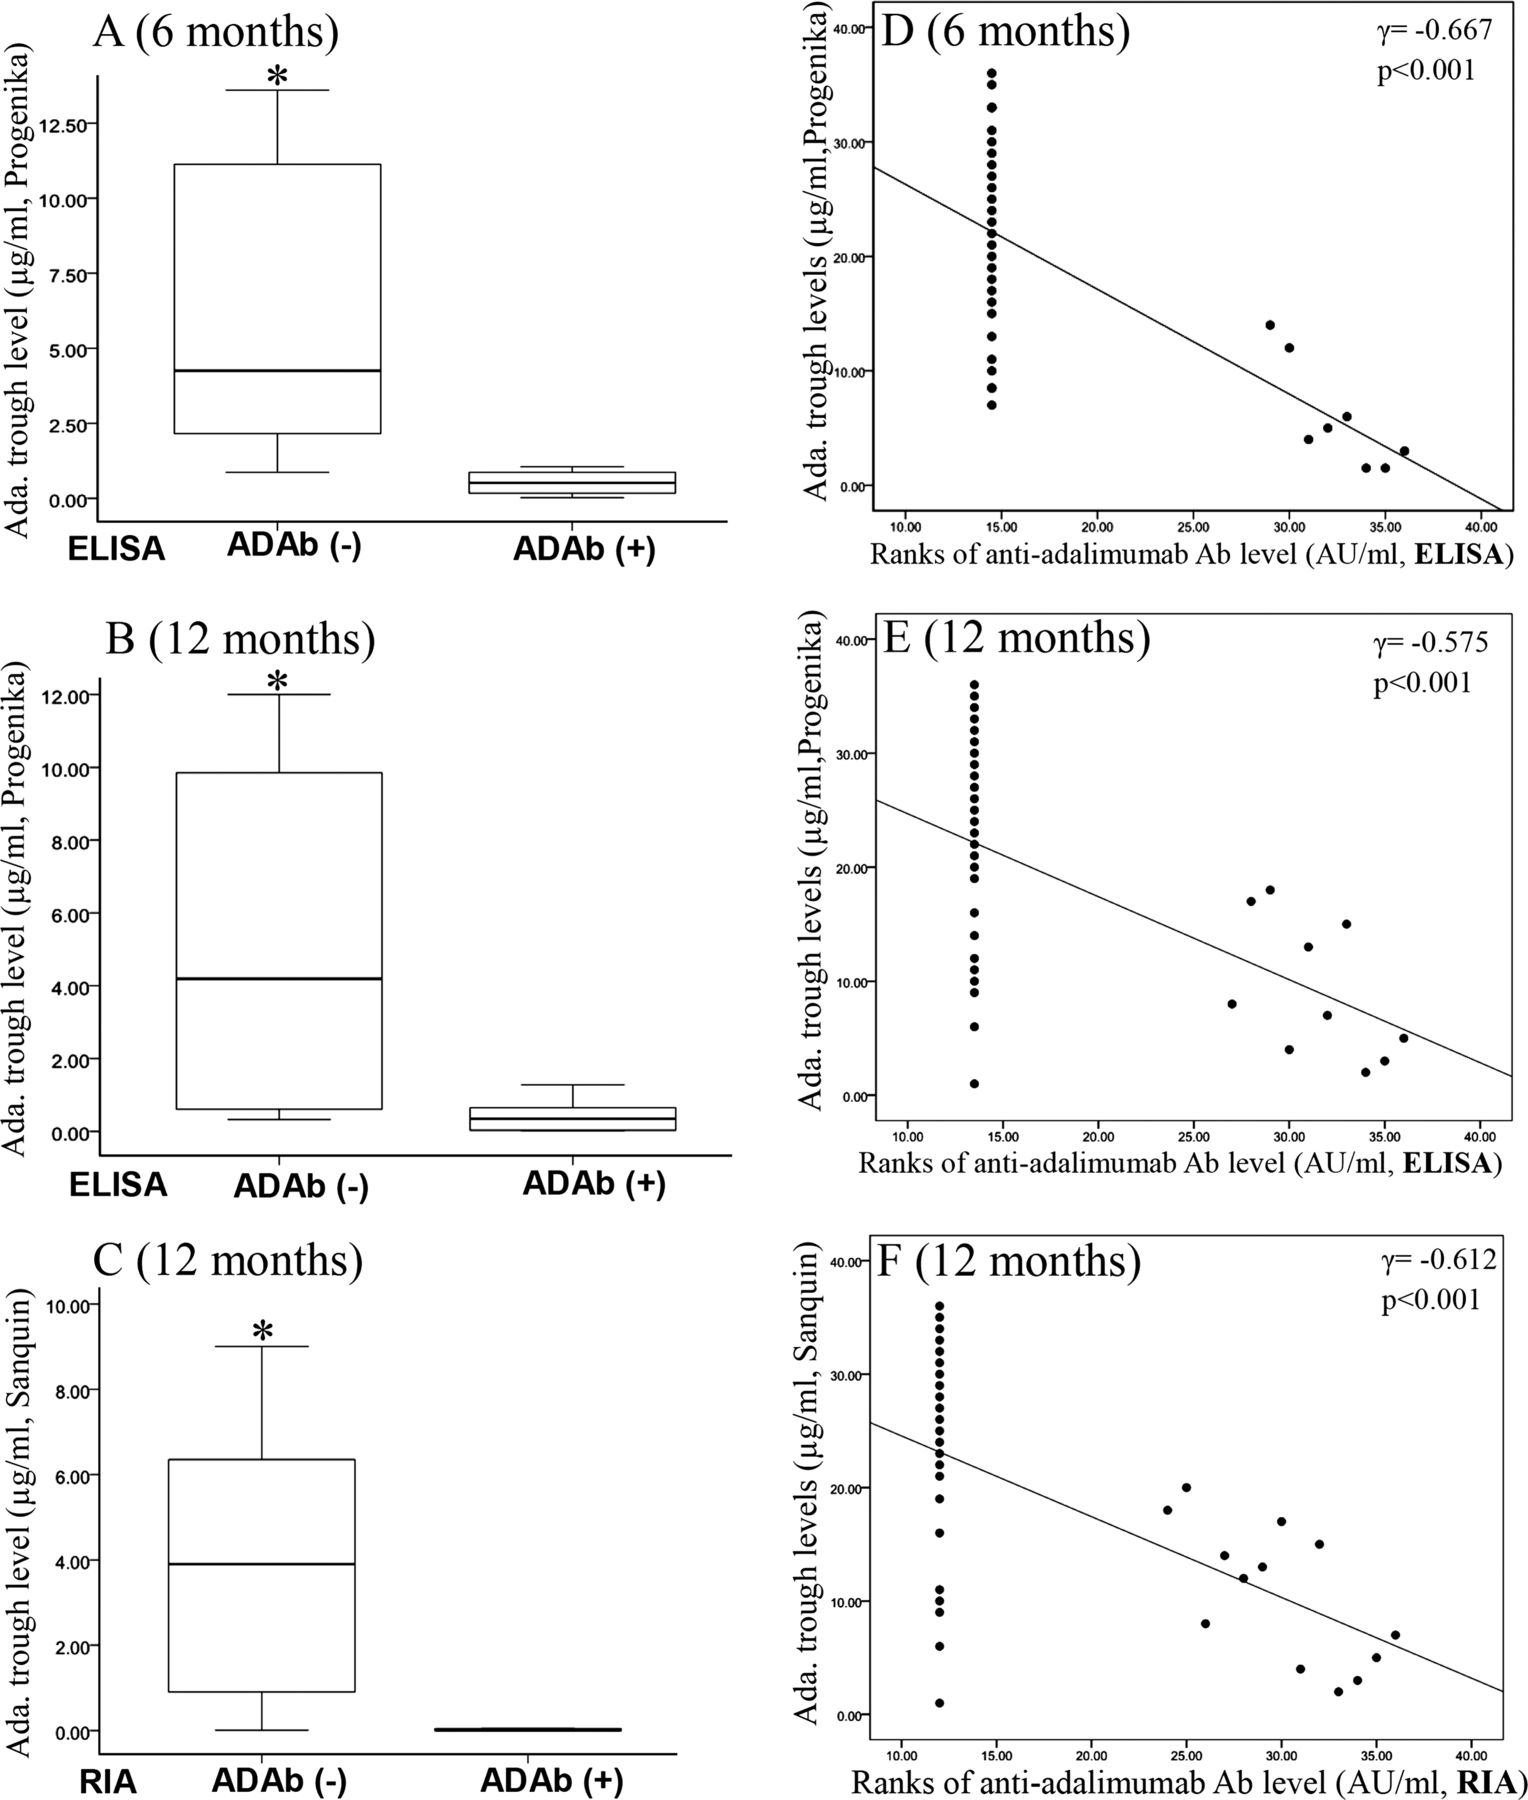
Patients with negative ADAb (bridging ELISA) had significantly higher drug levels at the 6th and 12th month (median=4.25 μg/mL, IQR 2.03–11.20 μg/mL and median=4.19 μg/mL, IQR 0.58–9.87 μg/mL, respectively) compared with those with positive ADAb (median=0.51 μg/mL, IQR 0.10–0.95 μg/mL and median=0.35 μg/mL, IQR 0.02–0.68 μg/mL, both p<0.001, respectively; figure 2A,B). Similarly, patients with negative ADAb (RIA) had significantly higher drug levels at the 12th month (median=3.90 μg/mL, IQR 0.80–6.60 μg/mL) compared with those with positive ADAb (median=0.00 μg/mL, IQR 0.00–0.07 μg/mL, p<0.001; figure 2C). Moreover, there was an inverse correlation between ADAb levels (bridging ELISA) and drug trough levels (Progenika) (r=−0.667, p<0.001; r=−0.575, p<0.001, at the 6th and 12th month, respectively; figure 2D,E). Similarly, there was an inverse correlation between ADAb levels (RIA) and drug trough levels (Sanquin) at the 12 months of anti-TNF-α therapy (r=−0.612, p<0.001; figure 2F). In the present study, there was a significant and high correlation between two different ELISA methods (Progenika and Sanquin) for detecting adalimumab trough levels (r=0.875, p<0.001) and etanercept trough levels (r=0.703, p<0.001).

Comparison of drug trough levels between adalimumab-treated patients with negative ADAb (ADAB (−)) and positive ADAb (ADAb (+)) examined at the 6th month (A) and 12th month (B, C). The data are presented as box-plot diagrams, with the box encompassing the 25th centile (lower bar) to the 75th centile (upper bar). The horizontal line within the box indicates median value, and the horizontal lines above and below the box represent the maximum and minimum values respectively for each group. *p<0.001, vs patients with ADAb (+), determined by the Mann–Whitney U test. The correlation between ADAb levels and serum drug trough levels examined at the 6th month (D) and 12th month (E and F) was determined by the Spearman rank correlation test. Ada., adalimumab.
Serum drug trough levels and their relation to EULAR response
As illustrated in table 2 and figure 3A,B, serum adalimumab trough levels were significantly higher in good EULAR responders than in moderate or poor EULAR responders. Similarly, serum etanercept trough levels were significantly higher in good EULAR responders than in moderate or poor EULAR responders. There was a positive correlation between drug levels and ΔDAS28 in both adalimumab-treated and etanercept-treated patients (figure 3C–F). In five etanercept-treated patients who had detectable drug levels and a good EULAR response assessed at the 6th month, their drug levels significantly declined with a loss of initial response after an extended interval of therapy at a dose of 25 mg once weekly or 25 mg every other week. In three adalimumab-treated patients who had detectable drug levels and a good EULAR response assessed at the 6th month, their drug levels declined with a loss of initial response after an interval extension to adalimumab once monthly, which was confirmed by asking these patients.

Comparison of serum drug trough levels among different European League Against Rheumatism (EULAR) responses assessed at the 6th and 12th month in adalimumab-treated patients (A) and in etanercept-treated patients (B). The data are presented as box-plot diagrams, with the box encompassing the 25th centile (lower bar) to the 75th centile (upper bar). The horizontal line within the box indicates median value, and the horizontal lines above and below the box represent the maximum and minimum values respectively for each group. ***p<0.001, **p<0.01, *p<0.05, vs moderate EULAR responders; ##p<0.001, #p<0.01, vs poor EULAR responders, determined by the Mann–Whitney U test. The correlation between serum drug levels and therapeutic response (ΔDAS28) assessed at the 6th and 12th month in adalimumab-treated patients (C and E, respectively) and in etanercept-treated patients (D and F, respectively) was determined by the Spearman rank correlation test. Receiver-operating characteristic (ROC) curves analysis for the determination of the optimal drug cut-off levels for good EULAR response assessed at the 6th month (G and H) and 12th month (I and J) in adalimumab-treated patients and etanercept-treated patients, respectively. p value was determined by the χ2 test with Yate's correction of contingency. AUC, area under ROC curve; sen., sensitivity; spe., specificity.
Optimal drug cut-off levels for a good EULAR response using ROC curve analysis
With ELISA (Progenika) for detecting drug trough levels, the optimal adalimumab cut-off level for good EULAR responders at 6 months was 1.274 μg/mL with high sensitivity (90%) and specificity (100%), and the optimal etanercept cut-off level was 1.242 μg/mL with high sensitivity (80.8%) and specificity (100%) (figure 3G,H). The optimal adalimumab cut-off level for good EULAR responders at 12 months was 1.046 μg/mL with high sensitivity (100%) and specificity (100%), and the etanercept cut-off level was 0.800 μg/mL with sensitivity (85.7%) and specificity (84.6%) (figure 3I,J). With ELISA (Sanquin) for detecting serum drug levels at 12 months of therapy, the optimal adalimumab cut-off level was 0.801 μg/mL with high sensitivity (95%) and specificity (100%) for good EULAR responders, and the etanercept cut-off level was 0.700 μg/mL with high sensitivity (84%) and specificity (100%) for good EULAR responders.
Discussion
In the present study, ADAb was detected by bridging ELISA in 8 (22.2%) and 10 (27.8%) of adalimumab-treated patients at 6 and 12 months of therapy, respectively, and in 13 (36.1%) at 12 months of therapy using RIA. However, ADAb was not detected in any of etanercept-treated patients. Patients with positive ADAb had significantly lower rates of a good EULAR response as well as achieving low-disease activity, and had lower drug trough levels than those with negative ADAb. Serum drug trough levels were positively associated with therapeutic responses in patients receiving anti-TNF-α therapy. With ELISA (Progenika) for detecting drug levels, the optimal adalimumab cut-off level for a good EULAR response assessed at 6 and 12 months of therapy was 1.274 μg/mL and 1.046 μg/mL, respectively, and that for etanercept were 1.242 μg/mL and 0.800 μg/mL, respectively. With ELISA (Sanquin) for detecting drug levels at 12 months of therapy, the optimal adalimumab cut-off level was 0.801 μg/mL and the etanercept cut-off level was 0.700 μg/mL for a good EULAR response. Although there was a difference in cut-off level between the two different ELISA methods used for drug levels, a good correlation between drug trough levels assessed by both methods was observed.
Although various rates of ADAb positivity have been reported in adalimumab-treated patients,9 ,14 ,18 ,23 ,32 ,33 the proportion of ADAb-positive patients in this study was consistent with the results of some other studies.9 ,14 ,33 The variability reported in previous studies might be related to the methods used. Although there is a good concordance between the two different assays used in this study, ADAb levels in three patients were detected by RIA but not by bridging ELISA, one of whom even had high ADAb level (180 AU/mL). The possible cause might be that this ADAb was IgG4 isotype, which could only be verified by IgG4-spcific ABT30 but not assessed in our study. These observations support the proposition that RIA seems to be a more precise assay than bridging ELISA in detecting ADAb.9 ,13 ,14 ,34 Besides, MTX dosages were inversely correlated with ADAb levels in our patients, as also demonstrated by other studies in which MTX reduced immunogenicity in a dose-dependent manner.32 ,35
In contrast to the high proportion of adalimumab-treated patients developing ADAb, anti-etanercept antibodies were not detected in any of our etanercept-treated patients. This finding is consistent with previous studies that anti-etanercept antibodies were measured in less than 5% of RA patients36––39 and supports the findings of a higher drug survival for etanercept than for adalimumab.39 The disparity in the rates of ADAb induction between both drugs may be explained by their differences in pharmacokinetics, chemical structures and the stability of the TNF-α/anti-TNF-α complex.40 ,41
Consistent with previous studies,9 ,14 ,18 ,42 the presence of ADAb was associated with a reduced therapeutic response assessed at the 6th and 12th month in our patients. When compared with adalimumab-treated patients with negative ADAb, those with positive ADAb had significantly higher rates of a poor EULAR response and lower rates of achieving low-disease activity (DAS28≤3.2) (figure 1A–C). Moreover, our results showed an inverse correlation between ADAb levels and improvement of disease activity (ΔDAS28). The mechanisms through which the emergence of ADAb hampers therapeutic response may include the formation of immune complexes leading to acceleration of drug clearance10 ,43 or functional neutralisation of the drug through blockage of its binding to the target.10
As found in recent reports,9 ,14 ,23 ,44 our patients with ADAb had significantly lower adalimumab trough levels compared with those without ADAb. We also demonstrated an inverse correlation between ADAb levels and drug trough levels (figure 2). Five ADAb-negative patients have low/undetectable drug levels assessed at 12 months of therapy. Possible contributing factors include therapeutic noncompliance in three patients and immune complexes formed by drug/ ADAbs not detected by current assays. Based on the data of previous reports,22 ,34 a bridging ELISA used for detecting ADAb is also susceptible to drug interference and only measures ADAb in the absence of detectable drug levels.
Despite the absence of ADAb in any etanercept-treated patient, there remained a substantial proportion (20.6%, 7 of 34) of patients for whom etanercept failed to have therapeutic response, as assessed at 12 months of therapy. Among them, five patients initially had adequate drug levels and good response assessed at 6 months of therapy, reflecting the poor therapeutic compliance that was confirmed by asking the patients. In this study, we also observed that three adalimumab-treated patients had therapeutic noncompliance. Therefore, if patients have low or undetectable drug levels in the absence of ADAb, therapeutic noncompliance should be considered. A higher proportion of therapeutic noncompliance seen in etanercept-treated patients (14.7%) than in adalimumab-treated patients (8.3%) might explain our findings that there were no significant differences in EULAR response assessed at the 12th month between adalimumab-treated patients and etanercept-treated patients in spite of the negligible immunogenicity of etanercept.
In agreement with the results of recent studies,13––16 ,23––25 ,33 ,45 drug trough levels in both adalimumab-treated and etanercept-treated patients in our study were positively associated with therapeutic response and DAS28 decrement (figure 3A–F). Therefore, a search for the optimal cut-off level for TNF-α inhibitors is important. Using ROC analysis, we demonstrated patients with an adalimumab trough level above 1.274 μg/mL or an etanercept level above 1.242 μg/mL cut-off value would have a good EULAR response as assessed at 6 months of therapy. Although the data suggest that drug trough levels above the cut-off value may predict a good EULAR response in our patients, it is too early to recommend this for clinical practice until the external validity of those cut-off values can be confirmed in other cohorts. The etanercept cut-off level for predicting clinical response in our study was different from that of prior studies,25 possibly due to the differences in detection methods or patient characteristics such as baseline DAS28, a high proportion of therapeutic noncompliance in our study and genetics associated with varied drug metabolism.
Based on the findings of previous studies,9 ,10 ,14– –16 ,23––25 meta-analyses as well as recommendations18 ,32 ,44 ,46––48 and our results, we recommend an algorithm (figure 4) with an emphasis on therapeutic strategies based on drug trough levels and ADAb positivity for RA patients with different responses to anti-TNF-α therapy. Also, recent reports24 ,25 have proposed that determination of the drug trough level may serve as the front-line evaluation and help to predict therapeutic response. Among patients with an inadequate response to anti-TNF-α therapy, those with drug trough levels above the cut-off value for a good EULAR response and an absence of ADA are more likely to have primary response failure and may benefit from biologics with different mechanisms of action.48––50 For patients with low/undetectable drug levels and positive ADAb, secondary response failure should be suspected, and switching to biologics with less immunogenicity would be more appropriate.16 ,18 ,32 ,46––48 Patients who have low/undetectable drug levels and negative ADAb, drug interference for detecting ADAb, therapeutic noncompliance or rapid clearance of drug should be considered. For those who have an initial good response, but a low/undetectable drug level in the absence of ADAb at 12 months, increasing compliance might be cost effective. Some patients who have inadequate therapeutic responses and undetectable drug levels in the absence of ADAb may benefit from adjusting the dosage of TNF-α inhibitor.45 ,51 However, the merit of increasing the dosage of TNF-α inhibitor requires more evaluation.5 ,14 ,36 Among our patients who had a good EULAR response, 18.4% of adalimumab-treated patients and 14.7% of etanercept-treated patients had persistently high drug levels above the 75th centile of the detectable drug levels at 12 months. Those patients may be eligible for dose reduction, considering the high costs and dose-dependent adverse effects of biologics.48 ,52

Algorithm for therapeutic strategies based on serum drug trough levels and antidrug antibodies (ADAb) levels in rheumatoid arthritis (RA) patients who have different therapeutic responses to tumour necrosis factor (TNF)-α inhibitor. The cut-off drug trough level for a good EULAR response was determined by receiver-operating characteristic curve analysis. *The optimal drug trough levels that call for dose reduction in patients with a good response to TNF-α inhibitors will be determined in the future studies. EULAR, European League Against Rheumatism.
Some limitations in this study should be addressed. The determination of ADAb may be confounded by the circulating drug levels. In this study, we obtained blood samples immediately before drug injection to reduce drug interference. Although the duration of anti-TNF-α therapy may be related to the emergence of ADAb,14 our results were compatible with the positive rate of ADAb in a long-term study of 272 adalimumab-treated patients.14 The sample size may be too small to draw a definitive conclusion regarding the optimal cut-off level for predicting a good therapeutic response. In addition, there is no specific design in this study to define the high drug levels that call for dose reduction in patients with a good response to TNF-α inhibitors. Therefore, further prospective and longitudinal investigation in a large number of subjects is needed.
In conclusion, a positive correlation was shown between drug trough levels and improvement of disease activity in patients receiving anti-TNF-α therapy, indicating that monitoring of drug trough levels would be useful for evaluation of therapeutic response. We also demonstrated an inverse correlation between ADAb levels and drug levels or therapeutic response in adalimumab-treated patients, suggesting the beneficial role of ADAb level in making therapeutic decisions for those with low or undetectable drug levels. The data combining drug levels and ADAb positivity would be a useful guide for physicians to optimise dose regimens and prevent prolonged use of inadequate therapy or overtreatment for those receiving anti-TNF-α therapy.46––50
Acknowledgments
We are grateful to Garcês et al and Vincent et al for devising the excellent original algorithms for therapeutic approach of RA patients receiving anti-TNF-α therapy, which are the major bases of the algorithm presented in this article. The authors also thank the Biostatistics Task Force of Taichung Veterans General Hospital, Taichung, Taiwan.
References
Supplementary materials
Supplementary Data
This web only file has been produced by the BMJ Publishing Group from an electronic file supplied by the author(s) and has not been edited for content.
Files in this Data Supplement:
- Data supplement 1 - Online supplement
Footnotes
-
Handling editor Tore K Kvien
-
Contributors All authors made substantive intellectual contributions to the present study and approved the final manuscript. D-YC conceived of the study, generated the original hypothesis, designed the study, acquired clinical data, analysed data, drafted and revised the manuscript. Y-MC, W-CT and J-CT contributed equally on this work, conceived of the study, generated the original hypothesis and designed the study. Y-HC, C-WH, W-TH and J-LL performed clinical assessments and data acquisition, statistical analysis and revised the manuscript.
-
Competing interests None.
-
Patient consent Obtained.
-
Ethics approval The Ethics Committee of Taichung Veterans General Hospital.
-
Provenance and peer review Not commissioned; externally peer reviewed.