Article Text

Abstract
Objectives To develop and validate a quantitative radiographic scoring system, the Ghent University Scoring System (GUSS), with better ability to detect progression over a shorter period of time in erosive osteoarthritis (OA) of the interphalangeal (IP) finger joints compared with the existing anatomic phase scoring system.
Methods Thirty IP finger joints showing erosive features at baseline or follow-up were selected from 18 patients with erosive hand OA. Posteroanterior radiographs of these joints obtained at baseline, 6 and 12 months—totalling 90 images—were used for the study. All joints were first scored according to the original anatomic phase scoring system. Erosive progression and signs of repair or remodelling were then scored by indicating the proportion of normal subchondral bone, subchondral plate and joint space on an 11-point rating scale (range 0–100 with 10 unit increases). Inter- and intrareader reproducibility was studied using intraclass correlation coefficients (ICCs). Based on the within-variance of two readers, the smallest detectable change (SDC) was calculated and allowed identification of joints with changes above the SDC as ‘progressors’.
Results Longitudinal inter-reader ICC scores rated well for all variables and the total score (ICC 0.86–0.93). To identify ‘real’ change over background noise, a change of at least 40 units on the total score (range 0–300) over 12 months (SDC 0–12:36.0), and 50 units over 6 months (SDC 0–6:47.6) had to be present. 60% of the 30 joints were identified as ‘progressors’ over 6 months compared with 33.3% with the classical anatomical scoring system, and 70% versus 56.6%, respectively, over 12 months.
Conclusion GUSS, is a reliable method to score radiographic change over time in erosive IP OA and detects more progression over a shorter period of time than the classical scoring system.
This paper is freely available online under the BMJ Journals unlocked scheme, see http://ard.bmj.com/info/unlocked.dtl
Statistics from Altmetric.com
Introduction
Erosive osteoarthritis (OA) is an inflammatory subset of interphalangeal (IP) finger joint OA, in which marked tissue destruction is followed by episodes during which the affected tissues are remodelled.1,–,4 Although erosive hand OA remains a debated entity, hand joints exhibiting a subchondral bone collapse can be qualified as ‘erosive’ hand OA joints. Radiological imaging is currently the standard method to study hand OA progression and erosive IP finger joint OA needs to be studied apart from non-erosive hand OA.5 The progressive nature and the successive pathological changes in osteoarthritic IP finger joints have been documented in detail.6
On the radiographs, erosive changes in the affected IP joints include the disappearance of parts of the joint space followed by, or concurrently with, the appearance of substantial osteolytic areas in the subchondral bone and the subchondral plate. Alternatively, a subchondral plate collapse without complete disappearance of joint space may occur. Finally, destruction and enlargement of the joint space of the affected IP joint will be seen. This entire destruction of a non-eroded IP joint may occur within a few months. Destructive phases, however, are always followed by repair or remodelling. Then, new irregular sclerotic subchondral plates are formed and a new joint space becomes visible, subchondral osteolytic areas gradually disappear and huge osteophytes are formed. No further evolution is seen in remodelled IP joints.
A system to score the progression of hand OA was designed based on the consecutive pathological phases recognised in the course of the disease: a non-erosive OA joint (‘S’ or stationary OA joint) can enter the ‘J’ phase when the joint space disappears, and then the ‘E’ phase when manifest erosive changes occur. Next, the affected IP joints show signs of repair or remodelling and the ‘R’ phase ensues.6 Numerical values were attributed to the different phases and the system then allowed significant progression to be recorded over 1–3-year periods.7,–,9
Critical appraisal of this categorical classification system, however, unveiled a few shortcomings. First, current studies10 of radiographic data in patients with erosive IP OA show that minor and unmistakable changes could be seen within only 6 months of follow-up. The analytical system based on changes in categorical variables did not allow evaluation of the obvious changes occurring in IP joints classified in the same anatomical phase—for example, a ‘J’ phase, an ‘E’ phase or even an ‘R’ phase. Moreover, the sequence of anatomical phases ‘N–S–J–E–R’ was acknowledged as a continuous deterioration with the ‘R’ phase being the worst situation with the highest pathological score.6 The observation of tissue remodelling in an ‘E’ joint progressing to an ‘R’ phase, however, indicated that destructive events came to an end, enabling subsequent tissue repair. Comparable tissue repair was seen in other forms of destructive arthritis when catabolic events in the affected tissues were blocked with tumour necrosis factor blocking agents.11 Rather than being a worsening, remodelling should be considered and valued as a process of repair.
These reflections encouraged us to optimise the categorical scoring system for progression by scoring the extent of pathological changes in the subchondral bone architecture, the subchondral bone plate and the synovial joint space, and computation of an overall score for the affected joints.
Material and methods
Radiographs: selection and blinding
Posteroanterior radiographs of the hands were obtained from 18 people who had the ‘erosive’ type of OA of their IP finger joints and in whom other rheumatic conditions were excluded. These subjects had participated in a 1-year randomised, placebo-controlled, double-blind study to evaluate the potential of a tumour necrosis factor α blocking monoclonal antibody to slow down destruction and to promote remodelling of the affected finger joints.10 Accordingly, the condition for inclusion of subjects in this therapeutic trial was the presence of one or more IP joints presenting the destructive ‘J’ or ‘E’ phases described previously.6
Radiographs of the IP joints were obtained at baseline, and after 6 and 12 months of follow-up. Then 30 IP finger joints showing further structural change, either destructive or reparative, were selected, comprising a collection of 90 images which were randomly numbered 1 to 90. Apart from 18 ‘E’ phase target joints, the radiographs presented one IP finger joint in the ‘S’ (non-erosive OA) phase, nine IP joints in the ‘J’ phase in which the joint space had disappeared and two remodelled ‘R’ IP finger joints.6
Score of erosive changes
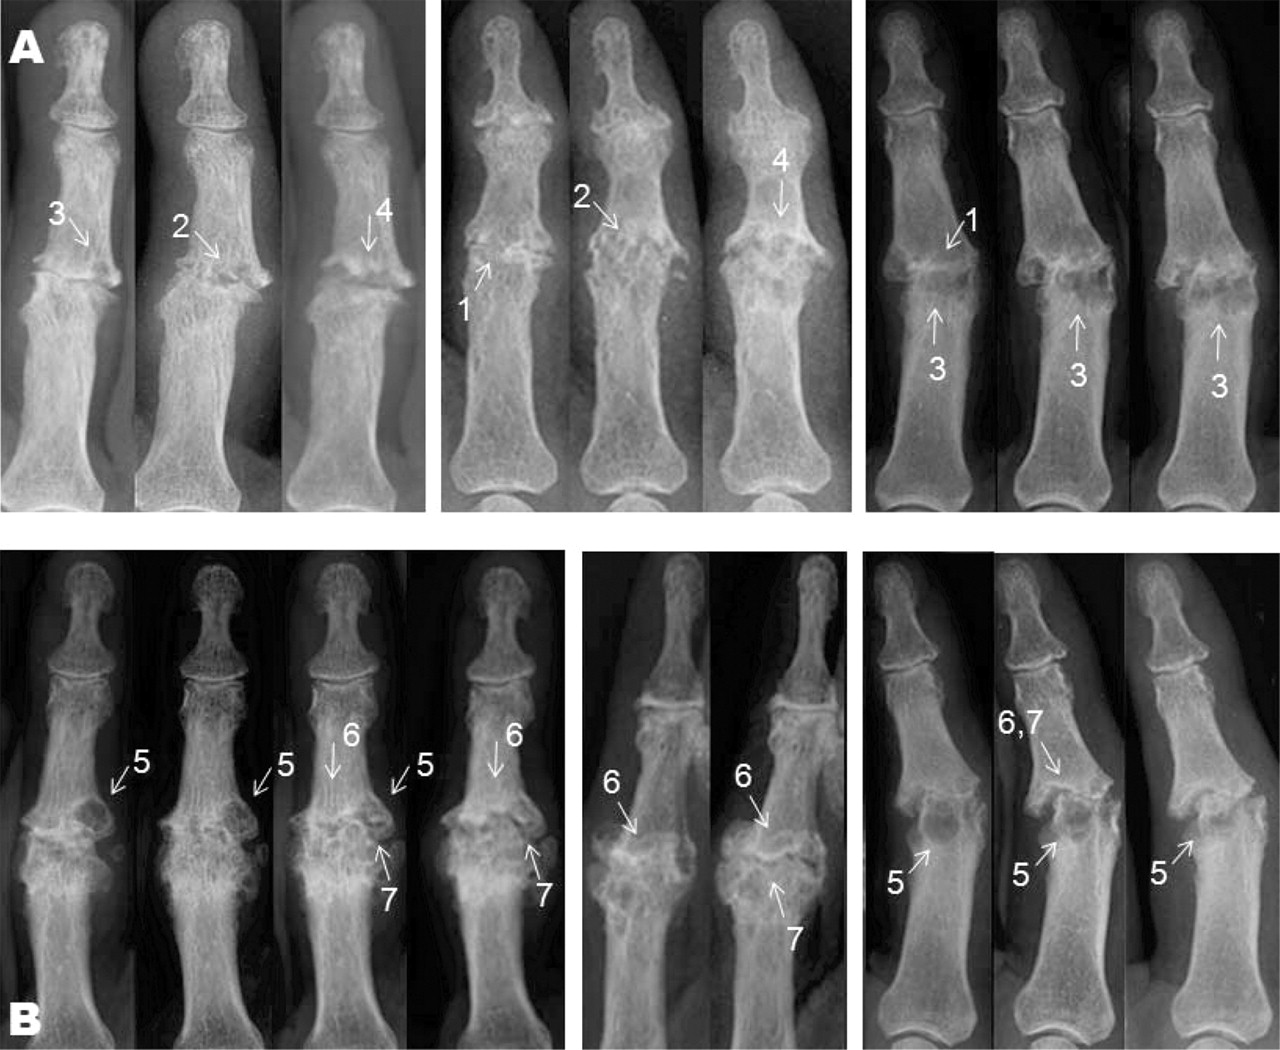
Three variables were selected to grade the severity of the radiographic changes: the proportions of the subchondral bone showing osteolytic areas, the relative amount of the subchondral bony plate resorbed, and the disappearance of the normal joint space, either by an entire loss of the articular cartilage or by a complete destruction of the subchondral bone plate and the appearance of a pseudo-joint (figure 1A).

(A) Erosive changes and (B) remodelling on radiographs of six different interphalangeal joints taken at 6-month intervals. (A) 1: Disappearance of the joint space. 2: Destruction of the subchondral bone plate; osteolytic events in and near the subchondral plate lead to a ruffled aspect of the subchondral plate. 3: Appearance of osteolytic areas in the subchondral bone. 4: Both the destruction of the subchondral plate and the osteolytic events in the subchondral bone area cause the generation of a widened pseudo-joint with irregular margins. (B) 5: Disappearance of the osteolytic areas in the subchondral bone area. 6: Reconstruction of the subchondral bone plate, which did not necessarily appear as a denser radio-opaque zone. 7: Reappearance of a radiotranslucent area recognised as the reconstructed joint space.
Score of remodelling
Some of the ‘E’ IP joints showed apparent signs of remodelling during follow-up. Changes typical of tissue repair in these IP joints (‘E/R’ joints) were a disappearance of the osteolytic areas in the subchondral bone and so a recovery of ordinary subchondral bone, and also a reconstruction of the subchondral bone plate. The latter was accompanied by the reappearance of a distinct joint space. Remodelling was thus scored in the same three areas retained to grade erosive changes (figure 1B).
Detailed assessment of changes on the radiographs
Proportions of the subchondral bone area with normal/abnormal-looking bone architecture were assessed in a rectangle square of which the height equalled the width of the joint space. The joint space was positioned in the centre of this square (figure 2A,B; row 2). Areas of disruption or loss of trabecular structure are marked on the radiographs (figure 2A,B; row 3). The subchondral bone plate is identified as a regular linear bone margin flanking the joint space (figure 2E,F; row 2). In an IP joint that had lost its joint space, a subchondral plate was defined as a regular radio-opaque linear structure within the position of the original joint space (figure 2D; row 2). Joint space was recognised as a radiotranslucent area bordered by two subchondral plates (figure 2E,F; row 3).

Detailed assessment of normality and pathology on the radiographs in ‘E’ and ‘E/R’ joints. Scores represent the proportion of (remaining) normal structure for each domain. (A,B) Changes in subchondral bone. Areas of osteolytic activity are marked and calculated proportions of normal bone remaining are presented: score subchondral bone = 100 – proportion of abnormal osteolytic bone. (C–F) Changes in subchondral bone plate (row 2) and in joint space (row 3); row 2: subchondral bone plates represented by white line; row 3: joint space was recognised as a radiotranslucent area bordered with two subchondral plates, which is not the case in 3C and D. Proportions of subchondral bone plate and of joint space still identifiable are presented in the figures. Scores presented in the figures are proportions of normal subchondral bone plate and of normal joint space.
An atlas with 50 radiographs representing changes of subchondral bone (10 images), subchondral bone plate and synovial joint space (40 images) of IP finger joints is available as an online supplementary file. Changes in the architecture of the subchondral bone area, in the subchondral plate and in the synovial space, are clearly indicated by illustrative line drawings and comments included in an additional online supplementary text file.
Computation of the changes in IP joints in ‘J’, ‘E’ and ‘E/R’ phases
The 90 images were read in a single order to evaluate the extent of the pathological changes in the three selected areas of the IP finger joint. Proportional amounts of normal tissue still present during a ‘J’ or ‘E’ phase or that reappeared during remodelling (‘E/R’ and ‘R’ phase) were recorded on an 11-point rating scale (range 0–100 with 10 unit increases) (figure 3). The sum of the three separate scores constitutes the total IP joint score. Equal weight was attributed to each of the subdomains. In addition, a longitudinal analysis was done after arranging the results of the readings in the correct sequence.12

Evaluation of the extent of the pathological changes in subchondral bone architecture (SCBO), the presence/absence of subchondral bone plate (SCPL) and of synovial joint space (JTSP). The changes in these three variables were recorded on an 11-point rating scale (range 0–100 with 10 unit increases). Top series: IP joint going through ‘E’ phase. Bottom series: remodelling IP joint.
Progression of selected IP joints through categorical anatomical phases
All joints were scored according to the ‘in-house’ anatomical phase scoring system.6 ‘J’, ‘E’ or ‘R’ phases were assigned to the pictures of the selected 30 IP joints at baseline and after 6 and 12 months of follow-up.
Statistics
Descriptive clinical and radiographic data were recorded at baseline for the 18 patients selected. Data were summarised using the mean for normally distributed, continuous variables, and the median (minimum – maximum) for non-normally distributed variables. Cross-sectional radiographic data are presented for each reader (reader 1, reader 2) and the mean for both readers at baseline, 6 and 12 months. Longitudinal data are presented as the mean change score for both readers. Intra- and inter-reader reliability were assessed using intraclass correlation coefficients (ICCs). Estimates of the 95% CI were calculated. Reproducibility of the categorical scoring system was evaluated by the percentage of absolute agreement between readers and readings and by unweighted κ statistics.
Responsiveness, the degree of progression of radiological joint damage above the measurement error, is best determined by the smallest detectable change (SDC = ±1.96 × SDΔ (change scores between raters)/(√k × √2), where ‘k’ represents the number of readings or raters used for the actual analyses of a trial.13 Calculating these cut-off values allowed us to express the results in simple categories such as the number of patients who improved, worsened, or remained stable. Sensitivity to change of the scoring system was estimated on the basis of differences between baseline and 12 months using the standardised response mean (SRM = mean change/SD of change). All statistical analyses were performed using the statistical software package SPSS version 15.0.
Results
Study materials
Ninety radiographs obtained from 18 patients (15 female, three male), all Caucasian, with erosive osteoarthritis of the distal IP and/or proximal IP finger joints, were selected. The mean age at baseline was 60.8 years (SD 8.7) and the disease duration was 11.3 years (range 1.1–40.9). On average, 12.5 of patients' 16 IP joints showed osteoarthritic changes, with respectively 5, 0.5, 3 and 4 joints in the ‘S’, ‘J’, ‘E’ and ‘R’ phase. The IP joints of the thumb were excluded.
Intra- and inter-reader reliability
Reading the 90 selected radiographs enabled the readers to judge proportions of subchondral bone, subchondral bone plate and joint space in IP finger joints that were destroyed or remodelled. Mean scores for each subdomain and the total score for each reader and reading are shown in table 1.
Cross-sectional analysis (N=90): mean scores for each subdomain and for the total score for each reader and for each reading of the radiographs read in single order and reliability analysis by ICC (95% CI)
Cross-sectional intra- and inter-reader reproducibility of scores was calculated on the data from the readings of the radiographs in a single order. ICC values and their 95% CI were high for both readers, ranging from 0.73 to 0.99. The lowest ICC was obtained by both readers for the subdomain subchondral bone. The ICCs (95% CI) for each reader are shown in table 1. Inter-reader ICC values are 0.71 for the subchondral bone, 0.85 for the subchondral plate, 0.88 for the joint space and 0.89 for the total score, exhibiting a good reproducibility for all scores.
The longitudinal ICC values (95% CI) between repeated scores of changes between baseline and 6 months, and baseline and 12 months, after unblinding for time, are given in table 2 for each reader and between readers. ICC values are excellent for reader 2 on all variables ranging from 0.97 to 0.99. Reader 1 scores well for subchondral plate, joint space and the total score with ICC of 0.91, 0.88 and 0.85 for change between baseline and 6 months, respectively, and 0.91, 0.94 and 0.96 for change between baseline and 12 months, respectively. ICC values for subchondral bone scores are moderate for reader 1 (table 2). Inter-reader ICC scores are good for subchondral plate, joint space and total score and good for subchondral bone over a time interval of 12 months.
Longitudinal analysis (N=90): mean changes in scores after 6 and 12 months of follow-up, reliability analysis by intraclass coefficient of correlation, and responsiveness by the smallest detectable change
Reliability was also assessed for the scores (90 radiographs) according to the original, ordinal anatomic phase scoring system. The percentage of absolute agreement between the readers is 93.6% (κ = 0.92). The intrareader reliability for both readers was excellent with a percentage of absolute agreement of 95.9% (κ = 0.95) for reader 1 and 98.2% (κ = 0.98) for reader 2.
Responsiveness
The mean differences with the SD (MΔ ± 1SD) and calculated SDC are shown in table 2. The SDC for the total score over 6 and 12 months was 47.6 and 36.0 units, meaning that a change obtained over 6 months of 50 units or more, and over 12 months of 40 or more on the total score can be interpreted as a real change. The cumulative probability plot in figure 4 shows that a number of IP joints (n = 12) showed significant remodelling over 12 months (change of total score greater than the SDC, in this case ≥36). Similarly, nine IP joints progressed to more erosive disease. Nine joints remained stable. The new scoring system, the Ghent University Scoring System (GUSS), allowed classification of 70.0% of joints as ‘progressors’. In the same way, an absolute change in total score exceeding an SDC of 47.6 between baseline and 6 months in 18 IP finger joints allowed 60% of these joints to be classified as ‘progressors’.

Cumulative probability plot of 1-year radiographic progression. Cut-off point was defined by the smallest detectable difference (SDC =36.0)—dotted lines. Inset: progression of interphalangeal (IP) finger joints through anatomical phases as defined in the categorical phase scoring system. Anatomical phases at baseline (T0m) and after 12 months (T12m) are given. The categorical phase scoring system and the Ghent University Scoring System allowed nine and 12 IP joints, respectively, to be identified as remodelled. Eight and nine IP joints were recognised as destructive. Anatomical phases: E, erosive; J, joint space lost; R, remodelled; S, non-erosive. nr, number of IP finger joints.
Comparison of the categorical anatomical phase scoring system and the optimised GUSS
When the categorical anatomical phase scoring system in this IP finger joint cohort was used, 10/30 (33.3%) joints were defined as progressors from baseline to 6 months: six of these showing further features of destruction and four of obvious repair in the selected areas of the joint. With the present scoring system, however, significant disease progression had occurred in 18 (60.0%) IP joints. More erosive disease or remodelling had occurred in 11 (36.7%) and seven (23.3%) of the target joints, respectively.
Disease progression over 12 months was detected in up to 21 (70.0%) of the 30 target joints. More erosive disease or obvious remodelling occurred in nine and 12 of these 21 IP finger joints. The previous anatomical phase scoring system allowed 17 (56.7%) of these IP joints to be classified as progressors. Eight and nine IP joints, respectively, were recognised as more erosive or showed signs of repair. GUSS detected significantly more progression after 6 months (McNemar test: p = 0.008). Progressive changes over longer periods—that is, 12 months, allowed more IP joints to move to a subsequent anatomical phase, resulting in comparable power of both scoring systems.
Sensitivity to change
The standardised response means (SRM = mean change/SD of change) were rather low, ranging from 0.19 to 0.32 for reader 1 (SRM = 0.21, 0.24, 0.32 and 0.19, respectively, for subchondral bone, subchondral plate, joints space and total score) and 0.19 to 0.47 for reader 2 (SRM = 0.24, 0.19, 0.32 and 0.47, respectively, for subchondral bone, subchondral plate, joints space and total score). Joint space seems to be most responsive to both readers as well as the total score to reader 2.
Discussion
Successive pathological phases recognised in the course of IP finger joint OA allowed gross changes in the progression of this disease to be recorded over a 3-year period.8 9 However, this analytical system based on changes in categorical variables did not allow discrimination between subtle changes in anatomical progression occurring within the same phase in shorter time studies. Destruction and reconstruction of subchondral bone and bone plate, and of the synovial joint space of the affected IP joints has shown considerable variation in morbidity and occurred much more rapidly than previously recognised.
This study describes the development of a numerical scoring system for progression in erosive IP OA. Pathological changes occurring in three well-defined tissue compartments when entering and advancing through the destructive ‘J’ and ‘E’ phases, and during periods of repair in the ‘R’ phase were recorded quantitatively on an 11-point rating scale (range 0–100 with 10 unit increases). The sum of the three separate scores constituted the overall IP joint score.
Cross-sectional and longitudinal intra- and inter-reader reproducibility of the three subdomains and the total score were high for both readers. The inter-reader consistency of changes in scores over time allowed the SDC to be computed. Changes in total score of at least 40 units (SDC = 36.0) over 12 months and at least 50 units (SDC = 47.6) over 6 months represent true changes. The scoring method appeared to be sufficiently responsive over time within 6-month periods. The amount of ‘real’ change that needs to be seen over a shorter period (6 months) is, as can be expected, larger than with a period of 12 months.
As far as reproducibility and sensitivity to change are concerned, the optimised scoring system for IP finger joint OA performs as well as the original categorical scoring system proposed to assess hand OA and its radiological progression.
When the former categorical anatomical phase scoring system in the present 30 IP finger joint cohort was used, 56.7% joints were defined as progressors after 12 months. With the present scoring system, the SDC between 0 and 12 months for this series of IP joints allowed significant disease progression to be detected in 70.0% of the finger joints. SDC between 0 and 6 months for the same series of joints enabled disease progression to be detected in more than 60.0% of the 30 target joints, whereas the previous anatomical phase scoring system allowed only 33.3% of these IP joints to be classified as progressors.
Within shorter periods of time, the optimised scoring system GUSS thus detects the structural modifications that precede a change in anatomical phase and may be particularly valuable for monitoring natural or drug-modified disease progression in this particular form of OA within shorter time periods and in relatively small patient populations. This finding implies a considerable advantage over the classical scoring methods when the impact of disease-modifying drugs with anticatabolic and/or repair-promoting potential are explored. This sensitivity to change of the proposed scoring system should be validated in these sorts of therapeutic studies.
More importantly, erosive interphalangeal finger joint OA, with its biphasic pattern of erosive disease and reparative changes, could serve as a clinical model to identify and value drugs with disease-modifying potential in other inflammatory destructive joint diseases.
Currently used scoring systems14 have demonstrated that disease progression in rheumatoid arthritis and psoriatic arthritis is halted by different biological treatments.15 16 Nevertheless, repair was only indirectly demonstrated in the affected joints in these diseases.17 Undoubtedly, articular structures are all affected in a distinctive way in different destructive rheumatic joint diseases—for example, in erosive IP finger joint OA, in psoriatic arthritis or in rheumatoid arthritis. Using the proposed scoring system designed to grade repair in a surrogate disease would allow identification of disease-modifying drugs of possible use in other systemic joint diseases.
References
Supplementary materials
Web Only Data ard.2009.112714
Files in this Data Supplement:
Footnotes
GV and RW contributed equally.
-
Funding The study was funded by an educational grant from Abbott.
-
Competing interests A provisional patent has been filed (application number: 0815857.8 (01/09/2008)) to the UK intellectual Property Office, Newport.
-
Ethics approval This study was conducted with the approval of the local ethics committee, University Hospital Ghent, De Pintelaan 185, 9000 Ghent, Belgium.
-
Provenance and peer review Not commissioned; externally peer reviewed.