Article Text

Abstract
Background: Quantitative magnetic resonance imaging (qMRI) may provide valuable measures of cartilage morphology in osteoarthritis (OA) but has been confined to sequences with relatively long acquisition times at 1.5 Tesla (T).
Objective: To test the accuracy and precision of knee cartilage qMRI with a fast double echo, steady state (DESS) sequence with water excitation (we) at 3 T.
Methods: As a pilot study for the Osteoarthritis Initiative, test-retest MR images were acquired in the knees of 19 participants with no OA to moderate degrees of clinical OA. Two double oblique coronal fast low angle shot (FLASHwe) sequences (1.5 mm slice thickness) were acquired at 3 T, and two sagittal DESSwe sequences (0.7 mm slice thickness). Double oblique coronal multiplanar reformats (MPR) were performed (1.5 mm slice thickness) from the sagittal DESSwe. Knee joint cartilage plates were quantified unpaired in random order with blinding to subject identification.
Results: In the femorotibial joint, precision errors (root mean square coefficient of variation in % for unpaired analysis) for cartilage volume and thickness were 3.0–6.4% with coronal FLASHwe, 2.4–6.2% with coronal MPR DESSwe, and 2.3–8.2% with sagittal DESSwe. Correlation coefficients between DESSwe and FLASHwe ranged from r = 0.88 to 1.0. In the femoropatellar joint, precision errors (sagittal DESSwe) were 3.4–8.5%.
Conclusions: DESSwe permits accurate and precise analysis of cartilage morphology in the femorotibial joint at 3 T. Further studies are needed to examine the accuracy of DESSwe in the femoropatellar joint and its ability to characterise sensitivity to longitudinal changes in cartilage morphology.
- AC, area of the cartilage surface
- cLF, central lateral femur
- cMF, central medial femur
- cor, coronal
- CV, coefficient of variation
- dAB, denuded area of bone
- DESS, double echo steady state
- FLASH, fast low angle shot
- LT, lateral tibiae
- MPR, multiplanar reformats
- MT, medial tibiae
- NIAMS, National Institute of Arthritis and Musculoskeletal and Skin Diseases
- qMRI, quantitative magnetic resonance imaging
- OA, osteoarthritis
- OAI, Osteoarthritis Initiative
- P, patella
- pLF, posterior lateral femur
- pMF, posterior medial femur
- RMS, root mean square
- ROI, regions of interest
- sag, sagittal
- SPGR, spoiled gradient recalled echo
- tAB, total area of subchondral bone
- TrF, femoral trochlea
- VC, cartilage volume
- we, water excitation
- cartilage
- magnetic resonance imaging
- osteoarthritis
- biomarkers
Statistics from Altmetric.com
- AC, area of the cartilage surface
- cLF, central lateral femur
- cMF, central medial femur
- cor, coronal
- CV, coefficient of variation
- dAB, denuded area of bone
- DESS, double echo steady state
- FLASH, fast low angle shot
- LT, lateral tibiae
- MPR, multiplanar reformats
- MT, medial tibiae
- NIAMS, National Institute of Arthritis and Musculoskeletal and Skin Diseases
- qMRI, quantitative magnetic resonance imaging
- OA, osteoarthritis
- OAI, Osteoarthritis Initiative
- P, patella
- pLF, posterior lateral femur
- pMF, posterior medial femur
- RMS, root mean square
- ROI, regions of interest
- sag, sagittal
- SPGR, spoiled gradient recalled echo
- tAB, total area of subchondral bone
- TrF, femoral trochlea
- VC, cartilage volume
- we, water excitation
Quantitative magnetic resonance imaging (qMRI) of articular cartilage provides valuable measures of disease status and progression in osteoarthritis (OA) and shows great promise for evaluating the treatment response of disease modifying drugs.1–4 Measurement of joint space narrowing with conventional radiography is the currently accepted method for assessing structural change in joints, but has serious technical (radiation dose, alignment) and methodological drawbacks (sensitivity, specificity, and ability to monitor progression). Therefore there is considerable interest in developing reliable imaging biomarkers with the potential to evaluate quantitatively the structural status of joints and their changes with disease progression.1–6 The Osteoarthritis Initiative (OAI), a programme jointly sponsored by the National Institute of Health, the National Institute of Arthritis and Musculoskeletal and Skin Diseases (NIAMS), and the pharmaceutical industry, is targeted at identifying the most potent OA biomarkers for analysing development and progression of symptomatic knee OA.
Validation studies have shown that MRI at a field strength of 1.5 Tesla (T) provides accurate information on cartilage morphology (volume, thickness, and surface areas), if fat suppressed spoiled gradient recalled echo (SPGR or, fast low angle shot (FLASH)) imaging sequences and state of the art image analysis tools are used.4 However, SPGR has a number of limitations, such as relatively low contrast between the surface of the posterior femoral condyle and the posterior capsule, between the surface of the trochlea and Hoffa’s fat pad, and between the cartilage surfaces in the joint contact zones, particularly in cases of effusion. Also with SPGR, acquisitions are limited to 1.5 mm slice thickness at 1.5 T, if reasonable contrast to noise ratios and acquisition times are to be achieved. Satisfactory precision (reproducibility) for quantitative cartilage measures has been observed in coronal SPGR images of the tibia and the central (weightbearing) femoral condyles, and in the axial plane for the patella. In contrast to sagittal images, however, these acquisition planes do not provide full anatomical coverage of the knee, including the femoral trochlea and posterior femoral condyles. Sagittal SPGR images at 1.5 mm slice thickness, however, have considerable partial volume effects and thus relatively large precision errors at the medial facet of the patella, at the internal aspects of the medial and lateral tibia, and at the femoral condyles.7 Double echo steady state with water excitation (DESSwe)8 at 3 T may overcome these limitations, because of the potentially higher signal to noise ratio, higher fluid to cartilage contrast,9 and the lower partial volume effects that can be achieved with thinner slices at near isotropic resolution.
In this study we test the hypothesis that sagittal DESSwe at 3 T permits accurate and highly reproducible quantification of cartilage morphology in all knee cartilage plates from one single (sagittal) dataset at reasonable acquisition times. To this end, sagittal DESSwe acquisition and coronal multiplanar reformats (MPR) were compared for consistency (cross calibration) and precision errors (reproducibility) with a previously validated coronal FLASHwe imaging protocol at 3 T.4,10 Please note that the current study focuses on the performance of DESSwe in quantitatively measuring cartilage morphology (volume, thickness, surface areas) only, but not on the value of DESSwe for clinical scoring or diagnosis of osteoarthritic lesions.
METHODS
Study participants and MRI
Nineteen subjects (7 men, 12 women; 9 healthy, 10 with a clinical diagnosis of OA) underwent a test-retest examination of their left or right knee. The OA participants were selected using the OAI study design and documentation (see the Appendix at http://www.annrheumdis.com/supplemental). The mean age was 51 years (range 40–71) and the mean body mass index was 30.4 kg/m2 (range 19.1–44.0). Images were acquired on a 3 T MRI scanner (Siemens Magnetom Trio, Erlangen, Germany) and a quadrature transmit-receive knee coil (USA Instruments, Aurora, OH). The study protocol, amendments, and informed consent documentation were reviewed and approved by the local institutional review boards.
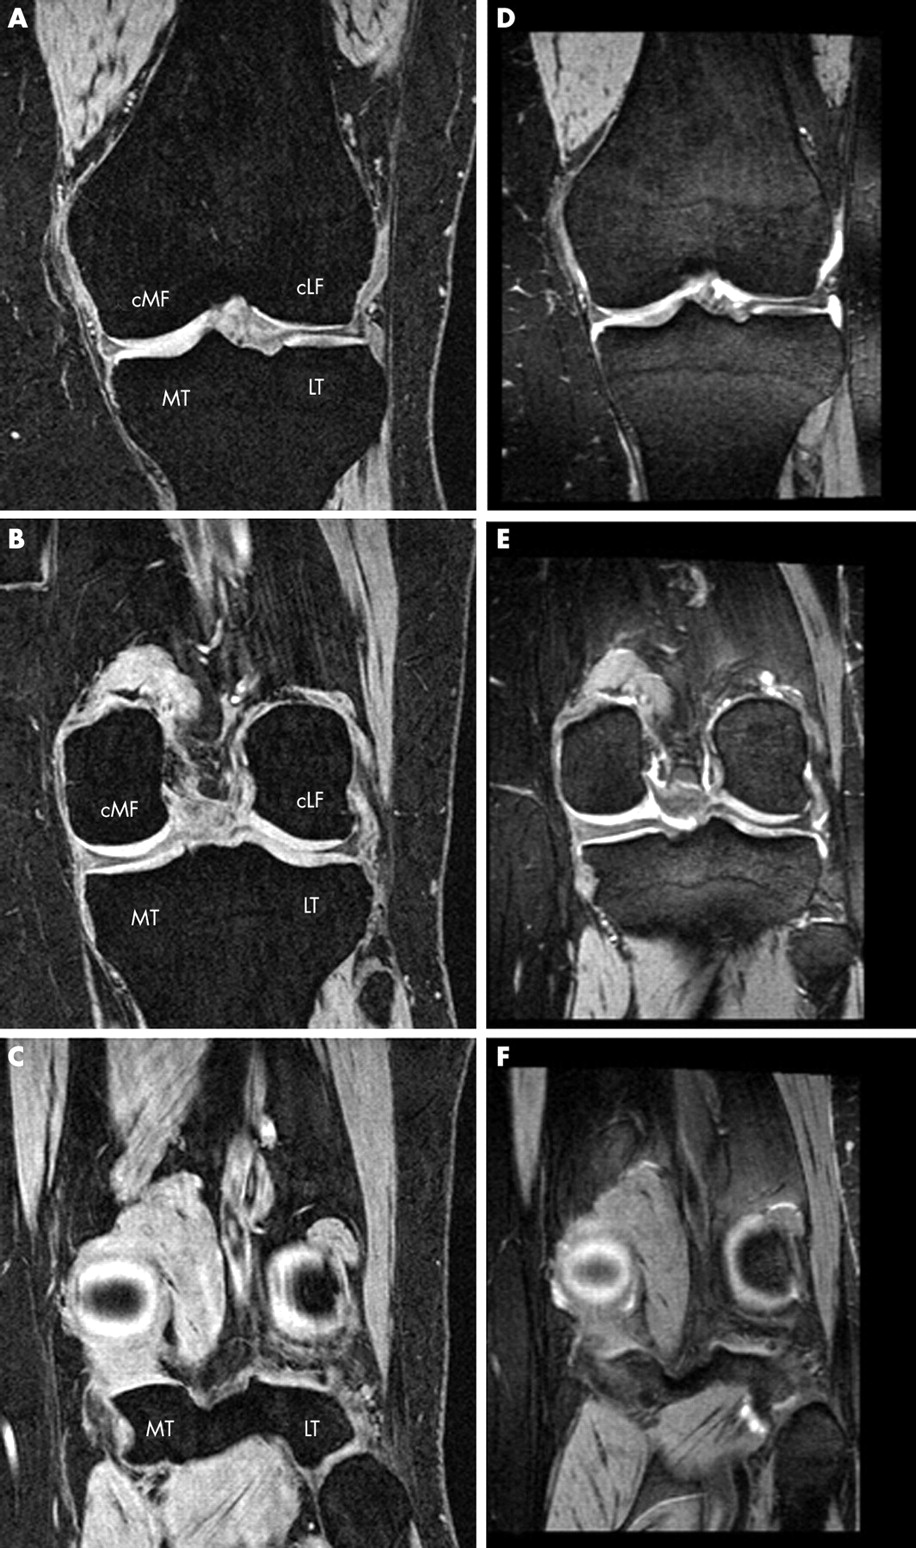
The “gold standard” acquisition for morphological cartilage analysis was a double oblique coronal 3D FLASH sequence with water excitation (cor FLASHwe) with a slice thickness of 1.5 mm, an in-plane resolution of 0.31 mm×0.31 mm, and an acquisition time of 8 minutes 30 seconds. This protocol has been validated at 1.5 T4,11–13 and recently cross calibrated between 1.5 T and 3 T.4,10 The sagittal 3D DESSwe images (sag DESSwe; fig 1) were prescribed orthogonal to the cor FLASHwe (fig 2) with a slice thickness of 0.7 mm and 0.37 mm×0.46 mm in-plane resolution (acquisition time 10 minutes 23 seconds; fig 3). To directly compare DESSwe with cor FLASHwe, the sag DESSwe underwent MPR to create 64 double oblique coronal images with 1.5 mm slice thickness (corMPR DESSwe), oriented in the same way as the cor FLASHwe (fig 2).

Contribution of the T2 and T2* weighted signals to the combined DESS signal, after the second α-pulse the PSIF signal has been formed. For water excitation the α-pulse is replaced by a 1-2-1 binominal RF pulse.

Comparative images for a coronal FLASHwe sequence (A–C) and a corMPR reconstruction of a sagittal DESSwe sequence (D–F) in a healthy participant with a slice thickness of 1.5 mm. (A) and (D) display the first slice included in the central medial and lateral femoral regions of interest (cMF and cLF ROI); (B) and (E) the last slice included in the central femoral ROI (60% criterion from A/D to C/F); (C) and (F) the anatomical landmark at the posterior tips of the femoral condyle (100%) used to define the central femoral ROI. For abbreviations, see fig 3.

Sagittal DESSwe images with a slice thickness of 0.7 mm: (A) medial femorotibial compartment; (B) central femorotibial compartment; (C) lateral femorotibial compartment. The figure also shows the regions of interest selected for cartilage analysis in the sagittal DESSwe sequence: MT, medial tibia; LT, lateral tibia; cMF, central medial femur; cLF, central lateral femur; pMF, posterior medial femur; pLF, posterior lateral femur; P, patella; TrF, femoral trochlea.
Image analysis
The 114 image series (2×19 cor FLASHwe, 2×19 sag DESSwe, and 2×19 corMPR DESSwe) were anonymised and the image analysis centre was blinded to subject identification. Six experienced readers with formal training in cartilage segmentation segmented the images. One reader analysed all medial tibiae (MT), one the lateral tibiae (LT), one the central medial femur (cMF) and posterior medial femur (pMF), one the central lateral femur (cLF) and posterior lateral femur (pLF), one the patellae (P), and one the femoral trochlea (TrF). In contrast to most previous studies,4 the baseline and repeat datasets were not paired for analysis, but analysed independently in random order, to achieve better insight into the impact of the image contrast differences on accuracy and precision. Previously published precision errors for these conditions (resegmentation) are known to be higher than those for image analysis of paired datasets in the same session7,14 (table 1).
Precision errors (root mean square coefficient of variation in %) previously reported for FLASHwe protocols
Segmentation involved manual tracing of the total area of the subchondral bone (tAB) and the area of the cartilaginous joint surface (AC) on a slice by slice basis (see Appendix at http://www.annrheumdis.com/supplemental). Note that denuded areas of bone (dAB, full thickness cartilage lesions), but not peripheral osteophytes were included in the tAB (fig 4). Osteophyte cartilage was not included in the analysis. The femoral condyles (fig 3) were separated into an anterior (cMF and cLF) and posterior aspect (pMF and pLF). In the coronal images, cMF and cLF started anteriorly at the first slice with an interruption of the subchondral bone (divergence of the trochlea into the femoral condyles; figs 2A and D). Posteriorly, the last slice showing the circular structure of the posterior femoral condyles (bone centrally and cartilage surrounding it) was identified (figs 2C and F), and the slice located at 60% between the anterior and posterior landmark was the most posterior one to be included in the cMF and cLF (figs 2B and E). The same regions were identified in the corMPR DESSwe and sag DESSwe (figs 2 and 3 and Appendix, http://www.annrheumdis.com/supplemental). Quality control of all segmentations was performed by a single person (FE), who reviewed all segmented slices of each dataset. Proprietary software was used to determine cartilage volume (VC), total area of the subchondral bone (tAB), cartilage volume divided by tAB (VCtAB), area of the cartilage surface (AC), part of tAB covered with cartilage (cAB), part of tAB denuded (dAB), mean cartilage thickness (ThCcAB), and mean thickness when counting all denuded areas as 0 mm cartilage thickness (ThCtAB).

Comparative images for a coronal FLASHwe sequence (A, B) and a corMPR reconstruction of a sagittal DESSwe sequence (C, D) in an OA participant with partially denuded cartilage in the medial tibia and medial femoral condyle and with peripheral osteophytes. (A) and (C) show the segmentation of the medial tibia. (E) and (F) show the sagittal DESSwe through the internal and external aspect of the medial tibia
The resegmentation precision (reproducibility) for unpaired analysis was determined by computing the root mean square (RMS) coefficient of variation (CV) in %.15 Precision errors between protocols were compared using a paired Student’s t test. Cross calibration was performed by computing the random (%) pairwise differences, the systematic (%) pairwise differences, and the Pearson correlation coefficients. Systematic differences between techniques were tested for statistical significance using a paired t test.
RESULTS
Qualitative results
Figures 2 and 4 show comparative images of cor FLASHwe and corMPR DESSwe. The FLASHwe images displayed relatively homogeneous, and mostly hyperintense signal intensity throughout the cartilage relative to surrounding tissues. With DESSwe, the cartilage signal was of intermediate intensity and was less homogeneous than with FLASHwe, varying throughout the thickness and the joint. DESSwe displayed high and very sharp cartilage-meniscal contrast, even in the presence of meniscal abnormalities. DESSwe also displayed good contrast between pMF/pLF and the posterior capsule and little partial volume effect as a virtue of the low slice thickness. However, separation of patellar versus trochlear cartilage was relatively difficult in most subjects (fig 5). With DESSwe, gradients at the cartilage surface varied from intermediate intensity cartilage to hypointense joint space if no effusion (fluid) was present, and from intermediate intensity cartilage to hyperintense joint space if effusion was present (figs 2–5). Thus, it was difficult to attribute areas of hyperintense signal to either the superficial cartilage layer or to effusion.

Sagittal DESSwe images showing areas where segmentation is difficult (arrows), owing to either lower contrast or ambiguity of contrast conditions.
Quantitative results
Precision errors of cor FLASHwe for cartilage volume and thickness (VC, VCtAB, ThCtAB, ThCcAB) ranged from 3.0% to 6.4% (table 2). Those for corMPR DESSwe ranged from 2.4% to 6.2% and those for sag DESSwe from 2.3% to 8.2% (tables 2 and 3) and were not significantly different. Precision errors for areas (tAB, cAB, and AC) ranged from 2.7% to 6.3% for cor FLASHwe, from 1.9% to 3.6% for corMPR DESSwe, and from 2.6% to 9.5% for sag DESSwe (tables 2 and 3). Precision errors for areas in cMF and cLF were significantly smaller with corMPR DESSwe than with FLASHwe; precision errors for areas in LT were significantly larger with sag DESSwe than with FLASHwe (tables 2 and 3). The intersubject variability for quantitative cartilage variables was substantially larger than the precision errors (table 3).
Coefficients of variation (RMS CV%) for repeated measurements of quantitative knee cartilage morphology parameters for dual acquisitions of the coronal FLASHwe and coronal MPR
Precision (RMS CV%) for repeated measurements of quantitative knee cartilage morphology for sagittal DESSwe and intersubject variation across the 19 volunteers
Correlation coefficients (r) for quantitative cartilage parameters obtained with corMPR DESSwe and cor FLASHwe ranged from 0.88 to 1.00 (table 4). Systematic differences varied between cartilage plates (underestimation of cartilage thickness with corMPR DESSwe in MT and cLF, and overestimation in LT and cMF). Pairwise random differences ranged from 1.9 (1.8)% to 9.0 (3.0)%. Correlation coefficients between sag DESSwe and cor FLASHwe (table 5) ranged from 0.88 to 0.99. Cartilage thickness was slightly underestimated with sag DESSwe in MT and LT, but not in cMF and cLF. Pairwise random differences for thickness ranged from 3.2 (2.3)% to 10.9 (21.0)%.
Random (mean (SD)) and systematic differences (with significance levels) in quantitative knee cartilage morphology variables between coronal MPR DESSwe and coronal FLASHwe
Random (mean (SD)) and systematic differences (with significance levels) in quantitative knee cartilage morphology parameters between sagittal DESSwe and coronal FLASHwe
Nine pairs of cartilage plates were identified with part of the tAB not fully covered with cartilage (3×MT, 3×cMF, 2×LT, and 1×cLF) using cor FLASHwe. One plate (cLF) was overlooked (0% v 24% dAB%—cLF) in the corMPR DESSwe, and two plates were overlooked in the sag DESSwe (0% v 5% dAB% in MT and 0% v 6% in LT). The average deviation between repeated datasets was 0.25 cm2 (dAB) for cor FLASHwe, 0.30 cm2 for corMPR DESSwe, and 0.33 cm2 for sag DESSwe. Compared with cor FLASHwe, dAB was not significantly underestimated with corMPR DESSwe (−0.7 cm2/−3.9%) and sag DESSwe (−0.7 cm2/−3.6%). The average deviation from cor FLASHwe in dAB was 1.4 cm2 (5.9%) for corMPR DESSwe and 1.3 cm2 (8.2%) for sag DESSwe. The correlation in dAB% between corMPR DESSwe and cor FLASHwe was 0.91; that between sag DESSwe and cor FLASHwe 0.90.
DISCUSSION
We tested the hypothesis that sagittal DESSwe at 3 T may overcome some of the current limitations of quantitative analysis of cartilage morphology by permitting one to obtain accurate and highly reproducible quantification of cartilage morphology in all knee cartilage plates from one single (sagittal) dataset at reasonable acquisition times. In the femorotibial joint (tibia and central femoral condyles), we found that measures of cartilage morphology derived from DESSwe were consistent with those from FLASHwe, and that precision errors for unpaired analysis were similar between both protocols. Precision errors in the posterior femoral condyles (sagittal DESSwe) tended to be similar or lower than in the central femoral condyles and were substantially less than the intersubject variability, indicating that sagittal DESSwe can be used to reliably determine cartilage morphology in the posterior aspects of the femur. In the patella and trochlea, in contrast, precision errors of sagittal DESSwe were considerably higher than previously reported for unpaired analysis of 1.5 mm sagittal acquisitions with FLASHwe at 1.5 T.7,14 The difference should, however, be interpreted with care, as the results do not originate from the same study.
In contrast to most previous studies, repeat datasets were not segmented as pairs within the same analysis session, but in random order with blinding to subject identification. Two previous studies reported considerably higher errors for unpaired (resegmentation) conditions (different sessions) than for paired analysis under short term conditions (same analysis session) for sagittal and axial FLASHwe sequences, respectively.7,14 The precision errors reported here are likely to overestimate the precision error relevant to a longitudinal study, in which baseline and follow up datasets are read in parallel. A previous study with cor FLASHwe at 3 T (1.5 mm slice thickness) in which repeat datasets were processed in pairs,4,10 reported RMS CV% values of ⩽2.5% for cartilage volume and thickness in MT and LT, of ⩽3% in cMF and cLF, and values of 1.1–1.4% for areas.4,10 In the current study with unpaired analysis, the precision errors for volume and thickness were ⩽4% in MT, ⩽6% in LT and cLF, and ⩽7% in cMF, and those for areas ⩽6.3%. These results emphasise the higher reproducibility of quantitative cartilage measures in paired data analyses, because segmentation regions (for instance, number of slices) can be kept more consistent.
Precision errors for corMPR DESSwe were similar to cor FLASHwe despite the lower in-plane resolution of corMPR DESSwe. One exception was the smaller errors in surface area measurements in cMF and cLF by corMPR DESSwe. One explanation is that with an MPR, the double oblique orientation could be made more consistently, whereas the cor FLASHwe orientation could not be optimised post hoc. In fact, the average deviation in rotational alignment relative to the posterior tips of the femoral condyles within pairs was only 0.1 slices for corMPR DESSwe, but 0.6 for cor FLASHwe. The precision errors for sag DESSwe were similar to the cor FLASHwe, except for the surface areas in LT. The larger errors were in part due to larger differences in the number of slices segmented in sag DESSwe pairs (2.3) than in corMPR DESSwe (0.9) and cor FLASHwe (0.6).
Precision errors in the femoropatellar joint (sag DESSwe) were relatively large (3.7–7.7% for volume and thickness, and 3.4–8.5% for areas) compared with previous studies4 with sagittal and axial FLASHwe at 1.5 T and 1.5 mm slice thickness. These results correspond with the subjective difficulty of separating P and TrF in the sag DESSwe owing to low cartilage-cartilage contrast in the contact zone. Because the thinner slice thickness (0.7 mm) and higher field strength (3 T) should have advantages over acquisitions at 1.5 mm thickness and 1.5 T,7,14 our findings indicate that sagittal DESSwe may be less suitable than FLASHwe for analysing femoropatellar cartilage. A face to face comparison between axial FLASHwe, sag FLASHwe, sag DESSwe, and axial DESSwe should be undertaken to clarify this issue.
For cross calibration of corMPR DESSwe with cor FLASHwe at 3T, correlations were high (>0.95), except for VCtAB and ThCtAB at cLF (0.91 and 0.88). The same applied for sag DESSwe (>0.90), except for VC and ThCtAB of cLF (0.89 and 0.88), despite the differences in section orientation and spatial resolution. Unfortunately, measurements in the femoropatellar joint could not be validated, because no sagittal or axial FLASHwe images were available for this purpose as part of this pilot study.
This study poses several other limitations: only a limited number of participants (n = 19) were evaluated and only two repeat scans were acquired for each protocol. The aggregate MRI examination time of almost 2 hours precluded increasing the number of repeat scans. Previous studies have shown that, when a FLASHwe sequence is used, changes of cartilage morphology can be measured with changes in mechanical loading conditions16,17 and in OA18–20 over relatively short period of time. The sensitivity of DESSwe to longitudinal changes in cartilage morphology remains to be tested. Because the OAI will obtain image data from 5000 subjects at yearly intervals over a period of 5 years, a basis for such a study is under way.
When discussing the potential advantages and limitations of DESSwe, the following points are worth noting: (a) DESSwe provides more heterogeneous signal characteristics of the cartilage, the joint space, and other periarticular tissues, which may be of considerable interest for clinically evaluating or scoring OA. The high cartilage to fluid contrast may be of particular advantage in detecting focal cartilage lesions, whereas the present study focused only on integral quantitative measures of cartilage morphology, such as volume and thickness. (b) When acquiring coronal images with a FLASHwe sequence, relatively large areas of the femur (trochlea, posterior condyles) are not accessible to analysis. With sagittal DESSwe it is possible to image the entire knee with high resolution (0.7 mm slice thickness) in about 10 minutes. The acquisition time for the coronal FLASHwe was shorter (8 minutes) but that for sagittal FLASHwe at comparable resolution would be >20 minutes. (c) At 0.7 mm slice thickness, segmentation time for sagittal images is twice as long as for 1.5 mm cor FLASHwe (or corMPR DESSwe). Additional segmentation time is also required for DESSwe contrast because of the more heterogeneous signal and, subjectively, the experienced readers found DESSwe more challenging than FLASHwe. Some of these limitations may be overcome by more automated segmentation algorithms, but the complex signal characteristics of DESSwe may render this goal an even larger challenge than for FLASHwe. (d) DESSwe is currently available from only one MR system vendor, which may limit its applicability in multicentre studies.
In conclusion, DESSwe imaging at 3 T permits quantitative measures of cartilage morphology in the femorotibial joint to be obtained with a high level of accuracy and precision in subjects with and without OA. The performance (reproducibility) of sag DESSwe in the femoropatellar joint is, however, less promising. Future studies are needed to investigate the accuracy of DESSwe versus FLASHwe in the femoropatellar joint and the sensitivity of DESSwe to longitudinal change of cartilage morphology.
Acknowledgments
The OAI and this pilot study are conducted and supported by the National Institute of Arthritis and Musculoskeletal and Skin Diseases in collaboration with the OAI investigators and consultants. This manuscript has been reviewed by the OAI publications committee for scientific content and data interpretation. The research reported in this article was supported in part by contracts N01-AR-2-2261, N01-AR-2-2262 and N01-AR-2-2258 from NIAMS.
We are grateful to the Ohio State University OAI team, particularly Kim Toussant, and to the OAI team at Memorial Hospital of Rhode Island for recruitment of the study subjects, and to Larry Martin RTR(MR) and Lynn Fanella RTR(MR) for acquiring the MR images. David White, PhD, is thanked for his help with the initial study setup and for randomisation of the images. Further, we thank Gudrun Goldmann, Linda Jakobi, Manuela Kunz, Sabine Mühlsimer, Matt Schutzer, and Annette Thebis for data segmentation and Saara Totterman, MD, PhD (University of Rochester and Virtualscopics Inc) and Mike Totterman (Virtualscopics Inc) for their collaboration in developing the definitions of the ROI for femoral cartilage analysis.
REFERENCES
Supplementary materials
Files in this Data Supplement:
- view PDF - Subject selection criteria.
Footnotes
-
Published Online First 26 August 2005
-
Competing interest: None of the authors has a competing interest with regard to publication of the study, because no organisation may gain or lose financially from the results of conclusions published here. Felix Eckstein works as a consultant for Pfizer Inc, GlaxoSmithKline, and Virtualscopics Inc, and is CEO of Chondrometrics GmbH, a company providing MR image analysis services. Martin Hudelmaier and Wolfgang Wirth have a part time appointment with Chondrometrics GmbH.
-
Ethics approval: The study protocol, amendments, and informed consent documentation were reviewed and approved by the local institutional review boards.