Article Text

Abstract
Background: Dendritic cells (DC) have a role in the regulation of immunity and tolerance, attracting inflammatory cells by the production of various chemokines (CK). Fc gamma receptors (FcγR) may be involved in regulation of the DC function.
Objective: To assess the expression of CK by immature (iDC) and mature DC (mDC) and its regulation by FcγR in patients with RA and healthy donors (HC).
Methods: Expression of CK by DC from patients with RA and from HC was determined by real time quantitative PCR and ELISA. DC were derived from monocytes following standardised protocols. To study the potential regulation by FcγR, iDC were stimulated with immune complexes (IC) during lipopolysaccharide (LPS) induced maturation. The presence of CK was studied in synovial tissue from patients with RA, osteoarthritis, and healthy subjects by RT-PCR and immunohistochemistry.
Results: iDC from patients with RA had markedly increased mRNA levels of the CK CCL18 and CXCL8. Upon maturation with LPS, expression of CCL18, CCL19, CXCL8, CCL3, and CCL17 increased dramatically, reaching significantly higher levels in patients with RA. Monocytes failed to express these CK, except for CXCL8 and CCL3. IC-mediated triggering of the FcγR on DC from patients with highly active RA down regulated all CK, whereas the reverse was seen when DC from patients with low disease activity and healthy donors were stimulated. CCL18 was significantly increased in RA synovial tissue.
Conclusion: Increased CK expression by DC was found in patients with RA. This expression is partly regulated by FcγR triggering and results in an inhibitory DC subtype in RA upon FcγR-mediated triggering.
- CK, chemokine(s)
- DAS28, 28 joint count Disease Activity Score
- DC, dendritic cell(s)
- ELISA, enzyme linked immunosorbent assay
- FcγR, Fc gammas receptor(s)
- GAPDH, glyceraldehyde-3-phosphate dehydrogenase
- HAGGs, heat aggregated gammaglobulins
- HRP, horseradish peroxidase
- IC, immune complexes
- iDC, immature dendritic cells
- IL, interleukin
- LPS, lipopolysaccharide
- mDC, mature dendritic cells
- OA, osteoarthritis
- PBGD, porphobilinogen deaminase
- PCR, polymerase chain reaction
- RA, rheumatoid arthritis
- TNFα, tumour necrosis factor α
- rheumatoid arthritis
- chemokines
- dendritic cells
- synovial tissue
Statistics from Altmetric.com
- CK, chemokine(s)
- DAS28, 28 joint count Disease Activity Score
- DC, dendritic cell(s)
- ELISA, enzyme linked immunosorbent assay
- FcγR, Fc gammas receptor(s)
- GAPDH, glyceraldehyde-3-phosphate dehydrogenase
- HAGGs, heat aggregated gammaglobulins
- HRP, horseradish peroxidase
- IC, immune complexes
- iDC, immature dendritic cells
- IL, interleukin
- LPS, lipopolysaccharide
- mDC, mature dendritic cells
- OA, osteoarthritis
- PBGD, porphobilinogen deaminase
- PCR, polymerase chain reaction
- RA, rheumatoid arthritis
- TNFα, tumour necrosis factor α
Rheumatoid arthritis (RA) is an inflammatory autoimmune disease mainly characterised by inflammation of the synovial joints, leading to progressive cartilage breakdown and destruction of underlying bone. Within both the synovial tissue and fluid there is a massive infiltration of activated leucocytes. Furthermore, in RA the synovium is characterised by features such as widespread hyperplasia and angiogenesis. Many factors have been implicated in this process, including growth factors, adhesion molecules, and chemokines (CK).
CK are members of a complex superfamily of at least 50, low molecular weight (6–14 kDa), proteins, and their importance in autoimmune diseases, neoplasia, and cardiovascular diseases has been demonstrated recently.1 They play an essential part in the interaction between leucocytes and endothelial cells. CK induce the directional migration of cells in homoeostatic and inflammatory conditions. Lymphocyte homing to secondary lymphoid tissue, frequently present in RA synovium, involves a sequel of events which is believed to be tailored by CK.2
Dendritic cells (DC) are producers of a large set of different CK.1,3,4 They are professional antigen presenting cells and have a major role in the orchestration of both innate and adaptive immune responses. In the immature state, DC (further designated as iDC) are highly specialised in antigen uptake and processing, whereas upon maturation DC (further designated as mDC) become fully equipped for antigen presentation.5–7 Intriguingly, these different functions are also performed at different anatomical sites in the body. iDC are scattered throughout the body and are therefore often referred to as “sentinels of the immune system”. Upon maturation, however, DC migrate to secondary lymphoid organs to attract and interact with T cells. The trafficking of DC, T cells, and other lymphocytes during inflammatory processes is a key event and is critically dependent on the production of CK and expression of their corresponding receptors. iDC, produce low levels of inflammatory CK (for example, DC-CK1 (CCL18), ELC (CCL19), MDC (CCL22), TARC (CCL17)) and express the inflammatory CK receptors CCR1, CCR2, CCR5 CXCR2, and CCR8.8 Upon triggering by inflammatory mediators such as tumour necrosis factor α (TNFα) and interleukin (IL)1, DC mature and down regulate the inflammatory receptors while up regulating CCR7. In addition, mDC produce large amounts of CK to attract T cells, B cells, monocytes, and macrophages.
DC have also been implicated in RA.9–13 Inflamed rheumatoid synovium has several characteristics resembling secondary lymphoid tissue, suggesting a role for CK.14,15 However, the involvement and role of DC and CK produced by DC in these processes during RA remains to be clarified.16–19 Until now, the role of CK in RA has mainly focused on the CK fractalkine (CXC3CL1),18 IL8 (CXCL8),20–22 RANTES (CCL5),23 monocyte chemotactic peptide 1 (MCP-1; CCL2),24 and macrophage inhibitory protein 1α (MIP-1α; CCL3)25 and their related receptors.
For antigen uptake DC use a wide variety of molecules, including Fc gamma receptors (FcγR). FcγR bind IgG molecules or immune complexes (IC) containing IgG which are abundantly present in the serum and synovial fluid of patients with RA. All FcγR, except for FcγRIIb, mediate cellular activation signals upon triggering.26,27 Triggering of these receptors plays a central part in immune mediated tissue injury and the immunological outcome, and is partly dependent on the balance between activating and inhibitory FcγR.28 The balance between activating or inhibiting FcγR has been shown to effect the Th1/Th2 balance.29 We have demonstrated recently that DC from patients with RA express increased levels of FcγRIIb compared with those from healthy controls.30 This altered balance led to aberrant production of proinflammatory and anti-inflammatory cytokines such as TNFα, IL6, and IL10 upon incubation with IC.30,31
In the present study we explored whether CK production by DC is altered in RA. Furthermore, we investigated the potential role of FcγR in the regulation of CK expression by DC, including several DC-specific and non-specific CK. The results demonstrated an increased expression of CK by DC obtained from patients with RA in comparison with those from healthy subjects. We show that DC from patients with active disease decreased their CK production upon triggering of FcγR by IC.
PATIENTS AND METHODS
Patients and samples
Peripheral blood mononuclear cells were obtained from 26 patients with RA attending outpatient clinics of the University Medical Centre (UMC) Nijmegen. Twenty two healthy subjects were included as controls in the present study. All patients fulfilled the American College of Rheumatology criteria for RA and gave informed consent for the study.32 The activity of the disease was assessed by the 28 joint Disease Activity Score (DAS28).33 For this study, patients with a DAS28 >3.2 were considered to have active RA. Remission in this study was characterised by a DAS28 <2.6. The number of disease modifying antirheumatic drugs used by patients with RA was taken into account, and patients who used prednisolone or biological agents, such as TNFα and IL1 blocking agents, were excluded. For immunohistochemical analysis, synovial biopsy specimens were obtained from three patients with RA, three with osteoarthritis (OA), and three healthy subjects. Synovial tissue from patients with RA was obtained by percutaneous biopsy of the knee joint by using a Parker Pearson needle under local anaesthesia. An average of 30 biopsy samples was obtained on each occasion. The synovial tissue from healthy subjects and patients with OA was isolated during arthroscopic procedures performed by orthopaedic surgeons.
For determination of synovial CK mRNA expression, synovial tissue samples of five patients with RA, five patients with OA, and five healthy controls were compared. These synovial samples were obtained by small needle arthroscopic procedures and were a kind gift of Dr B Ostendorf (Dusseldorf, Germany). Synovial fluid of seven patients with RA, five patients with OA, and five patients with gout were collected during arthroscopic procedures or joint puncture at our centre. The study was approved by the ethics committee of the University Medical Centre in Nijmegen.
Generation and culture of monocyte derived DC
Monocyte derived dendritic cells were cultured by standardised protocols as previously described.30 Briefly, peripheral blood mononuclear cells were isolated from heparinised venous blood by density gradient centrifugation over Ficoll-Hypaque (Amersham Biosciences, Roosendaal, The Netherlands). The interphase was collected and washed with citrated phosphate buffered saline, and then the cells were allowed to adhere for 1 hour at 37°C in RPMI-1640 (Life Technologies, Breda, The Netherlands) supplemented with 2% human serum in six well culture plates (Costar, Badhoeverdorp, The Netherlands). Adherent monocytes were cultured in RPMI-1640 Dutch modification supplemented with 10% fetal calf serum and antibiotic-antimycotic agents (Life Technologies) in the presence of IL4 (500 U/ml; Schering-Plough, Amstelveen, The Netherlands) and granulocyte monocyte-colony stimulating factor (800 U/ml; Schering-Plough) for 6 days. Fresh culture medium with the same supplements was added at day 3, and then iDC were harvested at day 6. To generate mDC, iDC were resuspended in fresh cytokine-containing culture medium and transferred to new six well culture plates. For the maturation process, 2 μg/ml lipopolysaccharide (LPS; E coli, Sigma, Chemical Co, St Louis, MO) was added. mDC were harvested after 2 more days of culture.
Phenotypic characterisation of DC
Expression of cell surface markers on both iDC and mDC was measured by indirect immunofluorescence staining as described in detail previously.30 Briefly, the first layer was attached after incubation of 1×10⁵ monocyte derived DC for 30 minutes at 4°C with monoclonal antihuman antibodies against CD14, CD16, CD32, CD64 (all DAKO), DC-SIGN,8 CD80 (Becton Dickinson), CD83 (Coulter), CD86 (Pharmingen), MHC-I (clone W6/32), MHC-II DQ (clone SPV-L3), and MHC-II DP/DR (clone Q1513). After a washing step, the cells were incubated with fluorescein isothiocyanate conjugated goat antimouse IgG (GAM-FITC) for 30 minutes at 4°C in complete darkness. Cells were gated according to their forward and side scattering patterns. For each marker 104 cells were counted in the gate.
Purification of monocytes
The monocytes used for detection of CK mRNA expression were purified by density gradient centrifugation and immunomagnetic separation techniques (magnetic activated cell sorting (MACS)). At first, the pellet originating from the Ficoll gradient was resuspended and incubated with CD14 positive labelled MACS microbeads (Miltenyi Biotec, Bergische Gladbach, Germany). Positively labelled cells were then isolated using separation columns that were placed in a strong magnetic field. After removal of the magnetic field, the cells were flushed out using RPMI-1640 supplemented with 10% fetal calf serum, 1% glutamate, and 1% antibiotic-antimycotic agents (all Life Technologies). Thereafter, the cells were centrifuged and the pellet was dissolved in the Trizol reagent and stored at−70°C.
CK mRNA expression by DC after stimulation with heat aggregated gammaglobulins
In certain experiments DC were cultured in the presence of heat aggregated gammaglobulins (HAGGs), which bind and cross link FcγR. HAGGs were obtained by heating human IgG (Sigma Chemicals) at 63°C for 30 minutes. Thereafter the solution was centrifuged at 12 000 g for 10 minutes, and the concentration of HAGGs was determined from the absorbance at 280 nm. HAGGs (final concentration 100 μg/ml) were then added to the culture medium for 48 hours.
Primers and probes
Table 1 shows the sequence of the primers (Life Technologies) and Taqman probes (PE Biosystems, Branchburg, New Jersey) used in this study. The CK-specific probes were labelled at the 5′ end with a FAM fluorescent group and at the 3′ end with a TAMRA quencher group. The probes specific for the housekeeping genes glyceraldehyde-3-phosphate dehydrogenase (GAPDH) and porphobilinogen deaminase (PBGD) were labelled with a VIC fluorescent group at the 5′ end.
Primers and Taqman probes used for real time quantitative polymerase chain reaction analysis4
Real time quantitative polymerase chain reaction (PCR) analysis
Total RNA was extracted from monocytes, iDC and mDC, or synovial tissue using 1 ml Trizol reagent (Life Technologies). Reverse transcriptase-polymerase chain reaction was performed using 1 μg RNA. OligodT primers were used for reversed transcription of mRNA, and 5% of the resulting cDNA was used in one PCR amplification. The latter was performed at a final concentration of 200 μmol/l dNTPs, 0.1 μmol/l of each primer, and 1 unit Taq polymerase (Life Technologies) in standard PCR buffer. As a control, the reaction was also performed in the absence of reverse transcriptase.
PCR reactions were performed in accordance with the Taqman assay instructions, using an end concentration of 175 nmol/l probe and 600 nmol/l primers.34,35 The amplifications were performed on an ABI/PRISM 7700 sequence detector system (PE-Applied biosystems). This system produces a real time amplification plot based upon the normalised fluorescence signal. The expression levels of the CK were related to the expression level of PBGD, a housekeeping gene with intermediate expression levels. Furthermore, another housekeeping gene GAPDH was used as an internal control for the amount of cDNA in every subject.
Measurement of CK in culture supernatant, synovial fluid, and serum
The CK protein level of CCL18 was measured in the supernatant of the cell cultures, synovial fluid, and serum of patients with RA and healthy subjects. The secretion of CCL18 was analysed by a specific sandwich enzyme linked immunosorbent assay (ELISA) as previously described.4 In the CCL18 ELISA, mouse antihuman CCL18 monoclonal antibody (AZN-CK18B) and goat antihuman PARC antibody (R&D systems, Abingdon, UK) were used as primary and secondary antibody, respectively. The detection antibodies were stained with horseradish peroxidase (HRP) conjugated donkey antigoat IgG (Jackson Immunoresearch Lab Inc, West Grove, PA, USA) or HRP conjugated goat antirabbit IgG (Zymed Laboratories Inc, San Fransisco, CA). HRP was visualised by incubation with 3,3′,5,5′-tetramethylbenzidine substrate. Thereafter, the absorption was measured at 450 nm using a Titertek multiscan ELISA reader (Bio-Rad Laboratories, Veenendaal, The Netherlands). The detection limit of the ELISA was 40 pg/ml.
Immunohistochemical analysis of CCL18 expression in synovial tissue
Percutaneous synovial tissue biopsy samples of RA knee joints and synovial tissue from controls obtained during arthroscopic procedures were embedded in Tissue Tek OCT (Miles Inc) and snap frozen in liquid nitrogen. Cryostat sections (7 μM) were mounted on superfrost slides and stored at −70°C until processing. Immunohistochemical localisation of CCL18 (TIL) and CD32 (FcγRII; DAKO, Glostrup, Denmark) was performed using serial sections. Briefly, cryostat sections were dried, fixed in 100% cold acetone (10 minutes), and dried again. Thereafter, endogenous peroxidase was blocked using H2O2 in phosphate buffered saline and incubated with the first antibody (5 μg/ml, 60 minutes at room temperature). Subsequently, sections were incubated with normal horse serum and with biotinylated horse antimurine IgG (Vectorlabs, Burlingame, CA, USA) and ABC complexes (Vectastain, Vectorlabs). Slides were developed with diaminobenzidine and counterstained with haematoxylin for 3 minutes. Controls consisted of irrelevant primary isotype-specific IgG1 and IgG2a (DAKO) and omission of the secondary antibodies.
Statistical analysis
Differences between the DC from RA or healthy controls were calculated with the Mann-Whitney U test and Students t test, as appropriate. p Values were two sided and the level of significance was set at p<0.05. The Wilcoxon matched pairs test was used to calculate the effects of HAGG stimulation on paired samples. For statistical analysis, Graphpad Prism version 4 was used.
RESULTS
CK expression by iDC and mDC
We evaluated the expression of a set of 11 CK known to be abundantly expressed by DC (table 1). Expression levels were related to GAPDH and presented relative to another housekeeping gene PBGD, which was set to 1. We first analysed CK expression by iDC, which were characterised by high expression of FcγRI, II, and III and DC-SIGN, low levels of MHC-I and II molecules and CD80 and CD86, and absence of CD83 (data not shown).30 iDC of 16 patients with RA (mean (SD) DAS28 5.7 (1.2)) produced low levels of the CK ELC (CCL19) and MIP-1α (CCL3) and high levels of MDC (CCL22) and TARC (CCL17), which were similar to the results for iDC from 12 healthy controls (fig 1). However, expression of CCL18 (35-fold, p<0.0001) and IL8 (CXCL8) (sixfold, p = 0.02) was significantly higher in iDC from patients with RA than in iDC from their normal counterparts. The CK SDF-1α (CXCL12), SLC (CCL21), MIP-3α (CCL20), and lymphotactin (XCL1) were expressed at lower levels than PBGD (not shown).

CK mRNA expression by immature and mature monocyte derived dendritic cells from patients with RA and healthy controls. CK expression of iDC of patients with RA (black bars), healthy subjects (light grey bars), and after full maturation (patients with RA (dark grey bars), and healthy controls (white bars)). The mRNA expression is related to PBGD expression set to level 1. Note the log scale of the y axis. The mean level of mRNA expression is indicated by the number above the bar.
As expected, stimulation of iDC with LPS for 48 hours resulted in fully matured DC (mDC), which express high levels of costimulatory, major histocompatibility complex (MHC) molecules and CD83 (data not shown). After full maturation the mRNA CK expression by DC from patients with RA and healthy controls increased dramatically except for CXCL8 and CCL3 (fig 1). The expression of CCL18 (46-fold, p<0.0001), CCL19 (19-fold, p<0.0001) CXCL8 (62-fold, p<0.01), CCL3 (13-fold, p = 0.0002), and CCL17 (sixfold, p<0.0001) was significantly higher in mDC from patients with RA than in mDC from healthy donors. CCL22 expression also increased upon maturation but the increase was similar in RA and controls. As with iDC, the expression of CCL21, CXCL12, CCL20, and XCL1 was low or not detectable (data not shown).
CK expression and relation to disease activity
To investigate whether the increased expression of CK in patients with RA was related to the disease activity we studied the CK expression in another group of 10 patients with active RA (mean (SD) DAS28 6.1 (1.6)) and compared that with six patients with RA in remission (DAS28 2.3 (0.2)) and 10 healthy subjects. Figure 2A shows that CCL18 (p = 0.0002) and CXCL8 (p = 0.003) expression is significantly increased by iDC from patients with active RA compared with iDC from patients with RA in remission and controls. The same phenomenon was seen when CK expression profiles of CCL18 (p = 0.0002), CCL19 (p = 0.0002), CXCL8 (p = 0.0002), and CCL3 (p = 0.005) for mDC were related to disease activity (fig 2B). CCL17 was the only CK which was expressed significantly more highly in patients both with active (sixfold, p = 0.02) and inactive (twofold, p = 0.03) RA than in their normal counterparts. Of note, no differences between the number of disease modifying antirheumatic drugs or non-steroidal anti-inflammatory drugs used between patients with active or inactive disease could be detected.

CK expressed by iDC and mDC in relation to RA disease activity. (A) CK mRNA expression by iDC from 10 patients with active RA (black bars), six with inactive disease (grey bars), and 12 healthy controls (white bars). (B) Production of CK by mDC from the same group of patients with active (black bars) and inactive (grey bars) disease, and healthy donors (white bars). *p<0.05. The mRNA expression is related to PBGD expression set to level 1. Note the log scale of the y axis. The mean level of mRNA expression is indicated by the number above the bar.
CK expression by monocytes
Because we used monocyte derived DC in our study, we investigated whether the increased expression of several CK was specific for DC or already present on their precursor cells. Therefore we purified monocytes and subsequently analysed their CK expression profile. In line with published reports CXCL8 (sixfold, p = 0.03) and CCL3 (sixfold, p = 0.01) were expressed at significantly higher levels in RA than in controls (fig 3). The CK CCL18, CCL19, CCL20, and CCL17 were produced at very low levels, whereas CCL21, CXCL12, and XCL1 were not detectable.
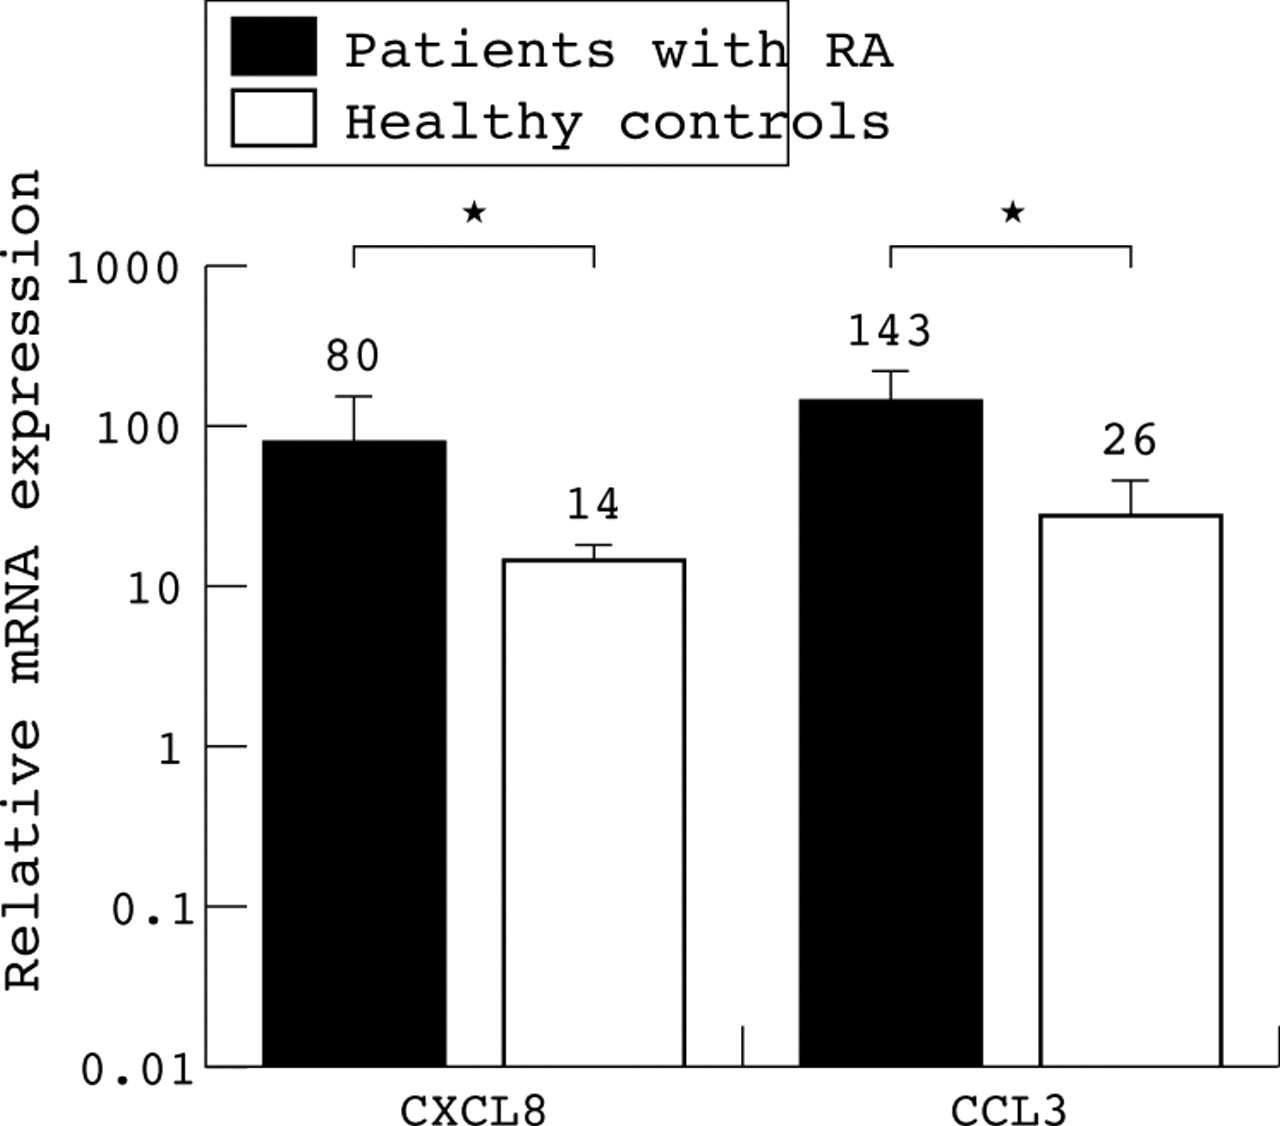
CK expression by monocytes from patients with RA and healthy controls. Relative expression of CK CXCL8 and CCL3 by monocytes of five patients with active RA (black bars) and five healthy donors (white bars), respectively. *p<0.05. The mRNA expression is related to PBGD expression set to level 1. Note the log scale of the y axis. The mean level of mRNA expression is indicated by the number above the bar.
Diminished CK production in RA after IC stimulation
In a previous study we demonstrated that DC from patients with RA express FcγRII at increased levels, resulting in an aberrant production of TNFα upon FcγR mediated triggering of these DC.30 In accordance with this finding, in this study, DC from nine patients with active RA expressed significantly higher FcγRII levels (mean fluorescence intensity (SD) 410 (61)) than five patients with inactive disease (233 (89), p = 0.008) and six healthy donors (151 (36), p = 0.002) (data not shown). No other DC phentotypic differences were seen between the groups. To determine whether CK production is affected by triggering of FcγR, we stimulated both iDC and DC during maturation (LPS stimulation) through FcγR dependent pathways by using HAGGs.
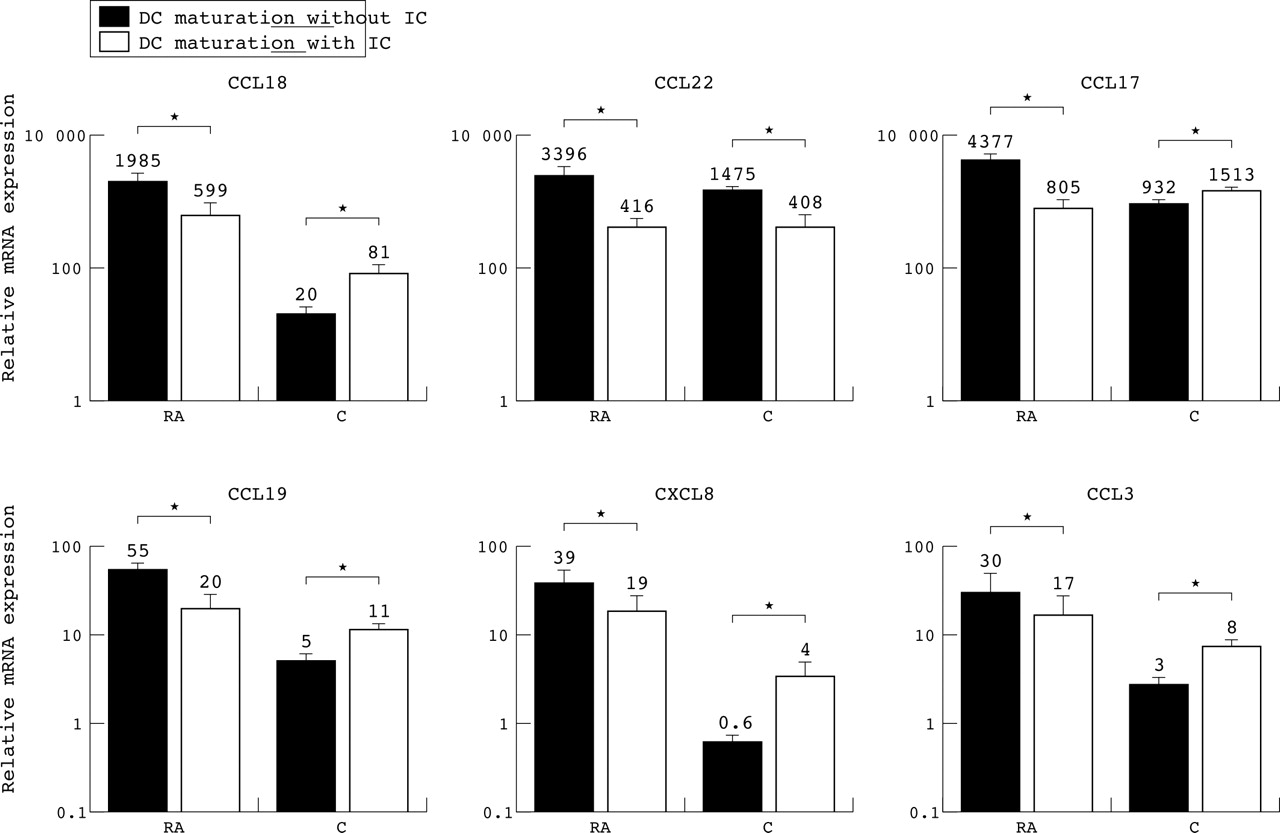
The stimulation of FcγR significantly decreased the expression of CCL18 (threefold, p = 0.03), CCL22 (eightfold, p = 0.04), CCL17 (fivefold, p<0.01), CCL19 (threefold, p<0.01), and CXCL8 (twofold, p = 0.02) by DC from patients with RA (fig 4). Although not significant, the same trend was observed for CCL3 (twofold, p = 0.1). In contrast, the opposite effect was seen for CCL18 (fourfold, p = 0.04), CCL17 (twofold, p<0.01), CCL19 (twofold, p = 0.04), CXCL8 (sevenfold, p = 0.02), and CCL3 (threefold, p = 0.02) in healthy donors (fig 4). CCL22 was the only CK in which a decreased expression (fourfold, p = 0.01) was seen after FcγR triggering in both groups, suggesting that different mechanisms are responsible for the expression of various CK. Noteworthy is the fact that despite a clear decreased expression upon stimulation with IC in RA, and the opposite effect in healthy donors, the absolute level of CK expression by DC was still higher in RA.

CK mRNA expression after triggering of FcγR on mature DC. Level of CCL18, CCL22, CCL17, CCL19, CXCL8, and CCL3 mRNA expression in the absence (black bars) or presence (white bars) of IC by mature DC from eight patients with RA and six healthy controls, respectively. ∗p<0.05. The mRNA expression is related to PBGD expression set to level 1. Note the log scale of the y axis. The mean level of mRNA expression is indicated by the number above the bar.
CK mRNA expression in RA synovial tissue
Because DC of patients with active RA express extremely high levels of CCL18, CCL19, and CCL17 we examined the expression of these three CK as well as of CXCL8 in RA synovial tissue (n = 5) and compared this with synovial tissue of five patients with OA and five healthy subjects. Figure 5 shows that CCL18 (234-fold, p<0.001) and CCL19 (406-fold, p<0.001) are expressed at significantly higher levels in RA synovium than in the synovial tissue of healthy subjects. Furthermore, synovial tissue from patients with OA showed a significantly higher expression of CCL19 (110-fold, p = 0.03) than in healthy synovial tissue but still less than in patients with active RA. Although the same trend was observed for CCL17 (threefold, p = 0.06), it failed to reach significance. CXCL8 was highly expressed in RA synovial tissue (36-fold, p = 0.03), which is in concordance with published reports.

Expression of CK in synovial tissue from patients with RA compared with patients with OA and healthy controls. mRNA expression level of the CK CCL18, CCL19, CCL17, and CXCL8 in synovial tissue from five patients with RA (black bars), five patients with OA (grey bars), and five healthy donors (white bars). ∗p<0.05. The mRNA expression is related to PBGD expression set to level 1. Note the log scale of the y axis. The mean level of mRNA expression is indicated by the number above the bar.
Protein levels of CCL18 in supernatant and synovial fluid of patients with RA and healthy controls
Because CCL18 was highly expressed by cultured DC and in the synovium of patients with active RA, the secretion of CCL18 protein was tested in the supernatant, synovial fluid, and serum of patients with RA and healthy controls. In the DC supernatant, the CCL18 protein production paralleled the expression of CCL18 mRNA as measured by real time PCR (fig 6A). CCL18 production was significantly higher in both iDC (12-fold, p = 0.02 and 17-fold, p = 0.01) and mDC (25-fold, p<0.01 and fourfold, p = 0.02) from patients with RA than in iDC and mDC from patients with inactive disease and healthy subjects, respectively. Triggering of FcγR using IC led to a decreased production of CCL18 protein (median 63%, p = 0.02) in eight of the nine patients with active RA tested, whereas an increase (median 137%, p = 0.04) in CCL18 protein production was observed in six healthy subjects, which is in line with the real time PCR data (fig 6B). Furthermore, high CCL18 protein levels were present in the synovial fluid of seven patients with active RA (median (range) 1100 pg/ml (800–1340)) in comparison with the synovial fluid of five patients with gout (300 pg/ml (150–473)) and five patients with OA (410 pg/ml (254–684)) (data not shown).

CCL18 (DC-CK1) production by iDC and mDC of patients with RA and healthy subjects before and after stimulation with anti-IgG complexes (HAGGs). (A) CCL18 protein production in supernatants of iDC and mDC from nine patients with active RA (black bars), five patients with inactive RA (grey bars), and six healthy donors (white bars). (B) CCL18 secretion by iDC after stimulation with LPS alone or LPS+HAGGs in nine patients with active RA (left panel) and six healthy donors (right panel).
CCL18 in synovial tissue—immunohistochemical analysis
So far, we have shown that CCL18 is secreted in much higher quantities by mDC from patients with RA, that the mRNA expression of this CK is highly expressed in RA synovial tissue, and that the level in synovial fluid of patients with RA was higher than that of controls. To analyse whether the expression of CCL18 in RA synovial tissue was increased in comparison with synovium of patients with OA and healthy controls, consecutive sections of synovium from three patients with RA, three patients with OA, and three healthy controls were stained for CCL18 and DC-LAMP, a marker for mature DC. Figure 7 shows that CCL18 was highly expressed in the perivascular regions and showed an overlapping pattern with DC-LAMP both in rheumatoid and OA synovium, which is in line with the high production of DC-CK1 by fully matured DC. In contrast, healthy subjects showed the presence of scarcely any CCL-18 and DC-LAMP positive cells.

Expression of CCL18 (DC-CK1) in the synovial tissue of patients with RA and OA and in healthy donors. The top row represents immunostaining for CCL18 of synovial tissue from a patient with RA, a patient with OA, and a healthy donor, respectively. The bottom row corresponds with immunostaining for DC-LAMP from the same subjects.
DISCUSSION
In this study we investigated the involvement of DC-specific and non-specific CK in the disease process of RA. We demonstrated for the first time that both monocyte derived iDC and mDC from patients with active RA express significantly higher levels of CCL18 (DC-CK1), CCL19 (ELC), CXCL8 (IL8), CCL3 (MIP-1α), and CCL17 (TARC) than those of healthy subjects. Intriguingly, this increased expression was present exclusively during the active phase of the disease. To confirm these findings at the site of inflammation we also investigated the level of mRNA expression of CCL18, CCL19, CXCL8, and CCL17 in synovial tissue and showed that patients with RA have by far the highest levels of these CK in comparison with patients with OA or healthy subjects. We confirmed this result by showing a high expression of CCL18 at the protein level. Analysis of supernatants of DC cultures and synovial fluid of patients with RA and controls confirmed the increased production of CCL18 at the protein level. These data clearly showed an increased production of CCL18 by iDC and mDC exclusively from patients with active RA. The increased production of CCL18 in RA was further substantiated by the finding that a significantly higher level of this pivotal CK is present in the synovial tissue of those patients which show an overlapping pattern with mature DC.
Dendritic cell-specific CK 1 (DC-CK1, also known as PARC or CCL18), is a CK preferentially produced by DC and plays a part in the selective chemoattraction of CD45+ RA T lymphocytes and CD38 B cells.3,36 CCL19 (Epstein-Barr virus induced molecule 1 ligand, or MIP-3β) is primarily involved in the CCR7 mediated triggering of lymphocyte arrest and has a pivotal role in the recruitment and localisation of lymphocytes within secondary lymphoid tissues.37,38 Thymus and activation-regulated cytokine (TARC, CCL17) can attract CCR4 positive cells, which are mainly Th2 cells, and therefore, appears to be important in the development of an acquired Th2 response.
The attraction of different effector cells to the site of inflammation might be important in RA pathology and possibly contribute to the formation of secondary lymphoid follicles that are often found in patients with RA. Indeed, T cells, B cells, monocytes, and follicular dendritic cells accumulate in RA synovium and form lymphocyte aggregates which reflect certain features of germinal centres.2,16,39,40 Recently, it was demonstrated that a complex interplay between T cells, DC, and, probably, B cells results in the formation of secondary lymphoid follicles in rheumatoid synovium.41,42 Interestingly, analysis of CCR7 deficient mice disclosed severe morphological alterations in all secondary lymphoid organs.43,44. Therefore, it is tempting to speculate that the abundant expression of CCL18 and CCL19 in RA synovium may partly explain why lymphoid structures arise in patients with RA. The expression of IL4 and IL13 in the synovial compartment is especially intriguing as they are known to strongly induce/up regulate the expression of CCL18.3,45 The observation that the increased production of CK is exclusively present during the active phase of disease is interesting and provides support for recent data suggesting that specific environmental factors are present during the active phase.11,46,47 Unfortunately, these studies did not examine differences between active or inactive disease states.
Another interesting observation in the present study was the decreased expression of CK observed after 48 hours of FcγR engagement of DC from patients with active RA. In contrast, FcγR dependent stimulation of DC from healthy subjects had the opposite effect—namely, a clearly increased expression of CK. The latter is consistent with the observation that stimulation of monocytes with IC from healthy donors induced an increased expression of MIP-1α, MIP-1β, and IL8 mRNA levels.48 We suggest that the opposite effects between DC from patients with active RA and healthy donors upon engagement of FcγR is the result of an altered FcγR balance in the patients with active disease. This is in agreement with our previous report, in which we demonstrated a clearly increased expression of the inhibitory FcγRII, exclusively during the active phase of disease.30 However, despite the clear decrease in expression of CK in RA upon FcγR triggering and the opposite effect in healthy donors, the level of CK expression was still much higher in RA.
Our results are in line with recent findings, which suggest a dominant role for both the activating and inhibitory FcγR and their concerted actions in determining the balance between Th1/Th2 responses and the discrimination between immunity and tolerance.29,49–51 Systemic injection of DC genetically modified to express IL4 or IL13, cytokines known to regulate the FcγR balance towards the inhibitory subtype, completely abrogated the detrimental effects of arthritis even after the development of a full blown collagen induced arthritis.52,53
In conclusion, our study strongly supports the proposed mechanisms by which DC and their expression of CK are involved in the pathogenesis of RA. Our data further strengthen the potentially important role of these CK in the inflammatory process, and indicate that the potential blockade of these CK is a highly interesting new therapeutic approach. Detailed knowledge about the role and mode of action of CK in RA might herald new opportunities for the manipulation of (auto) inflammatory responses in autoimmune diseases such as RA.