Article Text

Abstract
OBJECTIVE The objective of this study was to quantify selected features of chronic synovial tissue inflammation by computerised image analysis and to validate the results by comparison with conventional microscopic measurements.
METHODS Synovial biopsy samples were obtained from the knee joints of patients with chronic arthritis and prepared for immunohistochemical analysis using standard techniques. Following the development of special software, four parameters of chronic synovial inflammation were evaluated: intimal layer thickness, CD3+ cell infiltration, CD8+ cell infiltration and vascularity. Intimal layer thickness was expressed in microns. The intensity of CD3+ and CD8+ cell infiltration was expressed as the percentage area of the tissue section occupied by positively stained cells. Vascularity was expressed as the percentage area occupied by blood vessels. Conventional quantitative microscopic analysis was also undertaken and the results from both methods compared.
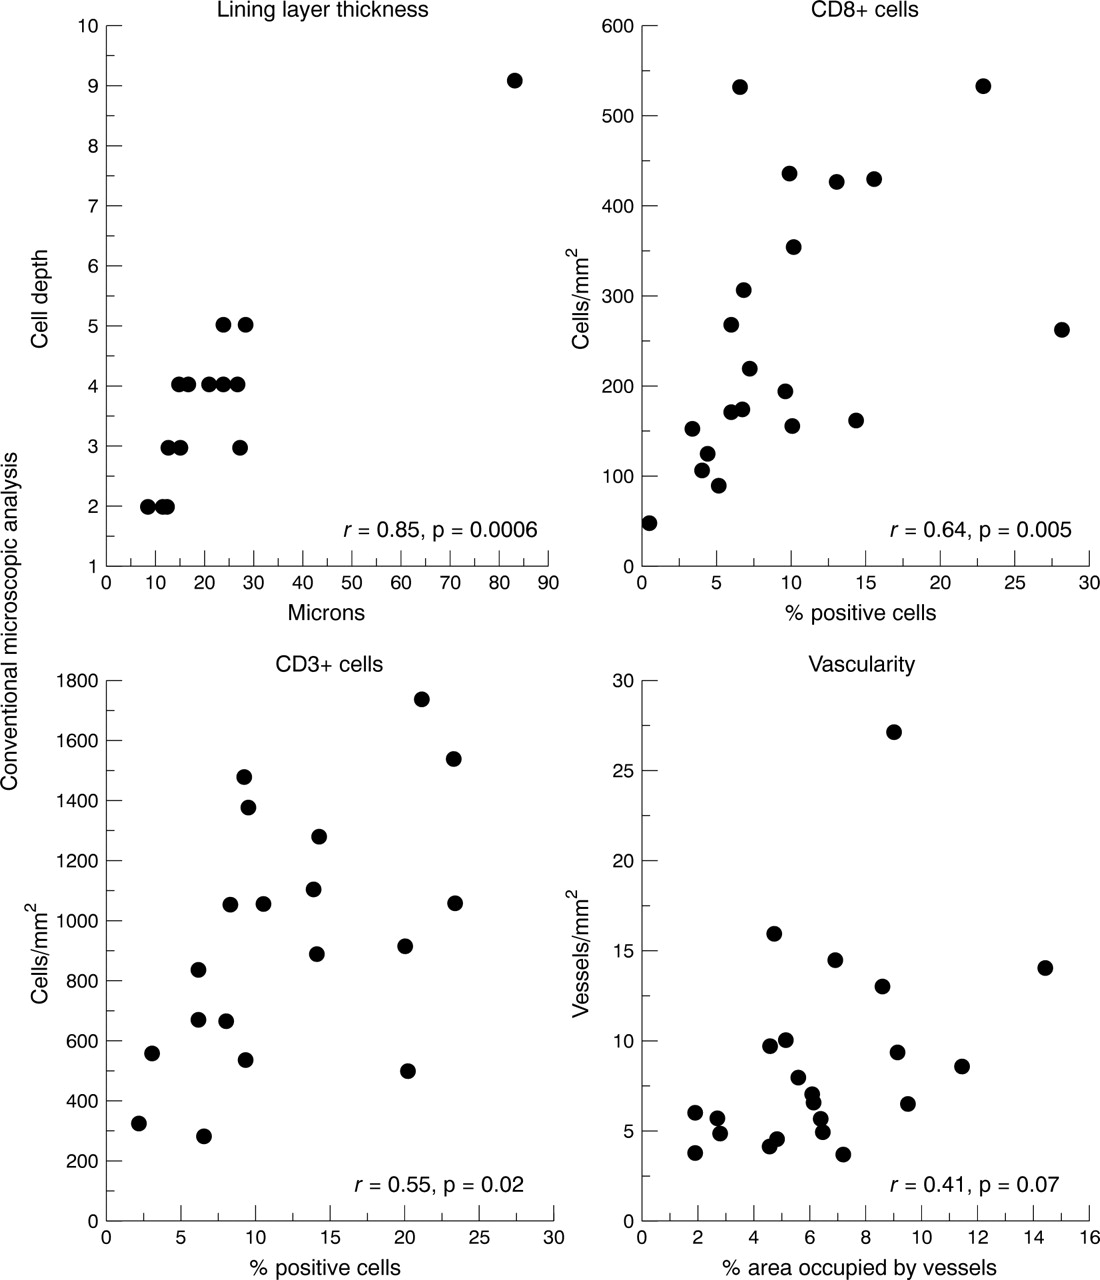
RESULTS Seventy eight tissue sections were selected for study. Measurements of intimal layer thickness by both techniques correlated strongly:r = 0.85, p = 0.0006. Measurements of CD8+ cell infiltration, usually widely dispersed, also correlated well: r = 0.64, p = 0.005. Measurements of CD3+ cell infiltration, often densely aggregated, correlated less well:r = 0.55, p = 0.02. Measurements of vascularity demonstrated no statistically significant correlation:r = 0.41, p = 0.07. Proficiency in the use of computerised image analysis was readily acquired.
CONCLUSION Computerised image analysis was successfully applied to the measurement of some features of synovial tissue inflammation. Further software development is required to validate measurement of blood vessels of variable size.
- synovitis
- inflammation
- image analysis
Statistics from Altmetric.com
Histological parameters of articular inflammation may be reliably quantified by microscopic analysis of synovial tissue.1 Features of synovial inflammation that can be readily evaluated microscopically include the accumulation of fibroblasts and mononuclear phagocytic cells in the lining layer, the intensity of sublining layer mononuclear cell infiltration and the degree of vascularity. Repeated synovial biopsies have been included in several therapeutic studies.2-7 The development of practical arthroscopic techniques has provided investigators with further access to multiple, relatively large synovial tissue samples for analysis.8
In some previous studies, microscopic measurements of synovial tissue inflammation required detailed and time consuming quantification of extensive areas from multiple samples1 ,6; in others, a simpler semiquantitative method was used.4 ,5 In a comparison of semiquantitative and quantitative analysis of synovial tissue inflammation, it was observed that the two methods correlated well in a cross sectional study, but that semiquantitative measurement lacked sensitivity to biologically relevant changes in mononuclear cell infiltration.9 Thus, quantitative microscopic measurement of synovial tissue inflammation seemed to be optimal.
Computerised image analysis offers the possibility of objectivity, reliability and rapidity in the measurement of pathological change in human tissues and good success has been reported with blood smears.10 ,11 However, unlike cytological samples, tissue sections are more complex with overlapping cells and a variety of different structures. Progress in this area has been less rapid, although some success has been achieved with image analysis of cervix, bone marrow, lymph nodes, brain, endometrium, liver, kidney, prostate, colorectum, breast, muscle and nerve tissue.12 The aim of this study was to measure features of chronic synovial tissue inflammation by computerised image analysis and to compare the results with conventional microscopic measurements. The features of chronic inflammation selected for analysis included intimal layer thickness, vascularity and both CD8+ cells, usually widely dispersed and relatively easy to quantify, and CD3+ cells, often forming densely aggregated and overlapping cellular infiltrates.
Methods
SYNOVIAL TISSUE SAMPLES
Good quality sections of synovial tissue with an intact lining layer were selected for study from a large bank of available tissue sections. A range of inflammatory change from mild to severe was included when selecting the tissue sections. Most of the samples had been included in previous immunohistochemical studies completed at St Vincent’s University Hospital.1 ,6 ,9 ,13 Ethical approval for synovial biopsy had been obtained from St Vincent’s University Hospital Ethics Committee. Samples had been obtained either by blind needle biopsy or needle arthroscopy from an inflamed knee joint. Arthroscopy was performed using a 2.4 mm Storz needle arthroscope and samples were obtained form different sites within the joint (suprapatellar pouch, medial and lateral walls and cartilage-pannus junction)
HISTOLOGICAL PREPARATION
Synovial tissue samples were prepared as previously described.1 ,9 Briefly, the tissue was immediately snap frozen in optimal cutting temperature (OCT) embedding medium (Tissue-Tek) (Miles Inc, Elkhart, IN) by immersion in liquid nitrogen and stored until use. Cryosections, 7 microns (μm) in thickness, were cut using a cryostat and placed onto glass slides, air dried overnight, and then wrapped in tin foil to store at −70°C. Before staining, the slides were thawed at room temperature for 15 minutes and then fixed in acetone. A standard three stage immunoperoxidase technique was used, with monoclonal antibodies (Dako Ltd, High Wycombe, England) against CD3, CD8 and von Willebrand factor (vWF). Colour was developed with 3,3’ diaminobenzadine (Sigma Chemical Co Ltd, Poole, England) and the slides were counterstained with haematoxylin.
QUANTITATIVE MICROSCOPIC ANALYSIS
All sections were systemically examined throughout their entire area by a single assessor (GC) blinded to the identity and clinical details of the patients. A Leitz Wetzlar Dialux 20 microscope was used to examined the sections under 400 × magnification and a graticule fitted into one of the eye pieces of the microscopic allowed analysis of the tissue with reference to high power fields (HPF). A cell was regarded as exhibiting positive staining if a nucleus was identified in association with appropriate staining. Scoring the sections was achieved by counting the number of positively staining cells or vessels per HPF. Each HPF measured 0.25 mm2, giving a conversion factor of 0.0625, which was used to express the result in mm2. Lining layer thickness was recorded as the number of cells in depth at three designated points in each HPF (at the midpoint of each HPF, and 0.3 HPF to the left and right of the midpoint) along the entire length of visible lining layer in all samples. The mean value for lining layer depth for each patient was derived from these measurements. The time taken to count and calculate all results was recorded for each parameter studied.
Intraobserver variability was measured by repeated measurement of these parameters in selected samples of synovium over a period of months. The mean coefficients of variance were 3.7% for CD3+ cells, 2.3% for CD8+ cells, 1.4% for vascularity and 1.2% for lining layer thickness.
COMPUTERISED IMAGE ANALYSIS
Synovial tissue sections were examined with a Polyvar II microscope (Reichart-Jung, Vienna, Austria) equipped with a three chip charged coupled device colour (CCD) camera (DXC-750P, Sony Corp, Tokyo, Japan). The images were analysed in a Quantimet 600S (Q600) image analyser (Leica Cambridge Ltd, Cambridge, UK) linked to a PC computer. Special software (Posarea) was written in the high level language, QUIPS, by LB and used to detect positively stained areas in the synovium. The instruments were initially calibrated before the parameters of synovial membrane inflammation were measured by GC and LB working together without access to the conventional microscopic measurements.
Measurement of lining layer thickness
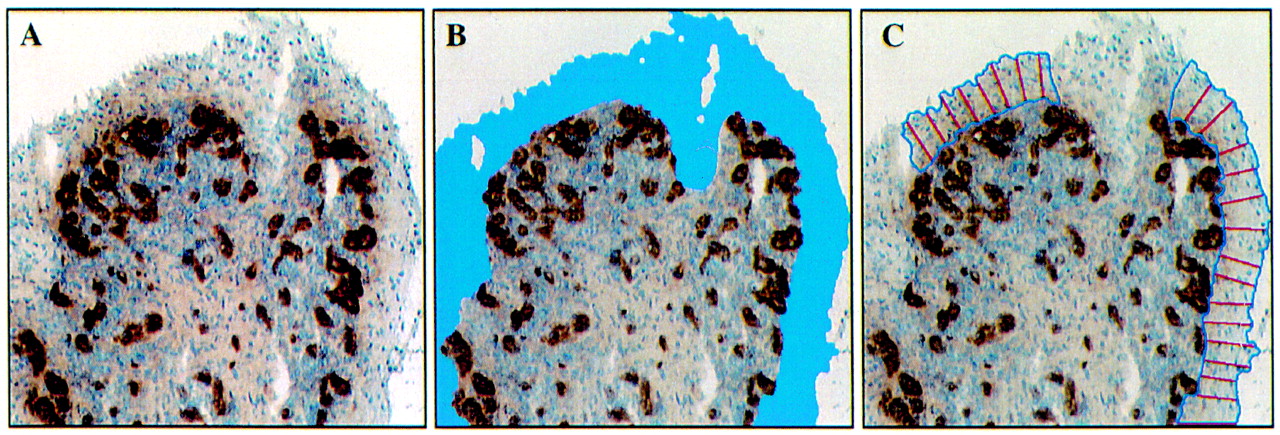
Sections stained for vWF were used to determine lining layer thickness. Lining layer depth was measured by drawing perpendicular lines from the outer surface to the inner margin of the lining layer at intervals of 20–30 μm (fig 1). These lines were then measured and the mean result expressed in microns.

Automated measurement of lining layer thickness. The tissue section is stained for von Willebrand factor (A). The lining layer contains no blood vessels and is easily identified (B). Perpendicular lines at 20–30 μm intervals represent the lining layer thickness (C). The middle section of the lining layer is interupted by a cutting artefact.
Detection of positively stained cells (CD3 and CD8)
The images were viewed at 200 × magnification, then digitised and divided into 736 × 574 pixels. Threshold levels of brightness were set and a temporary binary colour image was superimposed on the digitised image. The areas of interest (brown stained DAB+ cells) were outlined in a pseudocolour followed by a separate assessment of the total number of nucleated haematoxylin stained cells (fig 2). This allowed the operator to check the accuracy of the measured image. Each colour is a unique combination of red, green and blue (RGB) ranging between levels of 0–255, allowing detection of over 16 × 106 different colours. Thus, to identify brown DAB stained cells, selected RGB threshold values were obtained. Next, the RGB threshold values for the total haematoxylin stained cells were determined. Minimum and maximum sizes of the cells of interest were also identified. Thus, two set of values were obtained, one for the area occupied by DAB stained cells, the second for haematoxylin and DAB stained cells. The final results were expressed as the percentage area occupied by DAB stained cells from the total area of haematoxylin stained cells.

Automated measurement of CD3+ and CD8+ cell infiltration. The panels illustrate the interactive steps in the computerised image analysis routine for quantifying areas occupied by CD3+ cells (A, B, C) and CD8+ cells (D, E, F). Panels on left (A and D) demonstrate the digital images of stained cells acquired from the microscope. The middle panels (B and E) outline in pseudocolours the area occupied by immunohistochemically stained cells as judged by the computer. Panels on right (C and F) illustrate the total area of haematoxylin stained nucleated cells outlined in pseudocolours. The area occupied by CD3+ cells is 18 200 μm2 (B) and of total haematoxylin stained 53 100 μm2 (C) representing an incidence of 34.3% CD3+ cells in this area. CD8+ cells covers an area of 3400 μm2 (E) and total cells 29 700 μm2 (F), indicating 11.4% CD8+ T cells in this field.
Detection of vessels stained with vWF
Using tissue samples stained with vWF, blood vessels were identified as areas surrounded by positively stained endothelial cells. The area measured included the perimeter of the blood vessel as well as the vessel lumen. This was compared with the area occupied by the tissue as a whole and the final result expressed as the area occupied by blood vessels as a percentage of the whole tissue (fig3).

Automated measurement of vascularity. Following staining with von Willebrand factor the left panel (A) represents the digital image of blood vessels acquired from the microscope. The middle panel (B) outlines in pseudocolour the area occupied by the blood vessels, including the endothelial cells and lumen. The right panel (C) illustrates the total tissue area analysed for vascularity depicted in red pseudocolour by the computer. The blood vessels occupy an area of 29 300 μm2 (B) while the total tissue area is 143 000 μm2 (C), meaning that the vascular area in this field represent 20.5% of the total area.
Interobservor variation between two investigators (GC and LB) using computerised image analysis was evaluated from 42 randomly selected tissue sections after three days collaboration: lining layer thickness (n = 7) r=0.96, p=0.0001; CD3+ cells (n=16)r=0.90, p= 0.0002 ; vessels (n = 19)r = 0.87, p = 0.0001.
STATISTICAL ANALYSIS
Analysis of the data was performed using Statview SE and Graphics statistical software (Abacus concepts, Berkeley, CA, USA). Comparisons between the conventional microscopic and automated measurements were made with Spearman rank correlation statistics. p Values of <0.05 were considered significant.
Results
Seventy eight tissue sections were selected for study: 17 to quantify lining layer thickness, 20 for CD8+ cell infiltration, 19 for CD3+ cell infiltration and 22 for vascularity. Table 1 details the measurements. Thus, after conventional microscopic quantitative analysis of lining layer thickness by GC, the 17 sections were subjected to computerised image analysis and the results of the two methods compared. The mean tissue area examined for lining layer thickness was 1.83 mm2 per section and ranged between 0.3 and 12.2 mm2. The results obtained from computerised image analysis ranged between 8.9 and 82.9 μm thickness compared with lining layer cell depth of between 2 and 9 measured by conventional microscopic analysis. The mean tissue area of the 20 sections selected for measurement of CD8+ cell infiltration was 3.7 mm2 and ranged between 0.5 and 23.1 mm2. The results obtained by computerised image analysis ranged between 0.1 and 7.7% of the total area occupied by infiltrating mononuclear cells compared with between 48 and 528 cells/mm2 measured by conventional microscopic analysis. Similarly, the mean tissue areas of the 19 sections selected for measurement of CD3+ cell infiltration and the 22 sections selected for measurement of vascularity were 1.2 mm2 (range 0.3–4.5) and 2.0 mm2 (range 0.4–12.9) respectively. The results are included in table 1.
Measurement of synovial membrane inflammation
Figure 4 illustrates the correlations between the two methods. Thus, measurement of lining layer thickness by computerised image analysis correlated strongly with conventional microscopic analysis (r = 0.85, p=0.0006). Similarly, measurement of CD8+ cell infiltration (usually widely dispersed throughout the synovial sublining layer) by computerised image analysis correlated well with microscopic analysis (r=0.64, p=0.005). Measurement of CD3+ cell infiltration (frequently forming dense cellular aggregates) by computerised image analysis correlated less well with microscopic analysis (r=0.55, p=0.02) Measurement of vascularity demonstrated no statistically significant correlation although a trend was observed (r=0.41, p=0.07).
Correlations between computerised image analysis and conventional microscopic analysis of synovial tissue inflammation using Spearman rank correlation statistics.
Table 2 shows the time required to complete the measurement of each selected parameter. Measurement of synovial lining layer thickness was completed in the shortest time (mean 3.7 minutes per section using computerised image analysis, 2.0 minutes by conventional microscopic analysis). Not surprisingly, measurement of CD8 positive and CD3 positive cell infiltration required more time but there were no significant differences between the two methods.
Time required for microscopic measurement of inflammation in the synovial membrane
Discussion
Sections of synovial tissue demonstrating a wide range of inflammatory change were selected for assessment of lining layer thickness, CD3+ and CD8+ cell infiltration and vascularity. Measurements of CD3+ and CD8+ cell infiltration were included because they represented populations that are often densely aggregated (CD3+) or are usually widely dispersed (CD8+). Good correlations between computerised image analysis and conventional microscopic quantitative analysis were observed for lining layer thickness and for CD8+ cell infiltration. A weaker correlation was observed for CD3+ and there was a poor correlation for vascularity.
Adapting the principles of conventional microscopic quantitative analysis to automated image analysis involved computer programming and suitable hardware with a rapid processing time. Information that is obvious to the observer must be specifically indicated to the computer. The human eye can easily interpret clusters of cells and count each cell separately, whereas the computer may observe these as a single object. This may explain the good correlation observed in this study between microscopic and automated quantitative analysis of discreet cell populations such as CD8+, while the correlation was less good for the CD3+ cell aggregates. It is possible that the accuracy of the automated quantitative measurements of aggregated cells could be improved by using thinner tissue sections of 4 or 5 μm rather than 7 μm as in this study. Thinner sections would reduce the number of superimposed cells and improve the discrimination of individual cells by computerised image analysis. CD3+ and CD8+ stained cells were calculated by the computerised image analysis system as a percentage based on the area occupied by surfaced stained cells (brown DAB staining) out of the total area occupied by haematoxylin stained cells (a blue nucleus staining). This approach can be justified in assessments of lymphocytes, where the cytoplasmic contribution to the volume of the cells is very limited. However, future assessments of cells expressing a larger cytoplasmic area, such as macrophages, will probably require additional counterstaining of the cells for accurate results. In the assessment of vascularity, it was not surprising to find a poor correlation between microscopic quantitative analysis and computerised image analysis. Vessels vary in size and shape; in addition some may be cut tangentially. Thus, a small number of vessels may occupy a disproportionately large area, causing a low value by conventional analysis and a high result by computerised image analysis. This problem was also encountered by Kohlberger et al in the assessment of factor VIII related antigen in breast carcinoma where no correlation was observed between quantitative analysis and computerised image analysis.14 A further problem complicating computerised image analysis is its inability to distinguish tissue artefacts that may be interpreted as positive cells and thus included in the results. However, mechanisms are included in the system to increase the accuracy of the computer-based evaluation of the images acquired in the microscope. These images are simultaneously transferred by the colour video camera for analysis and to a monitor, where the decision made by the computer will be displayed in discriminating pseudocolours. There is at this stage a choice for the operator to accept or discard the result of the analysis of a particular field.
One possible solution to the problem of object number versus object area is to design a programme that will allow the computer to enumerate the object of interest. However, programming a computer to recognise complex visual images is difficult. In this study, the objects of interest were identified by their size and colour. Cells such as CD3+ and CD8+ are of uniform size, so it was expected that area and actual number of cells would correlate. Further quantification using computerised image analysis would require the process of segmentation. This entails separating the item of interest from miscellaneous background materials and then categorising the object appropriately. It is a challenging problem particularly for tissue sections because of highly irregular image structures, inconsistent staining, out of focus image components and variability in the objects of interest. Additional programming to help achieve accuracy in tissue assessment may include edge detection, pattern matching or thresholding (identification of light objects on a dark background or vice versa). All of this can be done manually by an operator using a cursor, but involves subjective judgements and a significant amount of time. An algorithm could be developed to accelerate this process. This might incorporate decisions regarding the threshold, making the necessary corrections using the microscopic image as a reference, filling out the missing areas and deleting areas that have been inadvertently included. Thereafter the procedure could be fully automated. Such a program if validated would be extremely valuable in the assessment of synovial tissue. But until such a program exists, the computer requires calibration for each set of measurements and this is a time consuming procedure.
It had been expected that an automated system would significantly accelerate quantitative measurement. In this study the conventional microscopic and automated measurements were equally time consuming. However, it must be emphasised that the observations were based on comparing the performance of a very experienced microscopist (GC) and a new, not yet fully perfected, automated technology. It is probable that future improvements in the computerised system will considerably reduce the analysis time. It is also noteworthy that proficiency in computerised image analysis was easily acquired, as represented by the low interobservor variation between a novice (GC) and an experienced operator (LB). Conventional microscopy studies of great numbers of slides include a risk of observer fatigue, which may jeopardise the accuracy of the measurements. Digital image analysis offers an advantage of being less exhausting when many samples are to be processed.
Computerised image analysis has been successfully adapted to examine other components of tissue sections. Measurement of the intensity of the object of interest has been found to be accurate and reproducible, but is used mainly in the assessment of cytokines and adhesion molecules.7 ,15-18 Furthermore, computerised image analysis is useful in quantification of nuclei or mitotic indices in both malignant and non-malignant tissue.19 With the continuing rapid development of computer technology, the prospects for further improvement of image analysis in synovial tissue are good. Widespread availability of validated, more rapid and user friendly computer programmes will have a significant impact on both clinical and research investigations.
Conventional microscopy is a good tool for counting but poor at measuring areas, distances or densities. In contrast, computers are better for measurement than counting. The method selected for analysis should be determined by the purpose for quantification and how many samples need to be processed. A very accurate cell count may be required for descriptive work and cross sectional studies, while sequential studies may be better evaluated by computer assisted image analysis.