Article Text

Abstract
OBJECTIVES Current methods of monitoring chronic synovitis in a single joint rely on clinical examination derived indices, such as the detection of synovial thickening. This study aimed to develop a reproducible method for quantifying the volume of synovial lining in chronic synovitis using contrast enhanced magnetic resonance (MR) imaging.
METHODS The knees of 18 patients with chronic synovitis were examined (34 studies). A 2D T1 weighted FLASH sequence was used to evaluate the temporal enhancement of synovial structures after intravenous contrast. Synovial lining volume was calculated from subtraction of pre and post-enhancement 3D T1 weighted MP RAGE images with thresholding and pixel counting. Eleven patients were examined before and after intra-articular glucocorticoid (mean interval 14 weeks) and MR data compared with changes in clinical examination derived indices of disease activity.
RESULTS Synovial lining volume varied from 52–267 ml. The coefficient of variation in volume calculation was 3.5% for a single observer and was 3.8% for two observers. Synovial lining volume was quantified in all patients where synovial lining thickening could not be detected clinically. A decrease in synovial lining volume of >40% was associated with an improvement in synovial lining thickening, detected clinically. Decreases in synovial lining volume were quantified by MR in two of three patients where changes in clinical examination derived indices were inconsistent.
CONCLUSIONS A reproducible method of estimating the volume of synovial lining in patients with chronic synovitis has been developed. MR measurement of synovial lining volume may quantify changes in chronic synovitis that remain unidentified by clinical measures.
- magnetic resonance imaging
- knee
- chronic synovitis
Statistics from Altmetric.com
In chronic synovial inflammation, the synovial lining becomes swollen mainly as a consequence of an increase in tissue cellularity and fibrosis.1 Clinical assessment of synovial swelling taken together with pain, tenderness, and stiffness, remains the most direct indicator of current disease activity in a given joint and is of particular importance when evaluating the response to local treatment, such as intra-articular glucocorticoid injection.2 However, clinical assessment of synovial swelling is qualitative and quantification of synovial lining volume by imaging techniques may provide a more reliable index of synovial disease and, therefore, be of greater assistance in the management of chronic synovitis.
Although magnetic resonance (MR) imaging has been shown to be useful in the assessment of joint abnormality in rheumatoid arthritis (RA),3 there is no consensus over the optimum MR methods for imaging synovial tissue in disease. For example, there may be difficulty discriminating between the synovial lining and synovial fluid with conventional T1 and T2 weighted sequences in the knees of RA patients.3 ,4 Heavily T2 weighted images may allow such a discrimination5; however, signal contrast between the two tissues may be insufficient to allow image analysis techniques to separate the synovial lining from synovial fluid. MR imaging with intravenous contrast enhancement has been shown to identify thickened synovium in RA4 6–8 and may permit the precise identification of equivocal or unsuspected synovial disease processes.9 ,10 In non-chronically-inflamed joints, contrast enhancement of synovial fluid may occur soon after synovial lining enhancement,11 thus, may affect the accuracy of contrast enhanced MR techniques designed to discriminate between synovial lining and synovial fluid. However, with chronically inflamed synovium, the rapidity of solute diffusion into joints may be reduced compared with normal12 suggesting that enhanced MR techniques may be useful in patients with chronic synovitis. The potential of contrast enhanced MR imaging in aiding monitoring of chronic synovitis either through synovial lining volume quantification13–15 or synovial lining contrast enhancement,16 has been reported.
In this study, we have aimed to develop a reliable method for identifying the synovial lining and, through image analysis, calculating its volume in patients with chronic knee synovitis. The technique was applied to evaluate the change in synovial lining volume in the knee associated with intra-articular glucocorticoid injection. In these patients, we aimed to compare MR parameters with clinical indices of chronic synovitis severity detected before and after treatment.
Methods
PATIENTS
Eighteen patients (11 male, 7 female) with chronic knee synovitis (>2 years) were studied. Rheumatologists had been asked to consider referring patients with knee synovitis. Eleven patients (5 male, 6 female) satisfied the American Rheumatism Association criteria for RA.16 Five patients (4 male, 1 female) had seronegative arthritis: two of these had synovitis associated with ulcerative colitis; one had psoriatic arthritis, one had post-enteritic (campylobacter) reactive arthritis, and one had sexually acquired reactive arthritis. The other diagnoses for two men were synovitis associated with polyarteritis nodosa and chronic monoarticular synovitis. All patients gave informed consent before study entry. Table1 shows the patient details.
Patient characteristics and baseline clinical examination findings
All patients were studied by MR. Thirteen patients underwent treatment by drainage of the effusion and injection of 40 mg triamcinolone hexacetonide (Lederspan, Lederle). In these patients an MR scan was performed 2–10 days before treatment and a repeat MR study was performed between 11 and 16 weeks after treatment. Four patients agreed to be re-studied after a similar interval but had not received intra-articular treatment after the first study. One patient declined follow up study (table 2).
Baseline and follow up MR data
All patients were clinically assessed (by GC) at baseline and at the time of the second MR scan. The examination features of chronic synovitis were recorded: joint effusion was identified by either the ‘patellar tap’ or Kellgren’s sign18 and synovial thickening detected by palpation around the margins of the patella and over the anterior aspect of the femoral condyles, was recorded as present or absent.
MR: SCANNING PROCEDURE
All patients were examined on a 1Tesla scanner (Siemens Magnetom 42SP) in a circularly polarised transmit and receive knee coil. The knee was stabilised with foam padding and the foot stabilised with sandbags. A long intravenous line with a 21 gauge butterfly needle was inserted in the forearm before the scan. This facilitated access to the intravenous line throughout the study without having to move the patient out of the centre of the magnet thus avoiding the need to retune between sequences.
Temporal enhancement of the synovial lining and synovial fluid was examined from serial images acquired using a 2D T1 weighted FLASH (fast low angle shot) sequence (TR 27 ms, TE 4 ms, FA 40°, FOV 350 mm, Ma 256×256, Nex 1 TAcq 9 s) in the sagittal plane with three 10 mm contiguous slices centred on the intercondylar notch. Scans were made immediately before intravenous injection with 0.1 mmol/kg meglumine gadopentate (Gd-DTPA) (Magnevist, Schering Healthcare) every 15 seconds for 300 seconds after enhancement, and then every five minutes for 60 minutes after the 3D T1 weighted sequence (see below). Dynamic sequence parameters were chosen to permit a high temporal resolution. This necessitated using a larger FOV than was used for images used for tissue volume calculation (see below).
The evaluation of synovial lining volume was made from 3D T1 weighted MP RAGE (magnetisation prepared rapid acquisition gradient echo19) (TR 10 ms, TE 4 ms, TI 500 ms, FA 40°, FOV 210 mm, Ma 256×256, slice thickness 2 mm, Nex 1 Tacq 9 min) sequences made before and 300 seconds after intravenous injection of 0.1 mmol/kg Gd-DTPA. The timing of the post-injection sequence was reasoned to be optimum on the basis of results from dynamic sequence studies of knee joints in four patients with chronic RA synovitis (unpublished findings). In these studies (2D T1 weighted FLASH: TR 27 ms, TE 4 ms, FA 40°, FOV 350 mm, Ma 256×256, Nex 1, Tacq 9 s), the rate of synovial lining enhancement was found to vary considerably in agreement with published data.7 The MP RAGE sequence was timed early enough to identify synovial lining enhancement before synovial fluid enhancement but was sufficiently delayed to allow for adequate diffusion of Gd-DTPA throughout the tissue.
Finally, to confirm the distribution of fluid within the joint (as distinct from soft tissue), after completion of the dynamic scans, a heavily T2 weighted scan was acquired in the sagittal plane using a 3D FISP (fast imaging with steady state precession) sequence (TR 31 ms, TE 10–47 ms, FA 40°, FOV 180 mm, Ma 256×256, effective slice thickness 1.7 mm, Nex 1 TAcq 8 min 30 s).
MR: IMAGE ANALYSIS
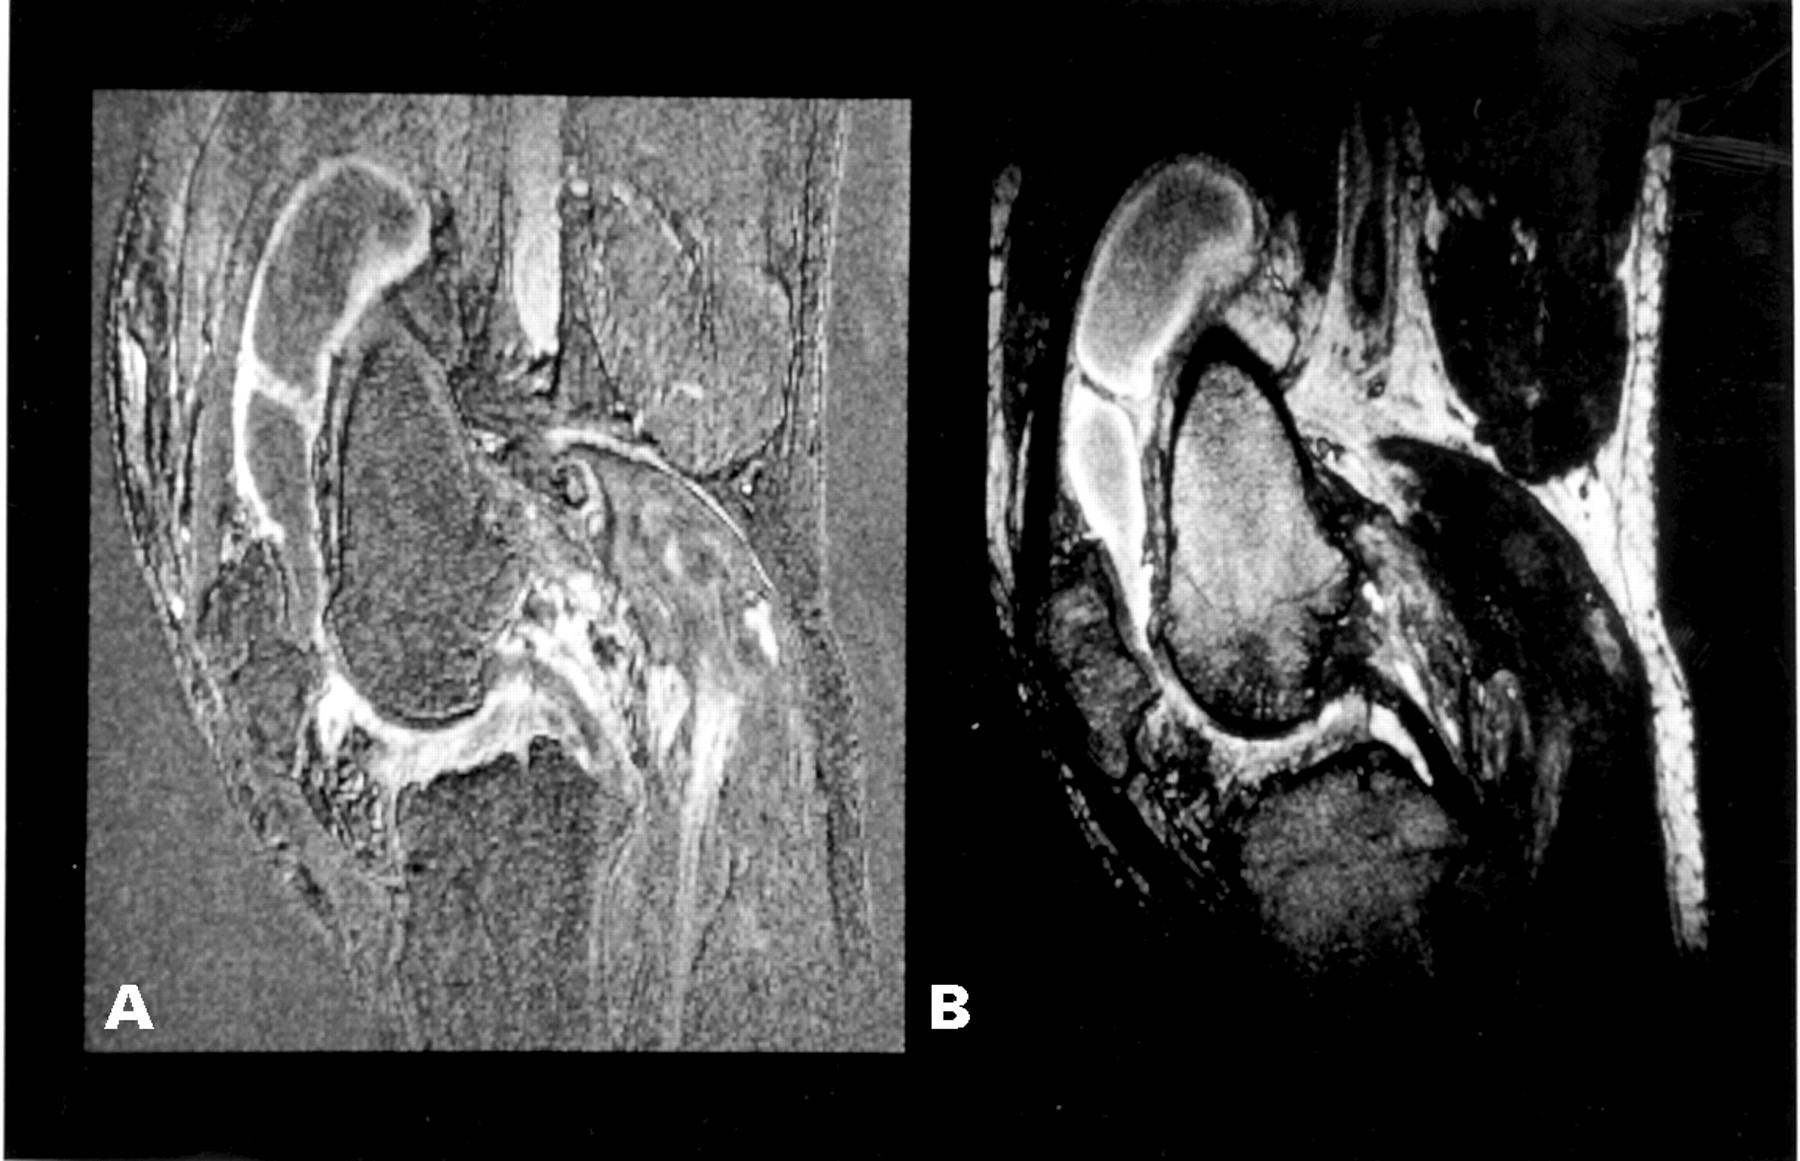
The temporal enhancement of synovial structures was assessed by measuring the mean pixel signal intensity of small regions of interest (ROI) placed on serially acquired 2D FLASH datasets using standard Siemens software (fig 1). The first ROI was placed over a small area of synovial lining of the anterior knee compartment in the central image. Where discrimination of synovial lining from synovial fluid was not easily apparent, tissue margins were judged by changes in pixel values recorded by software profile analyses. A second ROI was placed in the synovial fluid adjacent to the synovial lining (juxta-synovial lining) and a third positioned within the centre of fluid within the suprapatellar pouch (if space allowed). The position and size of the ROIs were kept constant from image to image in the dynamic series. Signal intensity was normalised by expressing the data as a ratio of the post-enhancement to pre-enhancement measurements. Studies were excluded from the analysis if the volume of the tissue of interest was too small to accommodate a ROI of at least 10 pixels, if there was an obvious technical problem with contrast enhancement or if the ROI moved significantly in serial images (see fig1).

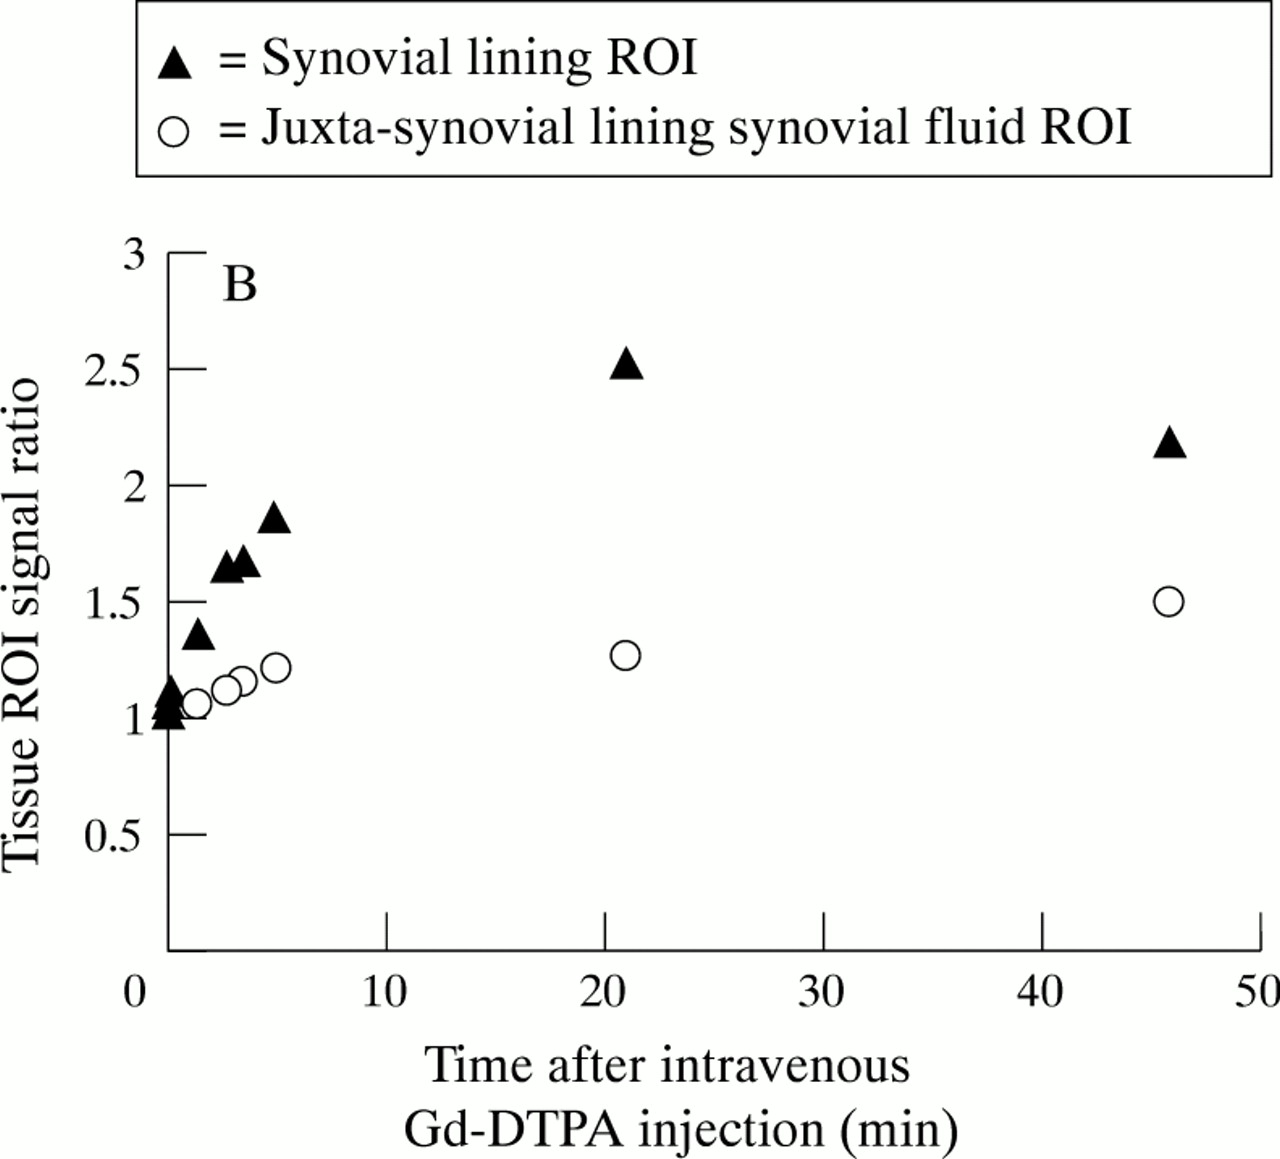
Serial sagittal knee images using 2D FLASH (central slice) in a patient with RA (A). ROIs were placed over the suprapatellar pouch synovial lining and juxta-synovial lining synovial fluid. Signal intensity in each tissue ROI was recorded before (image 69) and at intervals (image nos 72–211) after administration of intravenous Gd-DTPA. Signal intensity in consecutive image ROIs was expressed as the ratio of post to pre-contrast values (B). Consecutive data points correspond to images in (A).
MP RAGE datasets were transferred to a Sun SPARC 2 WorkStation. Pre and post-enhancement images were subtracted using in house software and resulting images analysed using XDISPIM (UCL, London). A manually selected ROI was used to exclude non-synovial lining enhancing structures such as popliteal blood vessels and skin (fig 2). Popliteal bursae were included in the ROI. A signal intensity threshold was applied to the ROI pixel values to exclude signal from unwanted structures that had lower signal intensity than the synovial lining (fig 3). Synovial lining volume was calculated by counting the number of pixels in the ROI and multiplying the total by the known voxel volume. The total volume of enhancing synovial lining was then obtained by summing the volumes obtained from all slices. Total synovial lining volume was correlated to synovial lining volume in a single sagittal slice located centrally in the knee. Changes in the different measures of volume, associated with glucocorticoid injection, were compared. Synovial lining volume was correlated to the time to maximum synovial lining enhancement and to peak synovial lining enhancement.

Isolation of synovial lining from 3D MP RAGE T1 weighted scans. Pre-enhancement image (A) and post-enhancement image (B) are subtracted. Signal in the synovial lining and blood vessels (C) is separated by placing a manually defined ROI around the synovial lining to create a synovial ‘mask’ (D) used for pixel counting.

Effect of varying pixel signal intensity threshold on % maximum area of perisynovial soft tissue (n=37), bone (n=22), synovial fluid (n=19), and synovial (n=30) ROIs (each >10 pixels) in the subtracted image. Bars represent means. Data from 64 images taken from the first six patients studied. Inclusion of non-synovial lining pixels in the manually placed synovial ROI in the subtracted image, may result in an overestimate of synovial lining area/slice. As these areas are of low signal intensity, they may be omitted by applying a pixel signal intensity threshold. However, too high a threshold may omit areas of ‘true’ synovium leading to an underestimate of synovial lining area/slice. For example, a threshold of 36 would omit all non-synovial pixels but would reduce the synovial area/slice by over 20%. The balance of errors suggested an optimum threshold of 24.
To determine the optimum signal intensity threshold, we initially studied the effect of varying threshold on pixel area of synovial and various non-synovial regions within the subtracted images from the first six studies (fig 3).
To evaluate the variation associated with synovial lining volume calculation, the analysis of each subtracted MP RAGE dataset was undertaken twice by one observer (GC) at least three weeks apart (17 studies) and was compared between two observers independently (GC and AK, eight studies). AK was blinded to patient identity, clinical details, and outcome.
STATISTICAL ANALYSIS
The precision of synovial volume calculation for both a single observer and for two observers, was expressed using the coefficient of variation (CV). The relations between: the calculated volume of synovial lining from one sagittal slice and total calculated synovial volume; maximum synovial lining enhancement and total synovial volume; and time to maximum synovial lining enhancement and total synovial volume, were examined using Pearson correlation coefficients. The strength of the relation between each pair of variables was tested using analysis of variance (ANOVA). Data were compiled, and statistical tests applied, using Microsoft Excel 5.0.
Results
Table 1 shows baseline clinical details. A total of 34 full MR studies (dynamic and volumetric studies) were performed in 18 patients. Two patients declined follow up study.
Twenty six dynamic studies were completed. Non-completion of a dynamic study was most commonly because of patient claustrophobia in the magnet (see table 2). Results were available from 21 of 26 completed dynamic studies according to analysis criteria (see ‘Methods’ and also fig1). Image interpretation was impossible because of inadequate enhancement of joint tissue (four of 26) and excessive patient movement (one of 26) (see table 2). There were 10 of 21 dynamic studies that satisfied criteria for analysis of juxta-synovial lining synovial fluid and 8 of 21 that satisfied criteria for analysis of central suprapatellar pouch synovial fluid.
Enhancement data are shown in table 2. In baseline dynamic studies, the mean delay from contrast administration to maximum synovial lining enhancement ranged from 2.3–36 minutes (mean (SD) 8.6 (9.6) min) and maximum synovial lining signal ratio ranged from 0.9–5.1 (mean (SD) 2.5 (1.2)). The pattern of synovial lining enhancement is shown in figure 4A. Enhancement of juxta-synovial lining synovial fluid appeared approximately 20 minutes after intravenous Gd-DTPA injection although the variance in the data suggested that in some patients synovial fluid enhancement may occur slightly earlier (fig 4B). Subsequent enhancement of central suprapatellar pouch synovial fluid was slight (fig 4C). There seemed to be no association of change in time to maximum enhancement or in maximum enhancement of synovial lining with changes in symptom score or clinical examination findings after intra-articular glucocorticoid injection (table3).

Enhancement pattern of synovial lining (A), juxta-synovial lining synovial fluid (B), and central suprapatellar pouch synovial fluid (C) after intravenous Gd-DTPA administration (mean (SD)). Enhancement is expressed as the ratio of post/pre-contrast image signal intensity in a ROI placed over the appropriate tissue. Baseline studies only.
Changes in clinical examination findings and the size and nature of change in MR variables after intra-articular glucocorticoid injection
Synovial lining volumes were calculated from 29 of 34 completed volumetric studies in 18 patients (table 2). Analysis took approximately 45 minutes per study. Baseline synovial lining volume, calculated for all 18 patients, ranged from 52–267 ml (mean (SD) 140 (47)). Mean synovial lining volume was 131 ml ((43), n=11) for RA and 171 ml ((48), n=5) for seronegative arthritis patients. The change in synovial lining volume after intra-articular glucocorticoid injection was calculated in 11 patients and varied from −93% to +1% (table3). In five of 11 patients who had a clinically detectable decrease in synovial thickening, synovial volume was calculated to change by −41% to −93%. Where clinical examination identified no change in synovial thickening (five of 11 patients), synovial volume was calculated to change by −18% to +1%. Of the three patients where there was a discrepancy in change in examination derived indices of synovitis (nos 2, 7, and 15), a decrease in synovial lining volume was quantified by MR in two patients. The coefficient of variation in synovial volume calculation was 3.5% for a single observer and 3.8% for two observers.
There was a significant correlation (r=0.81, p<0.001 ANOVA, n=29) between the volume of synovial lining calculated from one sagittal slice, and the total synovial lining volume (fig 5). However, changes in synovial lining volume judged from single slice measurements differed from the measured changes in total volume by −47% to +46% (table 3). The change in total synovial lining volume predicted from a single slice measurement differed by between 1 and 70 ml (0.5–112%) from that actually measured. There was no association between the size of the difference of synovial lining volume calculated by these two methods and the presence or frequency of synovial structures that may not have been in communication with the joint cavity, for example, cystic popliteal lesions.

Correlation between total synovial lining volume and volume of a synovial lining in a single sagittal slice (r=0.81, p<0.001 ANOVA, n=29).
There was a significant positive correlation (r=0.5, p=0.01 ANOVA, n=21) between maximum synovial lining enhancement and synovial lining volume (fig 6); however, there was no significant relation between the time to maximum synovial lining enhancement and synovial lining volume (r= −0.4, p=0.06 ANOVA, n=21).

Correlation between synovial lining volume and maximum synovial lining enhancement expressed as post/pre-contrast signal intensity ratio (r=0.5, p=0.01 ANOVA, n=21).
From the FISP images (fig 7), effusion was confirmed in all patients where it was clinically detected and in four of six post-treatment studies where it was not clinically detected (patient nos 2, 7, 12, 16). Effusions detected by the FISP images were also apparent on the MP RAGE images in all cases.

Sagittal image from a post/pre-enhancement subtracted T1 weighted 3D MP RAGE sequence (A) showing distribution of synovial lining (high signal) throughout the joint. A contiguous image from the T2 weighted 3D FISP sequence obtained 60 minutes after intravenous Gd-DTPA injection (B) showing distribution of synovial fluid (high signal) throughout the knee joint cavity. The two images are complementary. Note: there is greater enhancement of juxta-synovial lining fluid compared with central suprapatellar pouch synovial fluid in the FISP image (Gd-DTPA has diffused through the synovial lining into juxta-synovial lining fluid but has not yet diffused throughout the intra-articular cavity).
FISP images showed areas of high signal in fluid adjacent to the synovial lining however central suprapatellar pouch fluid was of low signal (fig 7).
Discussion
We have reported a method for measuring synovial lining volume in patients with chronic knee synovitis. The method relies on the subtraction and segmentation of pre and post-enhancement images and, therefore, depends on the characteristics of articular tissue Gd-DTPA enhancement. As others have also found,20 ,21 we have identified a wide variation in the rate and degree of synovial Gd-DTPA enhancement in patients with chronic synovitis. A closer scrutiny of the pathophysiological changes in inflamed synovium, may throw light on factors that can influence the variation in enhancement and is essential in appraising the applicability and clinical utility of the various MR methods of monitoring chronic synovitis.
In acute synovitis, in practice occurring as a reaction to bacteria or crystals, there is prominent synovial lining hyperaemia, capillary permeability, tissue oedema, and polymorphonuclear leucocyte migration into the joint.1 In a recent MR study, the rate of synovial lining contrast enhancement seemed to correlate with the magnitude of some of these histopathological features.16 Although elements of these pathological features may be evident in chronic disease of synovium, generally the histological appearances differ.1 In chronic synovitis, the tissue becomes thickened as a result of increases in vascularity, cellularity, and fibrosis.1 Notably, some areas within chronically inflamed synovium, are poorly vascularised and ischaemic22 23 and solute diffusion through the synovial lining can be slower than in normal synovium, sometimes strikingly slower.12 This phenomenon may be attributable to both changes in the interstitium12 where fibrin, glycosaminoglycan, and other cellular debris in the thickened tissue may act as a barrier to diffusion of solutes, and to changes occurring in the microvasculature, which may interfere with perfusion or diffusion kinetics, or both. The vascular changes may be particularly important. In chronically inflamed rheumatoid synovium, capillary density is reduced to around one third normal,23 and capillary distance from the synovial lining surface increases approximately threefold.24 Obliteration of synovial capillaries and terminal vascular plexi25 and microvessel plugging by inflammatory cells with microthrombi26 can also occur. The multitude of factors affecting solute diffusion might, therefore, be predicted to affect Gd-DTPA enhancement in the joint. Additionally, there are a number of factors that influence solute diffusion in the joint such as intra-articular pressure,27 osmotic pressure across the capillary basement membrane,28 and exercise.11 An important finding is that the most ischaemic joints are often those suffering the greatest bone and cartilage destruction.29 This suggests that indices of synovial lining hyperaemia and solute diffusion alone, measured by contrast enhancement,15 may not be the most direct way of monitoring the changes associated with progressive joint destruction.
An alternative and, perhaps, more reliable index of chronic synovitis in the joint, may be synovial lining thickening. Methods of monitoring synovial thickness using MR techniques have been reported.13 ,14 In practice, quantifying synovial thickening may also be of potential use in planning synovectomy and monitoring the effects of anti-rheumatic treatments in research trials. In our study, a 3D MP RAGE sequence was used as the added initial inversion pulse allows for excellent signal contrast.19Sequences that include fat suppression techniques were considered but not implemented because of the additional set up and scan time entailed on our system.
Any 3D MR protocol developed for use in practice will need to be optimised to take into account the influence of inter-patient and intra-articular variation in patterns of inflammation, particularly vascularity. Given the variation that exists between Gd-DTPA enhancement patterns in different patients7 and in different parts of the same joint,16 the timing of a post-enhancement T1 weighted sequence will always remain a compromise between starting the sequence early enough so that contrast has not diffused into the fluid, and delaying it, so that the contrast has diffused adequately throughout the synovial lining. In this study, it is possible that the delay in starting the post-contrast 3D sequence (five minutes) may have resulted in the inclusion of some areas of enhancing juxta-synovial lining synovial fluid in the synovial lining ROI. Comparison of the subtracted T1 weighted images with T2 weighted images made 60 minutes after intravenous contrast injection, however, suggests that this effect was small. Furthermore, as it would have enhanced latest, fluid would have been of relatively low signal and therefore more likely to be excluded by application of a signal threshold. A threshold applied to a T1 weighted sequence timed earlier after intravenous contrast injection, would be more likely to underestimate synovial lining dimensions by excluding areas of the tissue slow to enhance.
We have shown that synovial lining dimensions may vary when different signal intensity pixel thresholds are used for counting pixels within a ROI (see fig 3). The threshold is a necessary compromise to allow for exclusion of pixels from non-synovial lining tissue inadvertently or necessarily included in the ROI (which tend to be of low signal intensity) while not excluding synovial lining pixels that may be of low signal intensity. The choice of threshold was designed to result in an optimum correction given that there may be a wide range of enhancement charateristics within the same joint and between patients. However, as the synovial lining may be irregular it is difficult to place a ROI precisely around the tissue and the use of a threshold is a useful way to improve the accuracy and speed of the analysis.
This technique for measuring synovial lining volume seems to be reproducible with low variability in repeated analysis of tissue volume for a single observer and between observers. Using the higher CV (3.8%), we have estimated that a change of 15% is necessary to denote a significant change in synovial lining volume. However, the technique is moderately labour intensive and to improve potential clinical utility, it may be essential to automate the segmentation and pixel counting analysis.
In a Danish study, it has been suggested that analysis of a single sagittal slice may be used in the assessment of disease severity in rheumatoid arthritis13 with subsequent reduction of image analysis time. The authors reported a statistically significant association between the volume of synovial lining in a selected sagittal slice and the whole synovial lining volume. We have confirmed this relation. However, our data suggest that although both single slice and whole synovial lining volume measurements can predict the direction of change in synovial volume after treatment, the size of the change detected by the two methods varies considerably. Moreover, used as an indicator of change in total synovial lining volume after treatment, the change in volume of a single sagittal slice does not seem to predict measured post-treatment volume precisely. There may be reasons why the relation between the two measurements does not seem robust in this study. Firstly, from the Danish study13 it was clear that the 95% confidence intervals of the relation between the two measurement methods increased considerably for synovial lining volumes over 60–80 ml suggesting a weakening of the relation at larger volumes. In our experience, synovial lining volumes of patients with chronic synovitis were invariably greater than this indicating that prediction of one measurement of synovial lining volume from the other in these patients cannot be made with confidence. Secondly, there may be regional changes in the synovial lining in response to local treatment, which may be unaccounted for by a single slice measurement. It is probable that to maintain the potential for MR to quantify small changes in tissue volume (potentially as small as 15%), measurement of the entire synovial lining volume should be made.
How accurate is the technique? There are no reliable estimates of pathological synovial lining mass or volume from either surgical or necropsy studies. No obvious line of demarcation between the inflamed synovial subintima and normal connective tissue has been recognised, suggesting that even theoretical attempts to estimate synovial dimensions from histopathological data would be difficult.
There are some characteristics of the (synthetic) subtracted images that should be noted when interpreting the volume data. Basically, the segmented image provides the number of voxels showing contrast enhancement greater than the signal intensity threshold. In addition to actual synovial cellular and extracellular matrix volume, the measurement may also depend on: the synovial extracellular volume; synovial vascular permeability and other determinants of rate of solute diffusion in pathological joints such as intra-articular pressure.28 Nevertheless, comparison of synovial lining volume measurements with clinical examination derived indices of synovitis provides an insight of how MR quantification techniques may be of help in providing information useful for monitoring chronic synovitis. It seems that MR can confirm the presence of, and discriminate between, joint effusion and synovial lining thickening in patients where this may be difficult to detect clinically. For example, both effusion and synovial lining thickening may be detected together where neither is apparent clinically (follow up studies in patients nos 8, 12, 16 and 18, see table 3). This emphasises the important attribute of articular MR in discriminating soft tissue from fluid in joints, which has been alluded to in earlier reports.6 ,8 Although the heavily weighted T2 sequence seems to provide the best imaging of synovial fluid and soft tissue/fluid discrimination, it is not necessary for detection of a joint effusion in these patients. Most importantly, the magnitude of change in synovial lining volume can be determined in response to treatment in patients where clinical information seems to be inconsistent. Discordance between clinical and MR findings in rheumatoid joints has previously been reported.30 This study adds to the weight of information that suggests MR images may provide details about the chronic arthritic joint that are unsuspected or undetected clinically. In this respect MR may become increasingly important in the treatment of chronic rheumatoid synovitis.
In summary, we have reported a reproducible MR technique for estimating synovial lining volume in patients with chronic synovitis. In addition, the technique provides high resolution images of the synovial lining and its distribution. The technique may be used to monitor changes in synovial lining volume after local treatment for chronic synovitis and may provide information that cannot be derived from clinical assessment.