Article Text

Abstract
Objective CTX-II (C-terminal telopeptide of type II collagen) has been put forward as a marker of collagen type II degradation being part of osteoarthritis. In this study, the authors describe similarities between CTX-II and bone markers arguing against CTX-II as a marker of (solely) cartilage degradation.
Methods uCTX-II, the bone markers uCTX-I, uNTX-I, sPINP, and sOC (C-terminal and N-terminal telopeptides of collagen I, aminoterminal propeptide of type I procollagen, and osteocalcin, respectively), and other (candidate) cartilage markers sCOMP, sCS846, and sPIIANP (cartilage oligomeric matrix protein, chondroitin sulphate 846 and type IIA collagen N-propeptide, respectively) were assessed by ELISA in CHECK (Cohort Hip and Cohort Knee), a cohort of 1002 individuals with early pain and/or stiffness in knee and/or hip.
Results uCTX-II was more strongly associated with the bone markers than with the other cartilage markers, while the other cartilage markers were not so strongly associated with the bone markers. Moreover, both uCTX-II and bone markers but not the other cartilage markers showed an abrupt menopausal shift in women aged 48-53 years, also when adjusted for age and BMI.
Conclusion The similarities between uCTX-II and bone markers could be attributable to a link between cartilage and bone metabolism through metabolic and biomechanical mechanisms. However, other cartilage markers were hardly associated with uCTX-II and did not show such evident associations with bone markers. uCTX-II has unique relations with bone markers as compared to other cartilage markers and might reflect bone rather than cartilage metabolism. More thorough molecular validation of uCTX-II is required.
Statistics from Altmetric.com
Introduction
Although biochemical markers (hereafter simply referred to as biomarkers) of osteoarthritis (OA) are being investigated for a considerable period of time, they have not yet been proven to be of definite clinical value. Still, biomarkers are believed to be able to aid in future diagnosis and prognosis of OA. The biomarker research field is rapidly expanding and new biomarkers are introduced quite regularly. This process is driven by the invaluable contribution that an ideal OA biomarker would have in OA research and clinical practice. It is still considered that biomarkers will aid in diagnosing OA in an earlier stage when structural damage is limited and could still be modulated, in identifying targets for disease modifying therapies, in shortening clinical trials, in defining phenotypes and in many more areas. A drawback of this positive drive is the limited validation and qualification of biomarkers before their introduction in research practice. For example, HELIX-II (type II helical collagen epitope) was initially introduced as a new biomarker of collagen type II degradation in humans,1 but later appeared to be erroneously raised against a peptide sequence not present in human cartilage as confirmed by mass spectrometry.2 Another example is COMP (cartilage oligomeric matrix protein), a biomarker that was presented as a biomarker specific for cartilage,3 but which is present in other tissues as well.4 ,5
CTX-II (C-terminal telopeptide of type II collagen) was first commercially adopted as a marker of collagen type II degradation in 2001.6 Enzyme-linked imunosorbent assays (ELISAs) are based on antibodies that recognise a linear six amino acid epitope from the middle region of this telopeptide but not (telopeptides of) other collagen types including type I. CTX-II was demonstrated to be produced in vitro, in cultures of human articular cartilage explants containing metabolically active chondrocytes. Unexpectedly, when rabbit osteoclast-like cells were cultured with bovine bone slices, CTX-II levels in culture medium were also slightly higher than under unconditioned circumstances.6 However, in these experiments, CTX-II levels showed no correlation with the histologically quantified resorption pit area as was demonstrated for CTX-I levels, nor did CTX-II correlate with CTX-I levels under these in vitro conditions.
In the present study, in 1002 individuals with early symptoms of OA, uCTX-II was evaluated in relation to several other biomarkers of supposed cartilage and bone origin. The observed similarities and discrepancies are described and potential implications of these observations are speculated on.
Methods
Cohort characteristics
All biomarkers were assessed in baseline samples of CHECK (Cohort Hip and Cohort Knee), a long-term follow-up cohort of 1002 participants, aged between 45 and 65 years at the time of inclusion, with pain and/or stiffness of one and/or both knee(s) and/or hip(s), that had never or not longer than 6 months ago visited a general physician for these complaints for the first time.7 At baseline, CHECK participants (79.0% women) were aged 56±5 years (mean±SD) and had a body mass index (BMI) of 25.5 kg/m2 (median, 25–75% percentiles 23.3–28.4). Age and BMI were available for all (100%) and 979 (97.7%) participants, respectively. Women were designated postmenopausal when menstruation had stopped >12 months before their baseline visit. When menopausal status could not be defined because of previous hysterectomy or bilateral ovariectomy, oral anticonceptive use, or missing data, women aged >55 years were designated postmenopausal and menopausal status of women aged <55 years was designated undetermined. Women using any sex hormonal therapy were also not included in analyses including menopausal status. As such, 142 (17.9% of all women) women were designated premenopausal, 475 (60.0%) postmenopausal and 175 (22.1%) undetermined. At baseline, 68% and 79% of participants showed a maximum Kellgren and Lawrence (K&L) grade 0 and 25% and 15% grade 1 for knees and hips, respectively. Median (25–75% percentiles) WOMACsubscales (higher scores representing more complaints) were 5 (2–7) for pain (range 0–20), 3 (2–4) for stiffness (range 0–8) and 14 (7–24) for physical function (range 0–68).
Biomarker assessment
Non-fasted, second morning void urine and serum samples were collected between 8:00 and 12:00 h. uCTX-II, the cartilage degradation marker sCOMP, cartilage synthesis markers sPIIANP (type IIA collagen N-propeptide) and sCS846 (chondroitin sulphate 846), bone degradation markers uNTX-I (N-terminal telopeptide of collagen I) and uCTX-I (C-terminal telopeptide of collagen I) and bone synthesis markers sPINP (aminoterminal propeptide of type I procollagen) and sOC (osteocalcin) were all assessed by ELISA, except for sPINP that was assessed by radioimmunoassay (RIA). Assessments were performed in singlicate and according to manufacturer RIA. Assessment characteristics (coefficients of variation, CV%, as calculated from our own assessments) were as follows: uCTX-II (ng/mmol creatinine): Urine Cartilaps EIA, Immunodiagnostic systems Ltd, Boldon, UK. Intraplate CV 10.0% (as calculated from triple assessment of a single standard sample in all assay plates; mean for all plates), interplate CV 9.3% (mean for all days), between-day CV 12.4%. sCOMP (U/l): Anamar Med AB, Göteborg, Sweden. Intraplate, interplate and between-day CV: 5.0%, 4.0% and 4.2%, respectively. sPIIANP (ng/ml): Millipore Corp, Billerica, Massachusetts, US. Intraplate, interplate and between-day CV: 15.8%, 7.0% and 15.7%, respectively. sCS846 (ng/ml): IBEX, Montreal, Canada. Intraplate, interplate and between-day CV: 21.5%, 16.9% and 15.3%, respectively. uCTX-I (μg/mmol creatinine): Urine Crosslaps EIA, Immunodiagnostic systems Ltd., Boldon, UK. Intraplate, interplate and between-day CV: 9.7%, 6.1% and 2.7%, respectively. uNTX-I (ng/mmol creatinine): OSTEOMARK NTx Urine, Wampole laboratories, Princeton, New Jersey, US. Intraplate, interplate and between-day CV: 14.9%, 6.6% and 10.7%, respectively. sPINP (ng/ml): UniQ, Orion Diagnostica, Espoo, Finland. Intraplate, interplate and between-day CV: 4.4%, 4.5% and 6.2%, respectively. sOC (ng/ml): N-MID Osteocalcin ELISA, Immunodiagnostic systems Ltd., Boldon, UK. Intraplate, interplate and between-day CV: 3.4%, 4.1% and 4.3%, respectively. Urine and serum samples were available for 964 (96.2%) and 960 (95.8%) participants, respectively. For a small minority (maximum 10 samples per biomarker) biomarker levels were below or above the standard curve range. For these samples, biomarker levels were arbitrarily set at 80% of the minimum and 120% of the maximum assessed biomarker level in the cohort, respectively. All analyses were performed with and without this arbitrary biomarker levels. Results were similar unless stated otherwise.
Statistical analysis
Associations between biomarkers and demographic variables in all participants were assessed by multiple linear regression analysis, adjusting for age, gender and BMI whenever applicable. The associations between biomarker levels and age were compared between genders, by including gender*age interaction terms. Statistically significant interaction terms indicate a different association of biomarker levels with age between genders. Associations between menopausal status and biomarker levels in women were investigated in a next series of multiple linear regression analyses, adjusting for age and BMI. Biomarker levels and BMI were logarithmically transformed to obtain normally distributed residuals.
To facilitate direct comparison between variables, regression coefficients are expressed as standardised βs. Standardised βs represent the number of SD that the outcome will change as a result of one SD change in the predictor and are therefore independent of the units of measurement of the variables and can vary between −1 and 1. Unadjusted and adjusted associations are shown. Unadjusted standardised βs are identical to Pearson's correlation coefficients.
Results
Mutual associations between biomarkers
Biomarkers of bone degradation and synthesis were moderately to strongly mutually associated, with standardised βs ranging between 0.462 and 0.780 (p<0.001 for all), as is demonstrated in table 1. Notably, also uCTX-II showed weakly to moderately positive associations with all bone markers (standardised βs between 0.267 and 0.441, table 1, horizontal shaded box and figure 1), while associations with the other cartilage markers were only very weak at most (standardised βs ranging between −0.111 and 0.154, table 1, vertical shaded box). Bone degradation markers were more strongly associated with uCTX-II (standardised βs 0.434 and 0.441 for uNTX-I and uCTX-I, respectively, p<0.001 for both) as compared with bone synthesis markers (standardised βs 0.290 and 0.267 for sPINP and sOC, respectively, p<0.001 for both). In comparison, associations between the other cartilage markers and bone markers were less evident (mostly non-significant associations, maximum standardised β 0.214 between sCOMP and sOC, p<0.001).
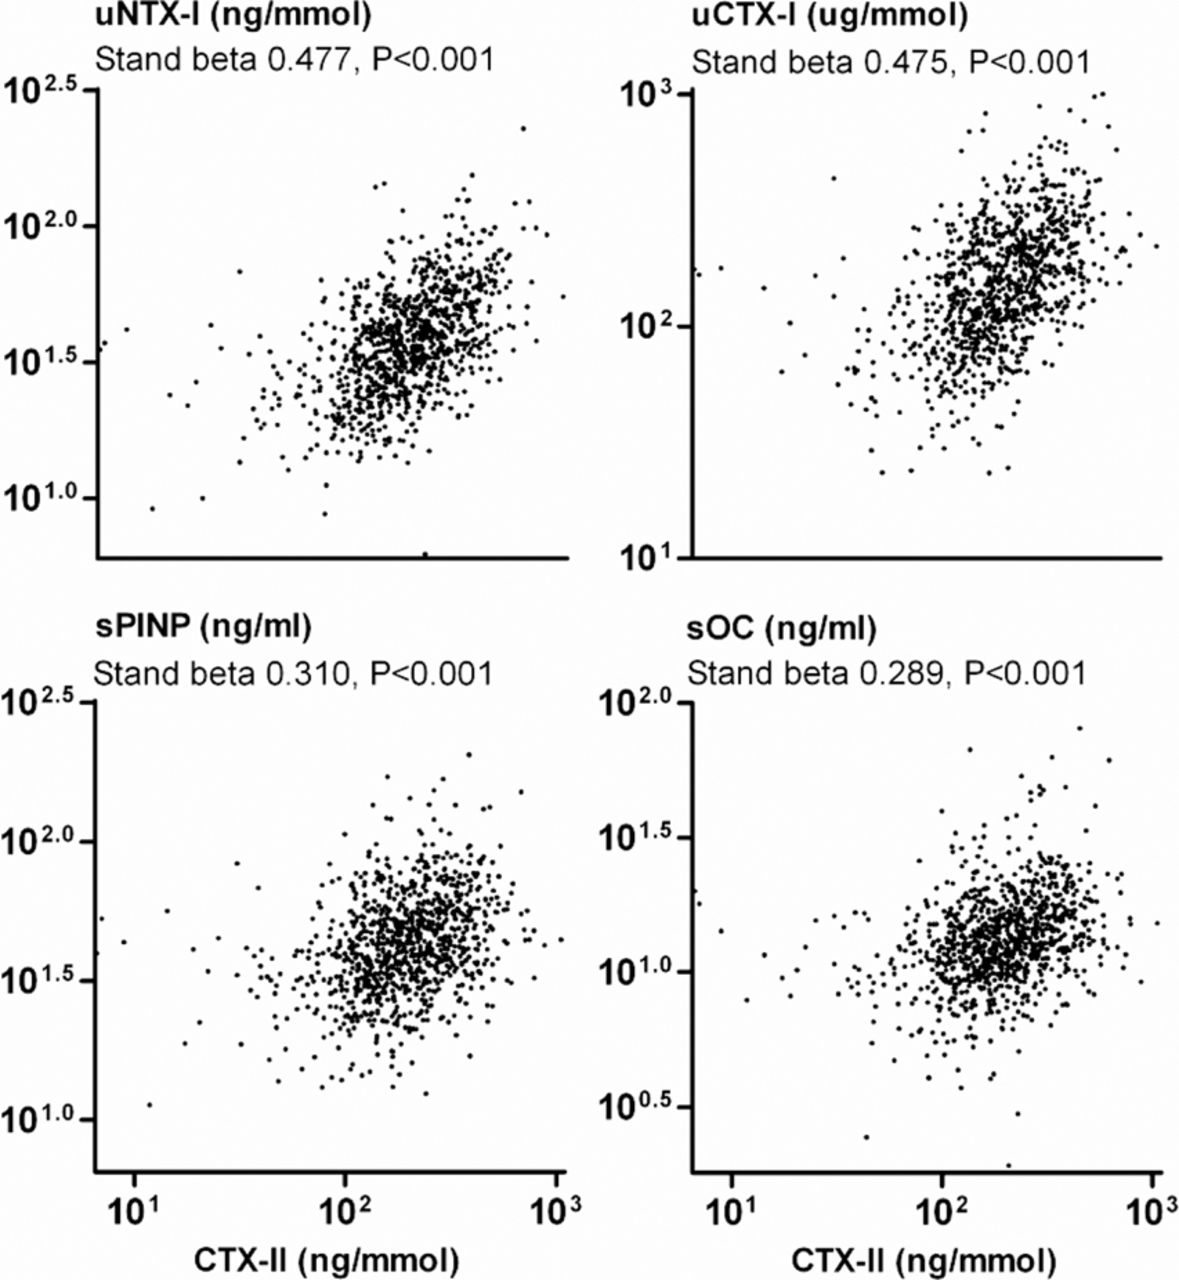
Scatterplots showing the associations between urinary CTX-II and bone marker levels. Statistical values are as obtained from univariate linear regression analyses. Univariate standardised βs are identical to Pearson's correlation coefficients.
Associations between CTX-II, biomarkers of cartilage metabolism and biomarkers of bone metabolism as assessed by multiple linear regression analysis, adjusted for age, body mass index and gender. Standardised βs and p values are reported. Unadjusted values (identical to Pearson's correlation coefficients) are in brackets
Associations between biomarkers and demographics
To analyse relations between biomarkers and demographic variables, multiple regression analyses were performed with one of the biomarkers as dependent variable in each model, and gender, age and BMI as independent variables in all models. They showed that biomarkers were largely interrelated with demographic variables, as becomes clear from table 2. Although most biomarker levels were higher in women than in men, sCOMP levels were lower in women (standardised β −0.157, p<0.001). Bone synthesis and degradation markers were all negatively associated with BMI (standardised βs between −0.176 and −0.100, p≤0.002), while uCTX-II and other cartilage markers were all positively associated with BMI (standardised βs between 0.061 and 0.173, p≤0.002, except for sCS846, p=0.063).
Associations between uCTX-II, biomarkers of bone and cartilage metabolism (dependent variables), and demographic variables (independent variables) as assessed by multiple linear regression analysis. Standardised βs and significance values are reported per demographic variable and for the interaction term gender*age. Unadjusted values (identical to Pearson's correlation coefficients) are between brackets
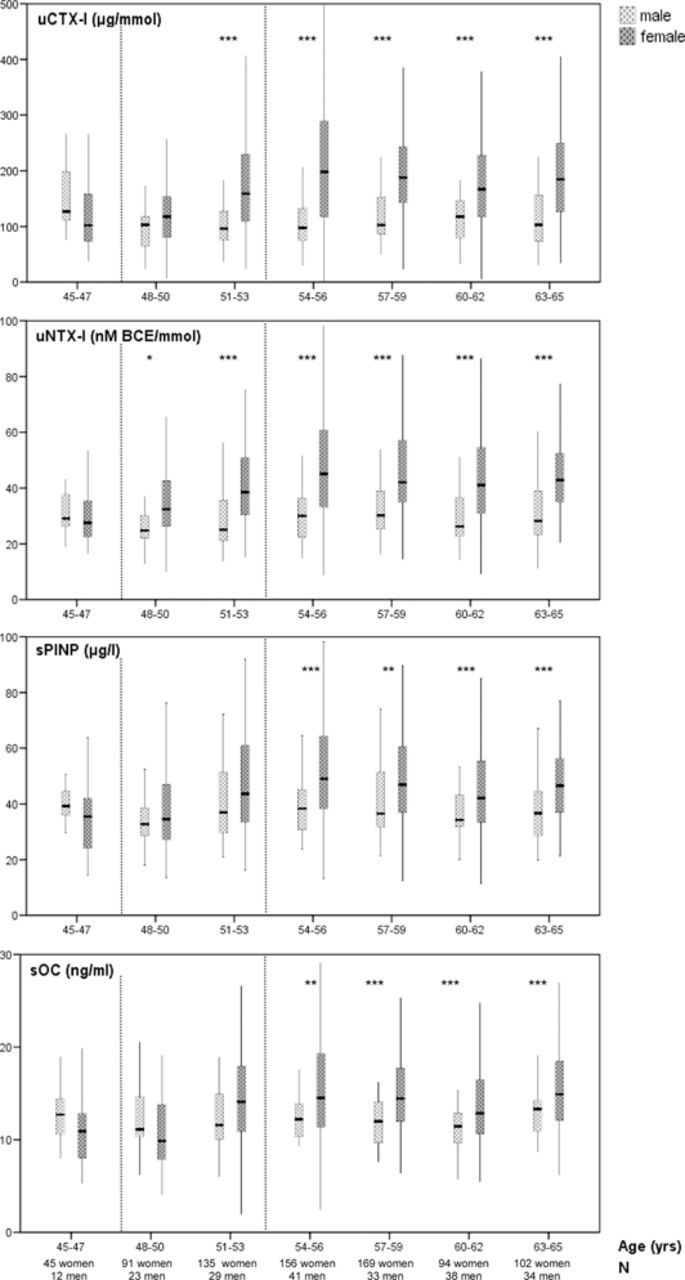
Corresponding plots (figure 2) showed a quite abrupt increase of bone marker levels between the age of 48 and 53 years, among women but not men. This apparent gender difference was confirmed by statistically significant interaction (effect modification) between gender and age (p≤0.025 for all interaction terms gender*age, table 2). Menopause was implied as the cause of these increasing bone marker levels in women. Indeed, in multiple linear regression analysis, adjusting for age and BMI, menopause appeared to be associated with higher bone marker levels (standardised β between 0.207 and 0.256, p<0.001 for all bone markers, table 2).

Biomarker levels per 3-year age category for each of the bone markers, for men and women separately. Boxplots show medians, quartiles and minimum and maximum (non-outlier) values. For the sake of clarity outliers (>1.5* interquartile range from the rest of the scores) are not depicted, but were included in all statistical analyses. Men showed relatively stable biomarker levels, while women showed increasing biomarker levels during the age interval of 48–53 years (indicated by vertical dotted lines). *p<0.05, **p<0.02, ***p<0.005 for comparison between men and women in the age category concerned. p Values as obtained from unpaired t-tests, using logarithmically transformed biomarker levels.
Interestingly, uCTX-II levels showed a comparable abrupt increase among women but not men, as is shown in figure 3 (p=0.029 for interaction term gender*age, table 2). Again, menopause was implied as the cause of this increase. Indeed, uCTX-II levels appeared to be higher among postmenopausal as compared with premenopausal women figure 4. Also when this menopausal increase was adjusted for BMI and age in multiple linear regression analysis, higher uCTX-II levels appeared to be associated with postmenopausal status in addition to age (standardised βs 0.137 and 0.188 for menopausal status and age, respectively, table 2). This increase was not observed for the other cartilage biomarkers, except for sCOMP (standardised β 0.122, p=0.022 for menopause, non-significant standardised βs for sPIIANP and sCS846, table 2 and figure 4). Although sCOMP levels also showed a statistically significant postmenopausal increase, they did not show a statistically significantly different association with age between men and women (ie, interaction). Moreover, the general pattern of sCOMP levels was quite different from that of the bone markers and uCTX-II (figure 3). uCTX-II and bone marker levels were comparable between men and premenopausal women, but higher in postmenopausal women. sCOMP actually showed lower levels in premenopausal women as compared with men and comparable levels between men and women only after menopause.

Biomarker levels per 3-year age category for uCTX-II (C-terminal telopeptide of type II collagen) and sCOMP (cartilage oligomeric matrix protein), for men and women separately. For uCTX-II, men and women showed comparable uCTX-II levels until the age interval of 48–53 years (indicated by vertical dotted lines) when uCTX-II levels increased in women. For sCOMP, the increase was less apparent and sCOMP levels were generally lower in women than in men throughout the examined age range. *p<0.05, **p<0.02, ***p<0.005 for comparison between men and women in the age category concerned. p Values as obtained from unpaired t-tests, using logarithmically transformed biomarker levels.

uCTX-II (C-terminal telopeptide of type II collagen) and sCOMP (cartilage oligomeric matrix protein) levels in premenopausal and postmenopausal women, not adjusted for age and body mass index. p Values as obtained from unpaired t-tests, using logarithmically transformed biomarker levels.
To determine whether these associations between the biomarkers were OA-specific, participants with and without OA in any of their hips or knees, defined as K&L grade ≥1, were analysed separately. Five hundred and forty two (54.8% of those with complete radiographic data) of the participants in CHECK had no (not yet) radiographic OA in any of their knees and hips, 217 (21.9%) had one affected joint and 185 (18.7%) had two affected joints, most joints showing K&L grade 1 changes, underscoring the very early OA character of this cohort. Results did not change essentially for all bone and cartilage biomarkers when presence or absence of radiographic OA signs was taken into account (data not shown). Also when participants under and over the median age of 56 years were analysed separately, hereby accounting for age-dependent processes that were not (yet) evident radiographically, results were similar for and between uCTX-II and the bone biomarkers (data not shown).
Discussion
The present study on a spectrum of cartilage and bone markers shows striking similarities between uCTX-II and biomarkers of bone metabolism. Associations of uCTX-II with bone markers were clearly stronger than those with the other candidate cartilage biomarkers measured. Moreover, uCTX-II levels showed a postmenopausal increase in women similar to that observed for the bone markers, but contrasting with the cartilage markers. This suggests that the origin of the uCTX-II epitope is distinct from that of the other cartilage markers and may merely reflect bone turnover rather than cartilage metabolism. Indeed a primary origin from calcified cartilage by osteoclastic resorption in growing animals and children has been proposed by others.8
The observed positive associations between markers of bone synthesis and degradation are in accordance with literature, although most literature on biomarkers of bone metabolism does not specifically address this aspect. In 2125 healthy women aged 20–79 years many positive associations between sOC, sPINP and uCTX-I were observed.9 Urinary levels of pyridinium crosslinks, indicative of bone resorption, and sOC were demonstrated to be among the best predictors of each other in postmenopausal women, although only to a low extent.10 In young athletes, sPINP and ICTP (C-terminal telopeptide of collagen type I, reflecting bone resorption) levels were strongly associated, to a comparable extent as in our results.11 In principal component analysis in a group of OA patients and healthy subjects, serum bone sialoprotein, involved in bone mineralisation, and urinary pyridinium crosslinks all loaded positively onto one single factor.12
The negative associations between biomarkers of bone metabolism and BMI are also in accordance with the literature,9 ,13,–,16 although not all.17,–,19 BMI may influence bone metabolism through biomechanical and metabolic mechanisms. Leptin is probably the most well-characterised metabolic mediator between nutritional status and bone metabolism.20 ,21 On the other hand, body composition may also be important to take into consideration when interpreting associations between BMI and bone metabolism; Donescu et al demonstrated that sPINP and uNTX-I levels are more strongly associated with fat-free BMI than with any other weight parameter and failed to show any association between body fat mass and bone mineral density in men.22
Finally, also the increased bone marker levels after menopause in women as compared with men (in comparable age categories) are in agreement with literature.9 ,13 ,23,–,26
In the present study uCTX-II levels were shown to be associated with bone markers, especially those of bone degradation as compared with bone synthesis. Other authors have also noticed positive associations between uCTX-II levels and NTX-I and CTX-I levels in postmenopausal osteoporosis patients with and without OA and in small OA cohorts.13 ,27 ,28 Several authors have reported that uCTX-II levels in (knee) OA patients showed stronger associations with osteophytes (cartilage-bone process) than with joint space narrowing (primarily cartilage process).29,–,32 Furthermore, osteogenesis imperfecta, an inherited collagen I disorder, is associated with increased uCTX-II levels. In these patients increasing levels of bone degradation as expressed in urinary HELIX-I and α/βCTX-I levels were associated with increasing uCTX-II levels.33 Moreover, various antiresorptive therapies primarily aimed at bone metabolism have been repeatedly demonstrated to decrease uCTX-II levels also.8 ,28 ,34 Finally, in the first month after joint distraction as a treatment for end-stage knee OA uCTX-II levels increase to such an extent (personal communication, FPJG Lafeber, December 2011) that this early-stage change can hardly be (only) due to the long-term knee cartilage structure modification as observed by MRI, but rather due to significant postsurgical alterations of bone turnover. The authors concerned state that the load on the bone (the biomechanical trigger for normal bone formation) is transferred through the frame instead of the subchondral bone, leading to bone resorption, which subsequently normalises after distraction.29 Altogether, these data have frequently been interpreted as illustrative of a close relation between cartilage and bone metabolism. However, most previous studies focused on a limited number of cartilage and bone markers, while our data on a spectrum of biomarkers show that the suggested coupling between cartilage and bone markers is rather a specific feature of uCTX-II and does not hold true for the other candidate cartilage markers. Interesting in this respect may be the rather diffuse distribution of the cartilage markers/epitopes within articular cartilage35 ,36 as compared with the apparent localisation of CTX-II epitope release at the cartilage-bone interface.35 Alternatively, the apparently unique features of CTX-II could be a consequence of inferior performance (eg, due to limited molecular validity) of the other (candidate) cartilage markers in reflecting actual cartilage metabolism that coincides with bone changes in this cohort of early OA.37
That uCTX-II does not exclusively reflect bone turnover is supported by its weaker association with markers of bone metabolism than the associations between the bone markers themselves and its positive association with BMI as opposed to the negative association of the bone markers with BMI. Furthermore, also sCOMP to some extent showed associations with the bone markers and a postmenopausal increase, perhaps indicative of an actual link between bone and cartilage metabolism. Tanishi et al noticed positive correlations between uCTX-II and uNTX-I in older subjects (60–79 years) but not in younger subjects (40–59 years), which suggests that these correlations rather reflect an actual relationship between bone and cartilage metabolism in an age-related process or disease like OA than the merely technical issue of limited molecular validity. Although our subjects were somewhat younger, with yet minimal radiographic OA signs, we could not demonstrate such differences between younger and older subjects and presence and absence of (minor) radiographic joint damage. Also, although some studies have shown uCTX-II decreases after antiresorptive therapy, other comparable studies have shown an effect of tibolone on bone metabolism without affecting uCTX-II levels.38 Interrelationships between bone and cartilage metabolism in OA may be biomechanical and/or metabolic as is suggested by ample preclinical and clinical studies39,–,43 including studies that show osteoclast-mediated (calcified) cartilage resorption in rat OA models.44
In rheumatoid arthritis (RA), uCTX-II has been shown to be positively associated with joint space narrowing,45 but also with 12-month hand bone mineral density decrease,46 bone erosion progression45 and synovitis.45 ,46 Still, other studies suggested that uCTX-II (also) represents other processes in RA than bone markers do.47 ,48
Obvious strengths of the current study are its size, the multiple biomarkers that were assessed simultaneously, and the small numbers of missing biomarker data. Limitations of the study are its cross-sectional character, the low precision of sCS846 assessment, and the 22.1% of women for whom menopausal status remained undetermined due to non-response, use of hormonal therapies, etc. Although not all women could be included in the multiple linear regression analyses with menopausal status as one of the independent variables, they were included in all other analyses and figures. The low precision of the sCS846 assessment was possibly due to technical issues49 and might have obscured associations with uCTX-II and bone markers. However, sPIIANP and sCOMP showed comparable associations with uCTX-II and bone markers. Our data do not address whether it is either the CTX-II epitope or the immunoassay concerned that possibly lacks specificity. Eyre et al detected cross-reactivity between their 2B4 antibody to the CTX-II epitope and bone peptides. Although this may not hold true for the commercialised antibody MAb F2603 that was used in most other studies, including ours,6 the 2B4 antibody seems to behave very similarly (non-published data, personal communication, D Eyre, January 2012). In summary, we think that these limitations did not subvert our conclusions.
On the basis of our current data, we suggest that apparent uCTX-II changes should by themselves be interpreted cautiously and better evaluated run against other cartilage markers as was performed in our study. Large-scale assessment of a spectrum of biomarkers, including cartilage and bone biomarkers, is planned in association with the Osteoarthritis Initiative. Its results are eagerly awaited to see whether our observations in CHECK will be confirmed. Also, longitudinal biomarker assessments in addition to our cross-sectional assessment and studies on associations between CTX-II and bone mineral density measures (eg, DXA) would be interesting and would aid further elucidation of the possible link between CTX-II and bone metabolism. Meanwhile, a more thorough molecular validation of the origin(s) of the uCTX-II assay signal in urine is required to understand the significance of the large body of literature on clinical studies already performed.
Acknowledgments
CHECK is funded by the Dutch Arthritis Association on the lead of a steering committee comprising 16 members with expertise in different fields of OA chaired by Professor J W J Bijlsma and coordinated by J Wesseling. Involved are: Erasmus Medical Center Rotterdam; Kennemer Gasthuis Haarlem; Leiden University Medical Center; Maastricht University Medical Center; Martini Hospital Groningen/Allied Health Care Center for Rheumatology and Rehabilitation Groningen; Medical Spectrum Twente Enschede/Ziekenhuisgroep Twente Almelo; Reade, formerly Jan van Breemen Institute/VU Medical Center Amsterdam; St Maartenskliniek Nijmegen; University Medical Center Utrecht and Wilhelmina Hospital Assen. The authors would like to acknowledge David Eyre for his valuable comments and contributions to this manuscript.
References
Footnotes
-
Funding This study was supported by the Dutch Arthritis Association.
-
Competing interests None.
-
Patient consent Obtained.
-
Ethics approval CHECK received approval from the medical ethics committees of all involved medical centres.
-
Provenance and peer review Not commissioned; externally peer reviewed.
-
Data sharing statement Additional unpublished data can be obtained from the corresponding author on request.