Article Text

Abstract
Objectives To describe the evolution of radiographic abnormalities of the spine in patients with ankylosing spondylitis (AS).
Methods Patients with AS were followed prospectively with 2 yearly radiographs for 12 years. The modified Stoke Ankylosing Spondylitis Spine Score (mSASSS) was scored by two readers (R1 and R2). New syndesmophytes at uninvolved vertebral corners were computed. Radiographic progression was investigated using generalised estimating equations.
Results 809 radiographs (presenting 520 at 2 yearly intervals) from 186 patients (70% men, mean age 43 (SD 12) years, mean 20 (SD 12) years since symptom onset and 83% HLA-B27 positive) were included. Mean mSASSS at baseline was 11.6 (16.2). While the course of progression in individual patients was highly variable, and still occurred in patients with decades of symptom duration, mean 2 year progression was 2.0 (3.5) mSASSS units. Over the entire follow-up, at least one new syndesmophyte was found in 55% (R1) and 63% (R2) of patients (38% (R1) and 39% (R2) of all intervals). In 24% of patients (39% of intervals), there was no progression. A progression ≥5 mSASSS units occurred in 22% of patients (or in 12% of intervals). At the group level, a linear time course model fitted the data best, with a constant rate over the entire 12 year interval of 0.98 mSASSS units/year. Radiographic progression occurred significantly faster in men, in HLA-B27 positive patients and in patients with a baseline mSASSS≥10.
Conclusions Long term radiographic progression in AS is highly variable in the individual patient, more severe in HLA-B27 positive men and still occurs after decades of disease. At the group level, however, progression in AS follows an approximately linear course.
- spondyloarthritis
- ankylosing spondylitis
- radiographic damage
- outcome measures
- mSASSS
- syndesmophytes
Statistics from Altmetric.com
Introduction
Axial spondyloarthritis (axSpA), which includes both non-radiographic axSpA and ankylosing spondylitis (AS), is a chronic inflammatory rheumatic disease that primarily affects the axial skeletal. Likely as a consequence of inflammation, structural damage, mainly characterised by the development of syndesmophytes, may arise over time, which may lead to ankylosis of the spine. It is generally assumed that the disease process is most active in the early phases of the disease and that it becomes quiescent over time.
Radiographic damage is one of the core outcomes recommended by the Assessment of SpondyloArthritis international Society (ASAS) for follow-up of patients with axSpA.1 ASAS recommends routine radiography of the lateral cervical and lumbar spine for assessing damage over time in which a 2 year interval is the shortest period defined for reliable assessment of progression.2 ,3
Syndesmophyte formation in axSpA is not easily retarded by treatment: biological agents have failed to show retardation in structural damage progression4–6 and only non-steroidal anti-inflammatory drugs (NSAIDs) have an inhibitory effect, especially in patients with elevated C reactive protein (CRP).7–9 This emphasises the importance of gaining further insight into radiographic progression, in particular about how it naturally evolves during the course of the disease. Radiographic progression has been assessed in a few short-term studies (2 years10 ,11 or 4 years12 ,13). One study with a duration of 8 years had a retrospective design and only included hospitalised patients.14
The aim of the present prospective study was to further investigate the evolution of radiographic abnormalities in patients with AS during 12 years of follow-up. The course of radiographic progression over time was investigated by longitudinal modelling of time, taking into account factors that may significantly modify the course of progression.
Methods
Study population
The study included patients from the Outcome in Ankylosis Spondylitis International Study (OASIS), a prevalence cohort including 217 consecutive patients with AS from The Netherlands, Belgium and France that began in 1996.15 Clinical data were collected every 6 months until year 2, then yearly until year 4 and thereafter biannually. Cervical and lumbar spine radiographs were taken biannually over 12 years, with a total of seven possible time points per patient. For the present study, patients were included if they had at least two subsequent time points with an available radiographic damage score so that radiographic progression could be evaluated. All patients gave informed consent to be included in the study.
Scoring methods
Radiographs were scored using the modified Stoke Ankylosing Spondylitis Spine Score (mSASSS).16 According to this method, the anterior vertebral corners (VCs) of the cervical (lower border of C2 to upper border of T1) and lumbar (lower border of T12 to upper border of S1) segments (total of 24 VCs) are scored in the lateral view only for the presence of erosion and/or sclerosis and/or squaring (1 point), syndesmophyte (2 points) and bridging syndesmophyte (3 points). Total score per patient ranges from 0 to 72.16
Two trained experts (SR and CS) independently scored the radiographs, blinded to the demographic and clinical data but with known chronology as this is the most sensitive method17 All of the available films per patient were scored at the same time but by both readers separately.
Only scores of radiographs with ≤3 missing VCs per segment (either cervical or lumbar) were used. Individual missing VCs were imputed (see online supplementary text section 1). Reliability between the two readers (R1 and R2) was explored using Bland and Altman analysis18 on the progression intervals of mSASSS. An independent adjudicator (AvT) scored all of the radiographs from patients with at least one score beyond the 95% level of agreement. Averaged scores per VC of the two primary readers were used and, in case of adjudication, the score of the primary reader closest to the adjudicator.
Radiographic abnormalities
Status scores (the score at each of the available time points) and progression scores (the difference between the status scores of two time points) were calculated. Two year progression scores refer to the progression occurring within 2 years— that is, status score of one time point minus the status score of the immediately previous time point. Twelve year progression score was computed as the score at year 12 minus the score at baseline. Progression scores were calculated for all patients included in the study and also for those who had an mSASSS at 12 years (’12 year completers’) in order to trace eventual bias due to loss of follow-up. The contribution (in per cent) of each of the segments (cervical and lumbar) to the 2 year total mSASSS progression was compared with the expected contribution, assuming a balanced distribution (ie, 50% in each of the segments). In order to better understand the magnitude of the progression of damage, the available 2 year progression scores were classified in categories of progression: 0; >0 and <1; ≥1; ≥2; ≥1 and <3; ≥3; ≥3 and <5; and ≥5 mSASSS units.
At a reader level, the proportion of 2 year intervals with a given number of new syndesmophytes was calculated, both for all patients and for the ’12 year completers’, and for uninvolved VCs (without a previous syndesmophyte or bridge). The proportion of patients in whom at least one new syndesmophyte was identified during follow-up was also estimated.
For further details on data collection, see online supplementary text section 2.
Statistical analysis
Interobserver reliability was assessed by Bland and Altman plots18 and by smallest detectable change (SDC) for 2 year progression scores. SDC, based on 95% limits of agreement, is the smallest change that can be detected in an individual beyond measurement error and was calculated as follows19:  ) where SDdiff is the SD of the set of differences in change scores obtained by the readers; k is the number of readers (here two).
Radiographic progression over time was investigated using generalised estimating equations (GEE). This is a technique for longitudinal analysis which makes use of all available longitudinal data, allows unequal numbers of repeated measurements and has some robustness against deviation from normality.20 ,21 GEE corrects for the within subject correlation and for this it requires an a priori defined ‘working’ correlation structure. In this study, the ‘exchangeable’ correlation structure was appropriate because the correlations of the outcome at different time points were approximately equal (Spearman correlation coefficients between 0.80 and 0.97). Time was modelled in linear and non-linear (quadratic, cubic, logarithmic, exponential or square root) modes and the best fit was determined using the lowest quasi-likelihood information criterion. Relevant two-, three- and four-way interactions between clinical and demographic characteristics of the patients with time were explored, and if a relevant interaction (p<0.1) was found, progression over time was assessed in the subgroups after stratification. Interactions were tested with HLA-B27 status, gender, symptom duration, baseline mSASSS, NSAID intake (dichotomous variable and ASAS NSAID index22) and exposure to tumour necrosis α inhibitors (TNFi) during follow-up. An interaction between time and a dichotomous variable reflecting the first and second 6 years of follow-up was also tested in order to assess whether the progression rate changed over time. Because the dependent variable was mSASSS and the independent variable time, the regression coefficient obtained reflects the progression of mSASSS per year. Stata SE V.12 was used (Statacorp, College Station, Texas, USA).
Results
In total, 186 patients in whom paired x-rays were available were included in the study, with the following baseline characteristics: 70% men; 83% HLA-B27 positive; mean age 43 (SD 12) years; mean time since symptom onset 20 (SD 12) years; mean disease duration 11 (SD 9) years; Bath AS Disease Activity Index 3.4 (2.0); and CRP 17 (23) mg/L (47% had an elevated CRP). At baseline, 68% of patients were exposed to NSAIDs and none to TNFi. Throughout follow-up, 95% of patients were at some time exposed to NSAIDs and 22% to TNFi (but before year 8 of follow up, this proportion was 5%).
Duration of follow-up was, on average, 7.9 (4.0) years per patient (range 2–12 years). A total of 809 radiographs (386 radiographs for the 68 ’12 year completers’) were obtained in which mSASSS could be determined (4.2 (1.7) radiographs per patient (range 2–7)).
Interobserver reliability was ‘good’ (see online supplementary figure S1). SDC measured across all progression intervals was 2.9.
Progression in mSASSS
Mean (SD) mSASSS at baseline was 11.6 (16.2) (11.2 (15.7) in the ‘12 year completers’). At baseline, 47% (R1) and 58% (R2) of patients had at least one syndesmophyte present: 9% (R1) and 48% (R2) had a score of 1 in at least one VC.
Mean mSASSS progressed gradually, from 11.6 (16.1) at baseline (n=184) to a mean value of 24.5 (21.7) at 12 years (n=68). The mean 2 year progression rate (in 520 intervals) was 2.0 (3.5) (2.2 (3.9) for the ’12 year completers’). The mean 2 year progression in the cervical segment was 1.2 (2.2) and mean progression in the lumbar segment was 0.8 (2.0). Progression was significantly higher in the cervical segment (accounting for 66% of progression) than in the lumbar segment (33%) (p=0.022) (table 1). Progression in the cervical segment was not higher in patients with psoriasis (data not shown). In the ‘12 year completers’, mean progression was 11.7 (11.5) (n=64).
Status and progression based on the modified Stoke Ankylosing Spondylitis Spine Score
Over the entire follow-up period, in 24% of patients and in 18% of the ‘12 year completers’ (and in 39% of the 2 year intervals) there was no progression in mSASSS. Progression ≥1 mSASSS unit occurred in 72% of patients (and in 54% of the 2 year intervals) and progression ≥5 mSASSS units in 22% of patients (and in 12% of the 2 year intervals) (table 2). When taking only the first 2 year interval into consideration, 46% of patients did not show any mSASSS progression, 48% showed progression ≥2 units and 25% showed progression ≥5 units.
Progression of radiographic damage over time
Development of new syndesmophytes
A new syndesmophyte developed in 38% of all 2 year intervals according to R1 and in 39% according to R2 in previously uninvolved VCs. Throughout follow-up, 55% (R1) and 63% (R2) of patients developed at least one syndesmophyte in previously uninvolved VCs (table 3). For the ‘12 year completers’, similar results were obtained for the proportion of 2 year intervals with a new syndesmophyte, and in total 69% (R1) and 74% (R2) of patients developed at least one syndesmophyte over the 12 years. Taking the first 2 year interval into consideration, 29% (R1) and 33% (R2) of patients developed at least one new syndesmophyte.
Development of new syndesmophytes over time
Radiographic progression over time
At the individual patient level, radiographic progression was highly variable. In figure 1, mSASSS is plotted as a function of follow-up time (figure 1A) and as a function of symptom duration (figure 1B). Variable progression rates are seen within and across patients, independent of follow-up time and symptom duration (and age—see online supplementary figure S2). This cohort included patients with very short symptom duration as well as patients with more than 40 years of symptom duration. This visual analysis shows that radiographic progression is not only seen in young patients with early disease but also in patients with longstanding disease.
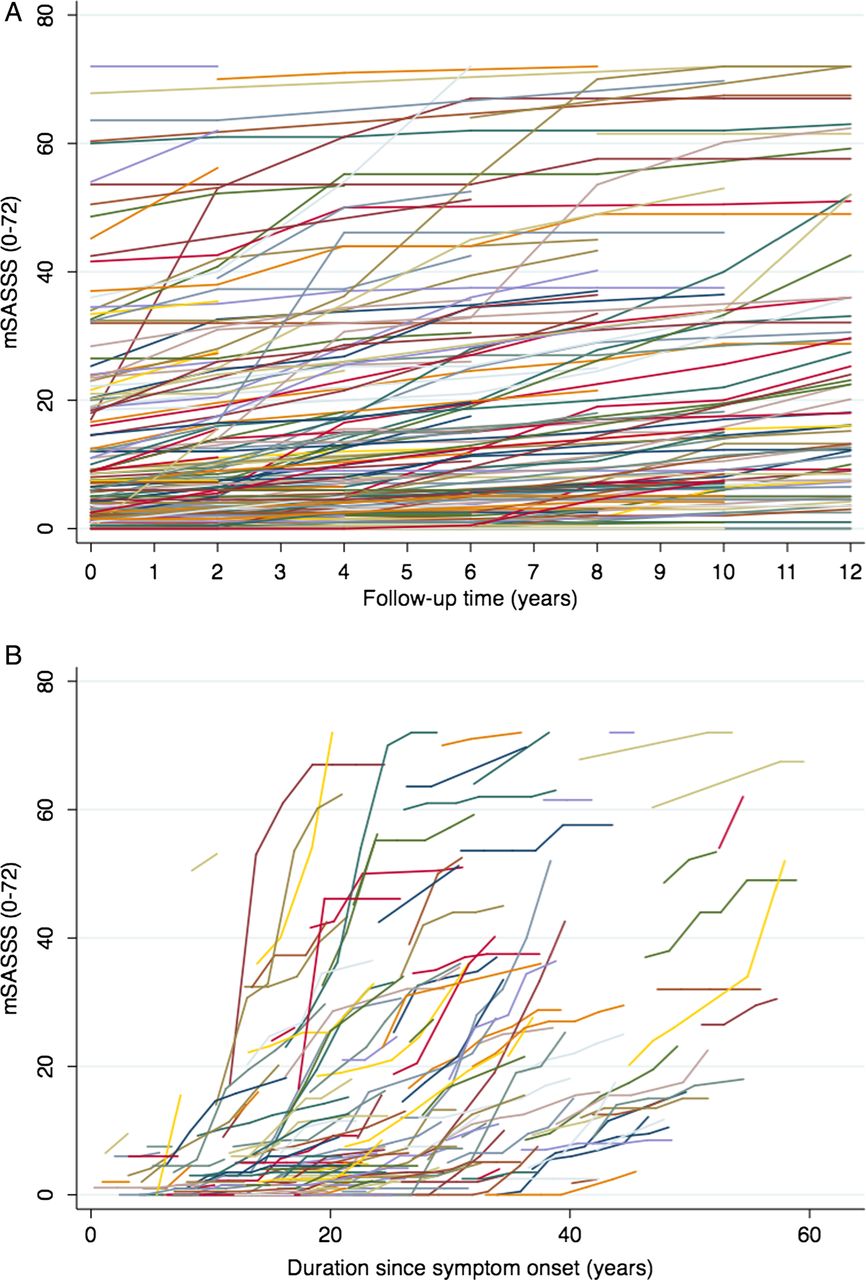
Radiographic progression at the patient level. (A) Modified Stoke Ankylosing Spondylitis Spine Score (mSASSS) per patient, plotted as a function of follow-up time. (B) mSASSS plotted as a function of duration since symptom onset.
At the group level, however, a linear time function fitted the observed data best (figure 2). Time was positively associated with radiographic damage, at a rate of 0.98 mSASSS units/year. Radiographic progression occurred significantly faster in men than in women (1.11 vs 0.69 mSASSS units/year), in HLA-B27 positive than in HLA-B27 negative patients (1.03 vs 0.70 mSASSS units/year) and in patients with a baseline mSASSS≥10 (which was the median value) compared with those with a baseline mSASSS<10 (1.44 vs 0.69 mSASSS units/year). HLA-B27 positive men (but not women) had a significantly higher progression than HLA-B27 negative men (1.18 vs 0.69 mSASSS units/year) (interaction of HLA-B27, gender and time: p=0.17).

Radiographic progression at the group level. mSASSS, modified Stoke Ankylosing Spondylitis Spine Score.
HLA-B27 positive men with a baseline mSASSS≥10 had a higher progression than HLA-B27 negative men with a baseline mSASSS<10 (1.56 vs 0.75 mSASSS units/year) (interactions p<0.04). This effect was not found in women. Progression occurred fully independently of disease and symptom duration (table 4). This table also shows that subgroups of women or HLA-B27 negative patients were small, as usually seen in AS cohorts.
Modelling of radiographic progression over time
Progression was higher in patients that were ever exposed to TNFi compared with those who were not (1.54 vs 0.82 mSASSS units/year; interaction p=0.041).
Progression was independent of treatment with NSAIDs during follow-up, spondyloarthritis related manifestations (psoriasis, inflammatory bowel disease and uveitis) and the presence of a positive spondyloarthritis family history. Progression was not different between the first and the second 6 years of follow-up.
Discussion
The present study, performed in a prevalence cohort of patients with AS, showed that long term radiographic progression in AS is more severe in HLA-B27 positive men, and—as expected—in patients with a higher level of radiographic damage present at baseline. Not less than 60% of all patients developed at least one new syndesmophyte over a period of up to 12 years.
Radiographic progression follows an approximately linear course at the group level, with a remarkably stable progression rate of approximately 1 mSASSS unit per year when modelled by GEE. More progression was found in the cervical than in the lumbar spine, which is in line with what has been previously reported in an analysis of OASIS with limited follow-up.23
The remarkably stable group progression of 1 mSASSS unit per year in AS covers up a highly variable—and to a large extent unpredictable—course of progression of radiographic damage in individual patients. Approximately 25% of patients showed no progression, 25% showed a high level of progression (arbitrarily defined as at least one 2 year interval with progression ≥5 mSASSS units) and the remaining patients showed progression rates of about 2 units/2 years. But more importantly, simple visualisation of individual progression curves plotted against duration of symptoms revealed that periods of steep progression and relative quiescence may alternate, and this process of oscillation may occur both in ‘early AS patients’ as well as in ‘advanced’ patients with ages greatly more than over 60 years. Likely the most important observation of this longitudinal study is that radiographic progression is entirely independent of disease or symptom duration. This observation has implications for clinical practice where a vested opinion says that AS may extinguish over time (which is now demonstrably false), as well as for the necessity of intervening with radiographic progression: 40 years with continuous slow progression or intervals with accelerated progression will sooner or later lead to a situation with clinically important radiographic damage.24
We have shown previously that mean progression in OASIS was 1 unit per 2 years while in the current analyses we found a mean progression of 1 unit per year. This at first contradictory result can be fully explained by the difference in reading with blinded time points in the previous analyses and known time points in the current analysis. We have described this effect of (un)blinding time order in a separate paper comparing 2 year progression scores in OASIS.17 However, the progression rate reported in this study (2 mSASSS units every 2 years) is in line with what has been previously reported in other studies. There are reports of 2 year mSASSS progression scores of approximately 1 mSASSS unit,4–6 ,11 1.5 units,25 2.5 units12 and 2.6 units (extrapolation to a 2 year period of the annual progression rate of 1.3)14 whereas for the same interval (first 2 year interval) we found a progression rate of 1.8 units. The differences between the scores can be attributed to differences in selection of patients, baseline radiographic damage, reading conditions17 or method of imputation of missing VCs. Another study described radiographic damage over time, but only in 20 patients, using the Bath AS Radiology Index,26 and thus not allowing a formal comparison.27 Furthermore, the mSASSS has been shown to be the most appropriate measure to assess radiographic damage in patients with AS and thus our selection.13 ,28
The proportion of patients developing new syndesmophytes over time has not been reported in many studies. Poddubnyy et al reported 11% of patients with AS with at least one new syndesmophyte and Baraliakos et al reported 19% of patients, both within a 2 year period. In our study, we found 29–33% (according to each of the readers) of patients with at least one new syndesmophyte over the same period. These differences can also be explained by the varying presence of baseline syndesmophytes, in all studies the strongest variable to be associated with further progression of damage.11 ,12 ,14
The long term follow-up of our study allows us to conclude that 60% of all patients develop at least one new syndesmophyte over up to 12 years, implying that syndesmophytes will occur in the vast majority of patients and not only in those with severe radiographic progression.
This study is unique in that it addresses the long term ‘natural’ course of radiographic progression. The vast majority of OASIS patients has never been exposed to TNFi. Remarkably, in those that have been exposed to TNFi, we found a higher progression rate than in patients that had never been exposed. Likely this is ‘confounding by indication’: the TNFi exposed patients would be those with more active disease and subsequently higher progression rates. Interestingly, NSAID use, which has been associated with impaired progression,7 ,8 did not have any impact on radiographic progression over time.
Some limitations of the present study should be addressed. Over the 12 years, almost two-thirds of the patients were lost to follow-up, and selection bias cannot be ruled out. We have presented our results for all patients as well as for the ’12 year completers’ and we have found them to be concordant in every analysis, thus making it unlikely that non-random attrition influenced our observations. OASIS is a prevalence cohort that, despite having a good representation of the spectrum of AS and of patients of varying ages, includes mainly patients with established AS with a relatively high level of baseline damage. Therefore, these results may not be generalisable to patients with short symptom duration. Further, women and HLA-B27 negative patients (especially in combination) do not occur in high numbers in AS cohorts, and estimates of radiographic progression in these subgroups are therefore rather unstable.
Although interobserver reliability of the mSASSS was good, agreement for the individual VC scores between readers at a given time point was worse, mainly because of the long follow-up. However, in most of those cases, readers scored the same new syndesmophytes but at different time points, which is not necessarily the same as non-agreement: if a reader observes the subtle appearance of a new syndesmophyte in a time series of x-rays, he has to decide at which time point that syndesmophyte will first be scored as positive. This methodological phenomenon has precluded an analysis of new syndesmophytes agreed upon by both readers at the same time point. Such an approach would artificially and substantially reduce the number of new syndesmophytes over time.
In summary, over a follow-up period of up to 12 years, progression of structural damage in AS patients is largely unpredictable, often alternating with periods of acceleration and quiescence, and may occur in early as well as in very advanced patients with AS at older ages. About 60% of all patients developed at least one new syndesmophyte over a period of up to 12 years. Radiographic progression may be underestimated if the data are presented at the group level, as a linear average rate of 1 mSASSS unit per year. In HLA-B27 positive men in particular and in patients with a higher level of damage already present, physicians should be alert to future radiographic progression.
References
Supplementary materials
Supplementary Data
This web only file has been produced by the BMJ Publishing Group from an electronic file supplied by the author(s) and has not been edited for content.
Files in this Data Supplement:
- Data supplement 1 - Online supplement
Footnotes
Handling editor Tore K Kvien
Contributors SR, AvT, RL and DvdH designed the study. SR, AvT, CS, RL, FvdB, MD and DvdH collected the data. SR and CS read the radiographs. AvT was the adjudicator. SR, AvT, RL and DvdH analysed the data and critically interpreted the results. SR prepared the first version of the manuscript. All authors reviewed the draft versions and gave their approval of the final version of the manuscript.
Competing interests None
Funding SR was supported by the Fundação para a Ciência e Tecnologia (FCT), grant SFRH/BD/68684/2010.
Ethics approval The ethics committee from Maastricht University Medical Centre approved the study.
Provenance and peer review Not commissioned; externally peer reviewed.
Linked Articles
- Correction