Article Text

Abstract
Objective In the randomised scleroderma: Cyclophosphamide Or Transplantation (SCOT trial) (NCT00114530), myeloablation, followed by haematopoietic stem cell transplantation (HSCT), led to improved clinical outcomes compared with monthly cyclophosphamide (CYC) treatment in systemic sclerosis (SSc). Herein, the study aimed to determine global molecular changes at the whole blood transcript and serum protein levels ensuing from HSCT in comparison to intravenous monthly CYC in 62 participants enrolled in the SCOT study.
Methods Global transcript studies were performed at pretreatment baseline, 8 months and 26 months postrandomisation using Illumina HT-12 arrays. Levels of 102 proteins were measured in the concomitantly collected serum samples.
Results At the baseline visit, interferon (IFN) and neutrophil transcript modules were upregulated and the cytotoxic/NK module was downregulated in SSc compared with unaffected controls. A paired comparison of the 26 months to the baseline samples revealed a significant decrease of the IFN and neutrophil modules and an increase in the cytotoxic/NK module in the HSCT arm while there was no significant change in the CYC control arm. Also, a composite score of correlating serum proteins with IFN and neutrophil transcript modules, as well as a multilevel analysis showed significant changes in SSc molecular signatures after HSCT while similar changes were not observed in the CYC arm. Lastly, a decline in the IFN and neutrophil modules was associated with an improvement in pulmonary forced vital capacity and an increase in the cytotoxic/NK module correlated with improvement in skin score.
Conclusion HSCT contrary to conventional treatment leads to a significant ‘correction’ in disease-related molecular signatures.
- systemic sclerosis
- hematopoietic stem cell transplantation
- cyclophosphamide
- interferon signature
- neutrophil
Statistics from Altmetric.com
- systemic sclerosis
- hematopoietic stem cell transplantation
- cyclophosphamide
- interferon signature
- neutrophil
Key messages
What is already known about this subject?
Myeloablation, followed by haematopoietic stem cell transplantation (HSCT), led to improved clinical outcomes in systemic sclerosis in clinical trials.
What does this study add?
Gene expression changes ensuing from HSCT in systemic sclerosis had not been previously investigated.
Presence of a neutrophil signature and an inverse cytotoxic/NK signature was detected in addition to a previously described interferon signature in the baseline Scleroderma: Cyclophosphamide Or Transplantation peripheral blood cell samples and confirmed in an independent sample.
HSCT led to significant improvements in the systemic sclerosis molecular signature at the peripheral blood cell RNA and serum protein levels while similar changes were not observed with cyclophosphamide.
How might this impact on clinical practice or future developments?
The significant ‘correction’ in disease-related molecular signatures after HSCT provides further support for this treatment modality in severe systemic sclerosis.
Introduction
The open-label, randomised controlled trial Scleroderma: Cyclophosphamide Or Transplantation (SCOT), was recently completed.1 SCOT compared the efficacy of myeloablation, followed by stem cell rescue to immunosuppressive treatment with 12 monthly intravenous cyclophosphamide (CYC) infusions in systemic sclerosis (SSc). In agreement with two previously completed randomised controlled trials,2 3 SCOT showed that autologous haematopoietic stem cell transplantation (HSCT) is more effective in improving clinical outcomes than CYC, including survival and event-free survival.
The rationale for utilisation of HSCT in autoimmune diseases is that the immunoablation followed by stem cell rescue ‘resets’ the immune system. Despite a rapidly growing clinical experience,4 studies on the mechanisms by which HSCT halts disease progression are scarce. There are also no previous whole blood global gene expression studies on the effect of HSCT in SSc or other autoimmune diseases.
Capitalising on the valuable prospectively collected biospecimens in the SCOT trial, whole blood high through-put transcript and protein profiling was performed to directly assess the global molecular changes ensuing from HSCT in comparison to CYC therapy in study participants. We hypothesised that HSCT leads to correction of SSc-related immune dysregulations at the whole blood RNA and serum protein levels.
Methods
Baseline study participant characteristics
The inclusion criteria for SCOT participants have been published previously1 and mentioned briefly in the online supplemental methods.
Supplemental material
For confirmation of the dysregulated transcript signatures, an independent sample of SSc participants and controls from UT Houston Divisional Repository was examined. The characteristics of this independent samples have been also described in the online supplemental methods.
Gene expression profiling and analysis
Whole blood samples were collected in Tempus tubes (Applied Biosystems, Foster City, California, USA) and stored at −80°C. RNA was extracted according to the manufacturer’s protocol. RNA quality was assessed using Bioanalyzer (Agilent Genomics, Santa Clara, California, USA) and those with RNA integrity numbers >7 were examined. Global gene expression was assessed using Illumina HT-12 arrays (Illumina, San Diego, California, USA) in SCOT samples and Illumina Human Ref8 V.3 arrays in UT Houston Divisional Repository samples. The gene expression data are deposited on Gene Expression Omnibus (GSE130953). Details regarding gene expression normalisation, filtering and initial analysis, as well as the modular analysis,5 are mentioned in the online supplemental methods.
Serum protein composite scores
Concomitantly collected serum samples were stored at −80°C and not thawed until tested. Levels of 102 proteins involved in immune response and inflammation were measured in the Clinical Laboratory Improvement Amendments (CLIA) certified Myriad Rule Based Medicine Laboratory (Austin, Texas, USA).
Serum proteins correlating with the upregulated interferon (IFN) (M1.2 and M3.4) and neutrophil (M5.15) transcript modules based on correlation coefficient of 0.3 or above (≥0.3 or ≤−0.3) and p FDR< 0.05 were identified. A composite score of the correlating proteins6–9 was calculated for each transcript module as described in the online supplementary method section.
Similarity network fusion analysis
A previously described similarity network fusion analysis (SNF)10 of multilevel longitudinal molecular data was performed in all SCOT participants with an available 26-month sample (n=35; 18 in CYC arm and 17 in the HSCT arm). Also, 35 age-matched and gender-matched unaffected controls were included. Global gene expression profile of all transcripts whose log intensity variance was in the top 25% (n=11 830), as well as all longitudinally examined serum proteins were included (see online supplementary m ethods for further details).
Patient and public involvement
This study was reviewed and partially funded by a patient organisation (Karen Brown Scleroderma Foundation).
Results
Seventy-five participants underwent randomisation in the SCOT trial. Six-two participants had a baseline whole blood RNA sample of sufficient quality and were included in the present study. Moreover, 1:1 age-matched and gender-matched unaffected controls were investigated. None of SCOT participants were on immunosuppressive agents except for prednisone or its equivalent ≤10 mg during baseline blood sample collection.
Online supplementary table 1 shows the demographic and baseline clinical characteristics of the 62 participants (27 HSCT and 35 CYC), as well as 62 matched unaffected controls examined in the present study. All SCOT participants had diffuse cutaneous involvement.
The longitudinal analysis was performed in the per-protocol population defined as those participants who received a transplant or completed ≥9 doses of CYC. Fifty-six participants belonged to the per-protocol population (HSCT=26 and CYC=30). From whom, 46 eight months (23 in each arm) and 35 twenty-six months samples (17 in HSCT and 18 in CYC) were available. A detailed breakdown of available longitudinal samples is shown in the online supplementary results. At 26-month visit, one participant in the HSCT (1/17=5.9%) and five participant in the CYC arm (5/18=27.8%) were on immunosuppressive agents.
Identification of differentially expressed modules in the SCOT SSc participants at baseline
The comparison of peripheral blood cell (PBC) global gene expression profile of baseline SSc samples to matched controls revealed 3168 differentially expression genes (DEGs) (for complete list see https://uth.tmc.edu/scleroderma/). Moreover, online supplementary figure S1 shows the unsupervised clustering of the baseline SSc samples.
Subsequently, a previously described modular analysis method was completed.5 6 11 In this analysis, 62 gene expression modules (sets of coexpressed genes) that are observed in whole blood across a variety of inflammatory and infectious diseases, are investigated. If possible, a biological function is assigned to a module based on the function of genes present in this module (eg, IFN, B-cell, plasma cell). Other modules remained uncategorised (undetermined).
As shown in figure 1 and online supplementary table 2, in comparison of baseline SSc to control samples, two IFN modules (M1.2 and M3.4) and one neutrophil module (M5.15) were the only statistically significant upregulated modules. Four modules were significantly down-regulated (M3.6: Cytotoxic/NK Cell, M2.3: Erythrocyte; M3.1: Erythrocyte; M4.4: Unannotated).

(A) Modular analysis of baseline SSc in comparison to unaffected control samples. The numbers on the x-axis and y-axis indicate the coordinates of modules; (B) Annotation of modules based on known biological function of genes included in a given module; (C) Legend for the colour coding in A. Significantly differentially expressed modules in QuSAGE analysis are shown with red perimeters. A significant upregulation of interferon (M1.2, M 3.4) and neutrophil (M5.15) modules were observed while erythrocyte and cytotoxic NK/ NK T (M3.6) modules were significantly downregulated.
Presence of IFN, neutrophil, and inverse cytotoxic/NK cell signatures are confirmed in an independent SSc sample
The aforementioned SSc modular signature was confirmed in an independent sample of whole blood gene expression profiles from 58 individuals with SSc and 40 matched controls enrolled in the UT Houston Divisional Repository (see online supplementary table 3 for characteristics). All three, aforementioned upregulated modules (M1.2 and M3.4 IFN modules, as well as M5.15 neutrophil module), were also upregulated in SSc versus control comparison in this independent sample (pFDR <0.001 for all three comparisons—online supplementary table S4). Among aforementioned downregulated modules, only M3.6-cytotoxic/NK cell module was also significantly down-regulated in this sample.
Relationships among the neutrophil, IFN, and inverse cytotoxic/NK cell modules in the baseline SCOT samples
As shown in online supplementary results and online supplementary figure S2, the two IFN modules, M1.2 and M3.4 usually co-occurred and highly correlated while an upregulation of the neutrophil module M5.15 and a downregulation of the cytotoxic/NK module M3.6 could exist independently.
As expected, the neutrophil transcript module M5.15 showed a moderate correlation with the baseline neutrophil counts (rs=0.39, p=0.002) but neither the two IFN modules M1.2 and M3.4 (p=0.503 and p=0.54, respectively) nor the cytotoxic/NK module M3.6 (p=0.399) showed a significant correlation with the neutrophil count. A complete list of genes contained in the M1.2, M3.4, M3.6 and M5.15 modules is shown in the online supplementary table S5.
Differential gene expression after treatment in the SCOT study
In the HSCT arm of the SCOT study, there were 1870 DEGs when 8-month samples were compared with baseline while the number of DEGs increased to 2555 in comparison of 26 months to baseline samples (table 1). Only 520 transcripts were differentially expressed concordantly at both 8 and 26 months.
Number of differentially expressed transcripts in pairwise comparisons
Subsequent studies focused on modular analysis of 26 months compared with the baseline samples, because the immune recovery with reconstitution of innate and adaptive immunity cell counts is generally completed by this time point, while immunoreconstitution of major components of immune system including CD4 +T-cells is at a transient stage at the 8-month time point.12 13 As shown in figure 2 and online supplementary table 6, the pairwise comparison of 26 months to baseline samples showed an upregulation of adaptive immune modules such as B-cell, plasma cell and T-cell signature and a downregulation of general inflammation modules (M3.2, M4.13). Focusing on the aforementioned SSc signatures, the two most prominently upregulated modules in the baseline SSc samples (M1.2 (IFN) and M5.15 (neutrophils)) were significantly decreased while the downregulated cytotoxic/NK cell module M3.6 was significantly increased 26 months after HSCT. Comparing the 26-month samples to matched unaffected controls (online supplementary table S7) revealed upregulation of plasma cells (M4.11), B-cells (M4.10) and Ccytotoxicity/T-cells (M3.3 and M4.15)) as well as cell cycle (M3.3) and a downregulation of modules related to myeloid lineage (M3.2) and general inflammatory modules (M3.2, M4.13). However, focusing on the aforementioned SSc signatures, the comparison of 26-month HSCT to unaffected controls did not show an upregulation of the three upregulated SSc transcript modules (M1.2, M5.15 and M3.4) or a downregulation of the cytotoxic/NK cell module (M3.6) as observed in the baseline SSc samples. These data indicate that the gene expression profile of SCOT participants after completion of immune recovery at 26 months represents a ‘new normal’ status, which normalised the SSc baseline transcriptional signature and downregulated innate immunity-related inflammatory pathways while inducing programme related to adaptive immunity reconstitution.
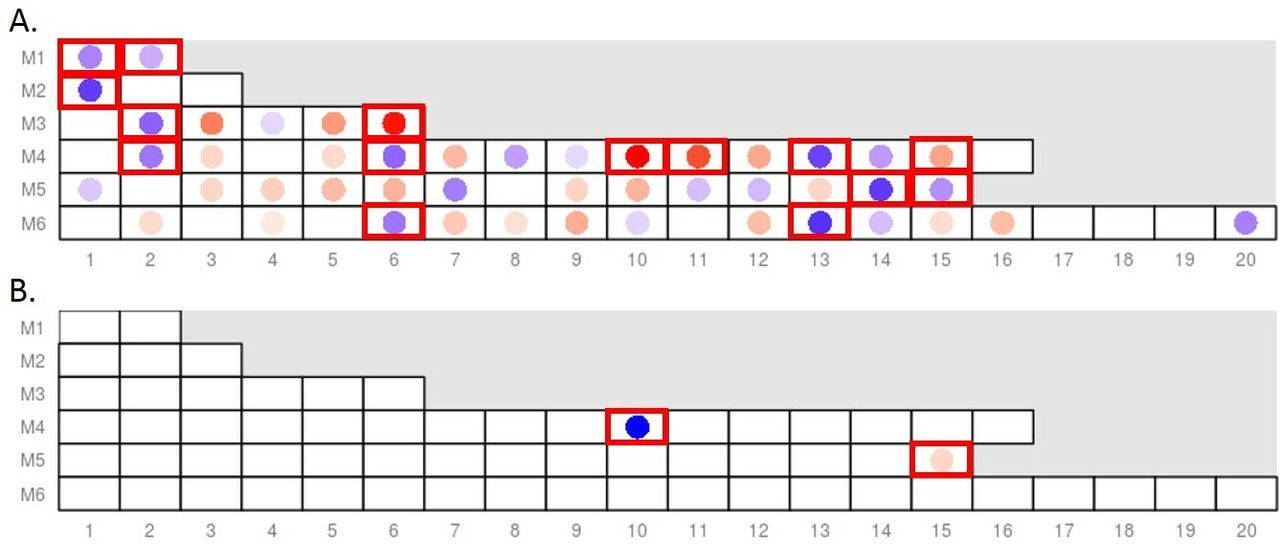
Differentially expressed modules in pairwise comparisons to baseline SSc samples: (A) Comparison of 26 months to baseline samples in the HSCT arm shows a significant downregulation of the IFN (M1.2) and neutrophil modules (M5.15), as well as a significant upregulation of the cytotoxic/NK cell module (M3.6) after treatment; (B) Comparison of 8 months to baseline samples in the CYC arm (active treatment period) shows no significant change in the IFN modules (M1.2 and M3.4) and an upregulation of the neutrophil module (M5.15), only the B-cell module (M4.10) was downregulated. Legend for the colour coding is shown in figure 1C. Significantly differentially expressed modules in QuSAGE analysis are shown with red perimeters. For the complete list of differentially expressed modules, see online supplementary tables S6 and S8. CYC, cyclophosphamide; HSCT, haematopoietic stem cell transplantation; IFN, interferon.
In the CYC arm, there were 58 DEGs when the 8-month samples were compared with baseline (table 1). No DEGs were detected in comparison of 26 months to baseline samples. A modular analysis of 8-month samples in comparison to baseline control samples, revealed an upregulation of the neutrophil module and an expected downregulation of the B-cell module (figure 2 and online supplementary table 8).
A complete list of all differentially expressed genes in the paired longitudinal analyses is provided at https://uth.tmc.edu/scleroderma/.
Online supplementary figure 3 shows the levels of the four confirmed SSc transcript modules (two IFN, neutrophil and cytotoxic/NK modules) at the baseline, 8-month and 26-month visits in those participants who have completed the 26-month time point. As shown in the online supplementary results and online supplementary tables S9 and S10, a cross-comparison of changes in these four modules across the two treatment arms indicated that participants in the HSCT arm had more decline in the IFN (M1.2 and M3.4) and neutrophil (M5.15) modules and a significantly greater increase in the cytotoxic/NK cell module than in the CYC arm.
Altogether, these results indicated that HSCT led to significant corrections in the SSc-related transcript signatures 26 months after transplant while CYC treatment did not have similar effects.
Serum protein correlates of the IFN and neutrophil modules also decrease after HSCT in the SCOT study
Thirteen and 14 serum proteins correlated with the two IFN modules, M1.2 and M3.4, respectively (online supplementary table S11) while four proteins correlated with the neutrophil module M5.15 (online supplementary table S12). Subsequently, a composite score of correlating serum proteins was calculated for each transcript module according to a previously described method.6–9 In the paired analysis, all three serum protein scores significantly decreased in the HSCT arm while there was no significant change in the CYC arm (figure 3 and online supplementary table S13). As shown in online supplementary results, similar to the transcript-level data, participants in the HSCT arm had more decline in the IFN (M1.2 and M3.4) and neutrophil (M5.15) protein composite score than in the CYC arm.
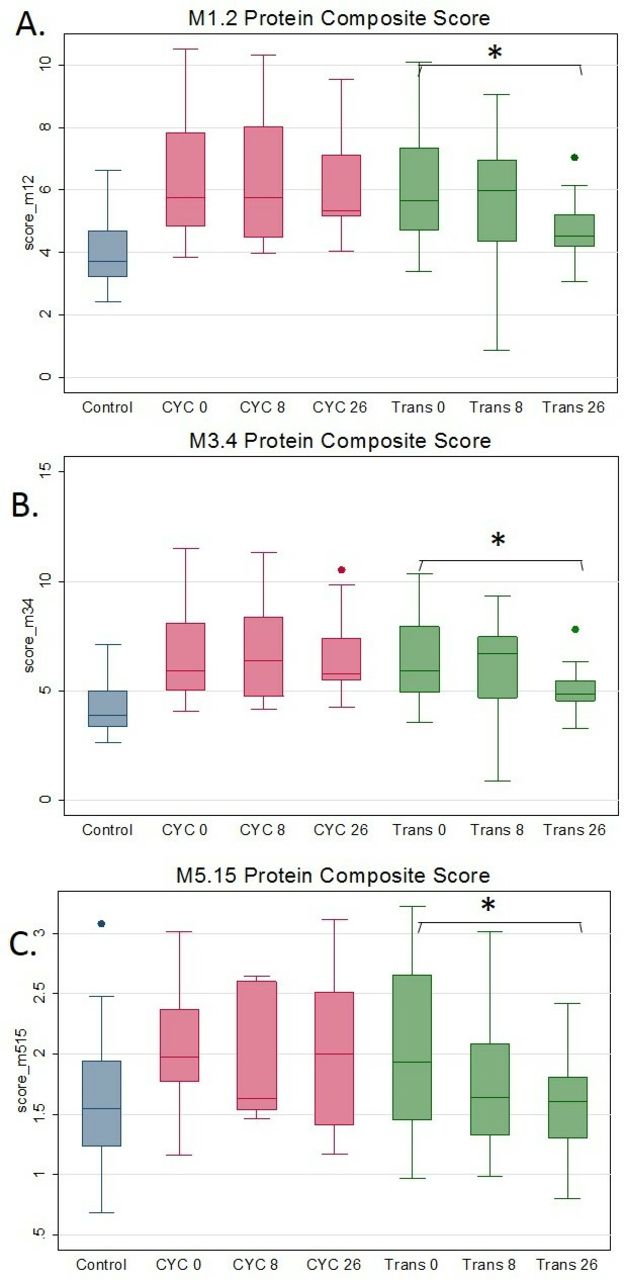
Longitudinal measurements of M1.2 (IFN-panel A), M3.4 (IFN-panel B), M5.15 (neutrophil-panel C) protein composite score in 26 months completers. After immune recovery at the 26 months visit in the transplant arm, all three protein composite scores decreased significantly, while similar changes were not observed in the cyclophosphamide arm. *P<0.05 in the comparison to baseline in the paired t-test analysis. The displayed data at all time points are restricted to those participants that completed the 26 months visit. CYC, cyclophosphamide; IFN, interferon.
A complete list of all investigated proteins and their longitudinal changes from the baseline to 26-month visit is shown in the online supplementary data file at https://uth.tmc.edu/scleroderma/. Online supplementary figure S4 shows the longitudinal changes in three Th2 cytokines associated with alternative macrophage activation and implicated in SSc pathogenesis: PARC (CCL-18),14–16 IL-617–20 and MCP-1 (CCL-2),21 22 as well as two Th1 cytokines, IL-1b23 and IL-1224 as comparators. While PARC, IL6 and MCP1 significantly decreased 26 months after HSCT, similar changes in IL-1b and IL-12 were not observed. Moreover, none of the above cytokines changed over time in the CYC arm.
SNF analysis of multilevel data in the SCOT study
The availability of PBC global gene expression data (RNA level) and concurrently collected serum protein data enabled us to perform a multilevel analysis.10 All investigated transcripts and proteins were included in this analysis in order to provide unbiased, multilevel clustering analysis (online supplementary figure S5). This analysis provides a multilevel, global view of the molecular profile of samples that is not confined to differentially expressed genes/proteins. As shown in figure 4, 13 (76%) of CYC 26-month samples clustered with 24 (71%) of baseline SSc samples while 13 (76%) HSCT 26-month samples built a separate network or clustered with unaffected controls. Only three HSCT 26 months samples clustered with baseline SSc samples. All unaffected control samples grouped together in a single cluster.

Similarity network fusion analysis of global gene expression and all available serum protein data from matched controls (circle-green, n=34), baseline SSc (triangle-red, n=34), HSCT—26 months visit (square-light blue, n=17) and CYC—26 months visit (diamond-dark blue, n=17) samples. Each shape represents a unique sample. Three distinct networks clusters were present, which are divided by the black line. The majority of baseline SSc and CYC 26 months visit samples formed a distinct network cluster while majority of HSCT 26 months visit samples formed a separate network cluster (middle). Moreover, all unaffected controls clustered separately. Of note, this is a two-dimensional display of a three-dimensional space. CYC, cyclophosphamide; HSCT, haematopoietic stem cell transplantation; SSc, systemic sclerosis.
Correlation with clinical measures in the SCOT study
The clinical outcomes in the SCOT trial are reported in detail separately.1 Herein, the focus was on correlation of change in transcript modules with clinical measures. Specifically, it was investigated whether per cent change in the two IFN transcript modules (M1.2, M3.4) and neutrophil (M5.15) and cytotoxic/NK (M3.6) transcript modules from 26 months to baseline visits correlated with per cent change in concurrently obtained forced vital capacity % predicted (FVC%)25 and modified Rodnan Skin Score (mRSS)26 27 during the same time period.
At the baseline visit, the cytotoxic/NK module showed a significant, negative correlation with mRSS (rs=−0.33, p=0.0084; that is, lower M3.6 transcript scores were associated with higher mRSS), while the other transcript modules did not correlate with the concurrently obtained FVC or mRSS. As shown in table 2 in the longitudinal analysis, a decline in the two IFN (M1.2 and M3.4) and neutrophil (5.15) transcript modules correlated significantly with an increase (ie, improvement) in FVC% (rs=−0.43, rs=−0.45, rs=−0.36, respectively). Moreover, an increase in the cytotoxic/NK module was significantly associated with a decline (ie, improvement) in mRSS (rs=−0.56).
Correlation of per cent change in transcript modules with per cent change in clinical measures at the 26-month visit
In an exploratory analysis, clinical measures for the three HSCT recipients whose V-26 months samples grouped with baseline SSc samples in the SNF analysis (figure 4) were compared with the remaining 14 HSCT recipients. Means for changes in FVC% and mRSS at month 26 were worse for these three participants (mean difference FVC%=−11.3%, p=0.0586; mean difference mRSS=22.7%, p=0.0588).
Discussion
In the present study, using a genome-wide PBC global gene expression analysis, the presence of an IFN signature was confirmed6 28 29 and for the first time the presence of a PBC neutrophil and inverse cytotoxic/NK cell signature was described in SSc. The upregulated SSc signatures significantly decreased and the downregulated cytotoxic/NK cell module increased 26 months after HSCT while immunosuppression with CYC did not have similar effects, indicating HSCT has a normalising effect on the SSc molecular signature. Moreover, similar changes were observed at the protein level. Considering that the present study represents to our knowledge, the first whole blood study of myeloablation followed by HSCT in systemic autoimmune disease, the significant changes in the disease-related molecular signatures after HSCT is an important, potentially clinically relevant finding.
In the present study, a neutrophil signature (M5.15) was described for the first time in the PBCs of SCOT participants and confirmed in our divisional samples. This module can exist independent of the IFN modules (online supplementary figure S2). The module 5.15 consists of 24 transcripts corresponding to 23 genes strongly related to neutrophil function including those belonging to early granulopoiesis, such as myeloperoxidase, neutrophil elastase (ELANE), cathepsin G (CTSG), defensin A4 (DEFA4) and lactotransferrin. As expected, the neutrophil transcript module showed a moderate association with the concomitantly collected neutrophil count (rs=0.39). Previous data in systemic lupus erythematosus have indicated that the neutrophil transcript module has a higher correlation with the counts of young, activated neutrophils (CD62L-low on flow cytometry).11 30 The correlation of this transcript module with low density neutrophil31 or CD62L-low, activated neutrophil counts needs be investigated in future SSc studies. In the present study, the M5.15 module significantly decreased 26 months after HSCT. This module showed a significant increase during active treatment and no change after completion of treatment in CYC arm. The increase in the neutrophil module at 8 months might reflect the compensatory granulopoiesis in response to CYC-induced neutropaenia as the blood draw at 8 months occurred approximately 30 days after the prior infusion and just before the next intravenous CYC treatment.32
The serum proteins correlating with the IFN and neutrophil transcript modules, as well as several Th2/M2 macrophage (PARC (CCL-18), IL-6, MCP-1 (CCL-2)) cytokines, also decreased significantly after the HSCT while there was no significant change in the CYC arm. Consistent with our findings, serum MCP-1, a prominently dysregulated cytokine in SSc,21 significantly decreased after treatment in 20 individuals with SSc undergoing HSCT in the multicentre European ASTIS study.33 Paralleling the transcript-level findings, these results confirm significant changes in the serum protein signatures of SSc after HSCT.
Our comprehensive, multilevel SNF confirmed the participants after HSCT show substantial molecular changes and do not cluster with baseline SSc samples at 26-month visit while the majority of post CYC samples have a similar molecular profile like baseline SSc. Although the molecular profile of post-transplant samples lack the disease specific signature, they also do not cluster with unaffected controls. Moreover, our modular analysis (online supplementary table 6) indicates that HSCT treatment in SSc leads to a new immune status that is marked by lack of disease-specific signatures and an activation of adaptive immune modules (T-cell, B-cell and plasma cell modules). It is likely that this transcript pattern is due to the high number of naïve T-cells and B-cells after immunoreconstitution. This notion is supported by the previous studies indicating that HSCT results in an active thymogenesis and increased production of naïve T-cells and restoration of immune repertoire after immune recovery approximately 2 years after transplant, resembling the activity level seen in young children.12 34 In a recent study, HSCT also led to a correction of dysfunctional B-cell homoeostasis in SSc by increasing naïve B-cells and decreasing memory, as well as CD27-/IgD double-negative B-cells.35
The normalising effect of HSCT on the SSc molecular signatures 26 months after transplant supports the notion that this treatment modality can ‘correct’ the autoreactive immune response. In a previous study of 10 HSCT recipients with SSc, T-cell diversity increased in almost all participants compared with baseline at long-term follow-up.13 Moreover, HSCT restored the low natural T-reg (CD4 +CD25highFOXP3+) percentage counts in SSc to the levels detected in healthy donors 24 months after the transplant.36
The present study has several strengths. The study was conducted in a randomised study with a well-characterised population, where the molecular profile of a randomised control arm, treated with immunosuppressive therapy, was also examined, enabling identification of HSCT-specific treatment effects. Moreover, multilevel molecular data from concurrently obtained biospecimens were available, enabling the comprehensive SNF analysis. Lastly, age and gender-matched 1:1 unaffected controls were examined, which abrogate the objection that the observed differences are due to confounding effect of these demographic factors.
The present study has also some limitations. While gene expression studies with whole blood samples have the advantage of being less prone to handling artefacts due to transport, ex vivo handling, cell separation or storage,37 38 they provide a global view that is a function of differential cell counts and transcriptional activity of each cell type. Future gene expression studies in purified immune cell types of interest can provide additional insights in immunological changes ensuing from HSCT. Moreover, the longitudinal molecular profile could be examined only in those participants with an available biospecimen at the follow-up, it remains possible that some of our results are influenced by non-random missing data such as death.
In summary, individuals with SSc have a prominent IFN, neutrophil, and inverse Cytotoxic/NK cell transcript signatures. While HSCT treatment significantly corrects these transcript signatures, immunosuppression with CYC does not have similar effect. Similar trajectories were observed in serum protein composite scores. Lastly, changes in the transcript signatures correlated with improvement in the lung volumes and skin fibrosis. Cumulatively, these findings support the notion that HSCT can lead to a new immune status marked by lack of disease-specific molecular signatures.
Acknowledgments
The authors are thankful to Julio Charles for his contribution to sample management and coordination and Samuel Theodore for the coordination of data collection in the GENISOS cohort.
References
Footnotes
Handling editor Josef S Smolen
Contributors Conception and design of the study: SA, EG, LK-E, PM, DEF, RAN, LJC, MDM and KMS. Acquisition of the study data:SA, EG, LK-E, JV, MEH, PM, DEF, RAN, LJC, BW, AP, MDM and KMS. Analysis or interpretation of the study data:SA, XW, GC, EG, LK-E, JY, PKW, JT, WJZ, VP, CB, DEF, AP, MDM and KMS. All authors have contributed to drafting and revising the manuscript and have approved its final version.
Funding The SCOT study was supported by awards from the NIAID, NIH to Duke University, the study contract holder (N01-AI05419 and HHSN 272201100025C). The study was also supported by grants from Karen Brown Scleroderma Foundation, NIH NIAMS (P30-AR061271), NIH R01AR073284, NIH UL1-TR000371 and Department of Defense (W81XWH-16-1-0296).
Disclaimer The gene expression data and related de-identified clinical information are deposited on Gene Expression Omnibus (GEO) database - Accession number: GSE130953.
Competing interests SA reports grants from National Institute of Health, grants from Karen Brown Scleroderma Foundation, grants from Department of Defense, during the conduct of the study; grants and personal fees from Boehringer Ingelheim, personal fees from Integrity Continuing Education, personal fees from Medscape, outside the submitted work. MDM reports personal fees from Boehringer Ingelheim, during the conduct of the study; personal fees from Galapagos NV (Pharma), personal fees from Medtelligence, personal fees from Actelion Pharma, personal fees from Astellas, personal fees from Mitsubishi-Tanabe, grants from Bayer, grants from Reata, grants from Sanofi, grants from Corbus, grants from Eicos/ Sciences, outside the submitted work. KMS reports grants from National Institutes of Health, NIAID, during the conduct of the study; personal fees from GlaxoSmith/Kline, grants from Astra Zeneca, grants from Takeda Millennium, personal fees from Magenta, personal fees from Aerotek, personal fees from Kiadis Pharma, from Genentech Roche, outside the submitted work.
Patient consent for publication Not required.
Ethics approval The SCOT study protocol was approved by the local Institutional Review Board of the participating institutions.
Provenance and peer review Not commissioned; externally peer reviewed.
Data availability statement Data are available in a public, open access repository.