Article Text

Abstract
Objective Studies suggest that circulating type I interferon (IFN) may predict response to biological agents in rheumatoid arthritis (RA). Prediction of response prior to initiating therapy would represent a major advancement.
Methods We studied sera from a test set of 32 patients with RA from the Auto-immune Biomarkers Collaborative Network Consortium and a validation set of 92 patients with RA from the Treatment Efficacy and Toxicity in Rheumatoid Arthritis Database and Repository registry. The test set included those with good response or no response to tumour necrosis factor (TNF) inhibitors at 14 weeks by European League Against Rheumatism criteria. The validation set included subjects with good, moderate or no response at 12 weeks. Total serum type I IFN activity, IFN-α and IFN-β activity were measured using a functional reporter cell assay.
Results In the test set, an increased ratio of IFN-β to IFN-α (IFN-β/α activity ratio) in pretreatment serum associated with lack of response to TNF inhibition (p=0.013). Anti-cyclic citrullinated peptide antibody titre and class of TNF inhibitor did not influence this relationship. A receiver–operator curve supported a ratio of 1.3 as the optimal cut-off. In the validation set, subjects with an IFN-β/α activity ratio >1.3 were significantly more likely to have non-response than good response (OR=6.67, p=0.018). The test had 77% specificity and 45% sensitivity for prediction of non-response compared with moderate or good response. Meta-analysis of test and validation sets confirmed strong predictive capacity of IFN-β/α activity ratio (p=0.005).
Conclusions Increased pretreatment serum IFN-β/α ratio strongly associated with non-response to TNF inhibition. This study supports further investigation of serum type I IFN in predicting outcome of TNF inhibition in RA.
- Rheumatoid Arthritis
- TNF-alpha
- Cytokines
- Treatment
Statistics from Altmetric.com
Rheumatoid arthritis (RA) is a severe multisystem inflammatory disease characterised by aggressive arthritis that often leads to joint damage and disability.1 ,2 Early effective treatment of RA prevents damage.1 Current strategies involve initiating effective treatment as soon as possible within the so-called therapeutic ‘window of opportunity’, and disease remission is the primary goal.2 Anti-tumour necrosis factor (TNF)-α agents are frequently used in severe cases of RA, but responses are varied and often incomplete, and we do not know who is likely to respond to these medications before trying them. If effective control of disease is not achieved quickly, patients are at risk of permanent damage. Thus, a major unmet goal in the treatment of RA is to define parameters of the abnormal immune response that allow for rational selection of therapy. Prognostic serum markers would greatly expedite the process of achieving control over disease activity and avoid exposing patients to unnecessary medications.
In vitro studies suggest that type I interferon (IFN) and TNF-α can cross-regulate each other3 ,4; high levels of one cytokine can inhibit the production of the other cytokine. In humans, we observed a similar phenomenon in which anti-TNF-α therapy resulted in increased serum type I IFN activity.5 These data suggest type I IFN as a candidate marker for anti-TNF-α failure as it is possible that in some patients anti-TNF-α therapy may exacerbate a pre-existing tendency towards high type I IFN. Type I IFN and the major type I IFN-producing cells, plasmacytoid dendritic cells (pDCs), have been found in the synovium in patients with RA.6–9 In RA, pDCs are decreased in circulation, presumably migrating preferentially into inflamed tissues.10 This finding has also been observed in other diseases in which type I IFN has been implicated in pathogenesis, such as lupus11–13 and idiopathic inflammatory myositis.14 Furthermore, previous studies have suggested that baseline type I IFN levels may predict treatment response in RA.15 ,16 In this study, we investigate pretreatment serum type I IFN activity in patients with RA to determine whether this measurement can predict response to anti-TNF-α therapy. To measure type I IFN, we used a sensitive and reproducible reporter cell assay as ELISAs for type I IFN in human serum have been complicated by poor sensitivity and specificity.17 We have extensively validated this type I IFN reporter cell assay in human lupus18–20 and other autoimmune diseases.21–23
Patients and methods
Study cohorts
The test cohort included 32 patients with RA from the Auto-immune Biomarkers Collaborative Network (ABCoN) Consortium.24 The validation cohort included 92 patients with RA from the Treatment Efficacy and Toxicity in Rheumatoid Arthritis Database and Repository (TETRAD registry, NCT01070121).25 In the ABCoN registry test cohort, we used all available pretreatment patient samples that had received a TNF-inhibitor with follow-up data and had either a good response or non-response. Moderate response was excluded to examine the two groups that would be expected to show the largest differences. In the TETRAD validation set, we tested all available pretreatment samples that had received a TNF-inhibitor and had full follow-up data available, and included all European League Against Rheumatism (EULAR) response categories. All patients satisfied the American College of Rheumatology classification criteria for RA. Additional data included baseline and follow-up disease activity score (DAS), anti-cyclic citrullinated peptide (CCP) antibody titre and type of TNF-α inhibitor used.
Detection of type I IFN in RA patient sera
Total serum type I IFN activity, IFN-α and IFN-β activity were measured using a functional reporter cell assay. Reporter cells (WISH cells, ATCC #CCL-25) were used to measure the ability of patient sera to cause type I IFN-induced gene expression (full method outlined in refs.18 ,19). WISH cells were cultured with 50% patient serum for 6 h. The cells were lysed, and cDNA was made from total cellular mRNA. Canonical type I IFN-induced gene expression (myxovirus resistance 1, RNA-dependent protein kinase and IFN-induced protein with tetratricopeptide repeats 126) was measured using qPCR. The relative expression of these three genes was standardised to healthy donor sera and summed to generate a score reflecting the ability of sera to cause IFN-induced gene expression (type I IFN activity).
Determination of IFN-β/α ratio
Sera with a detectable amount of type I IFN activity had additional aliquots tested following pre-incubation with anti-IFN-α (19.6 μg/mL, PBL Assay Science, Piscataway, New Jersey, USA) and anti-IFN-β (10.1 μg/mL, Chemicon, Temecula, California, USA) antibodies. The amount of inhibition of the observed type I IFN activity by anti-IFN-α antibody allowed for quantitative assessment of IFN-β activity, and that by anti-β antibody allowed for quantitative assessment of IFN-α activity. The ratio of IFN-β activity to IFN-α activity (IFN-β/α activity ratio) was then calculated for each serum sample using these data. Those samples with no detectable total type I IFN activity were categorised as not having significant type I IFN present, and no ratio was calculated. The lower limit of detection for the WISH assay at 0.1 as values between 0 and 0.1 are within the variance of the assay. In each experiment, a positive control well is run for both IFN-α and IFN-β to ensure that the WISH cells are appropriately responsive. We run six negative control wells (WISH cells+media alone) to establish the expected baseline gene expression in the cells for each experiment. In addition, the anti-IFN-α and anti-IFN-β antibodies did not induce any IFN-induced gene expression in WISH cells. We also verified that the antibodies used to bind IFN-α and IFN-β could completely neutralise a significant dose of IFN-α or IFN-β respectively at the dose used, and that the antibodies did not cross-react with the other type I IFN (eg, anti-IFN-α antibody did not bind IFN-β).
Statistical analysis
For comparison of quantitative data sets, Mann–Whitney U test and Spearman's rank correlation tests were used. In the test set, a receiver–operator curve was used to determine the optimum cut-off for the pretreatment IFN-β/α activity ratio (the measurement that demonstrated the strongest p value for a difference between non-responders and good responders) as a predictor of TNF-α inhibitor response. Patients in the test set and validation set were stratified by IFN-β/α activity ratio and the proportions of responders and non-responders in the stratified groups were compared using χ2 and ORs. We also used logistic regression models to test high IFN-β/α activity ratio yes/no (ratio >1.3, based upon results from the test cohort) as a predictor variable with EULAR treatment response at follow-up as the outcome variable. Demographic and clinical variables were tested for interaction or confounding in these logistic regression models. Test set and validation set data were meta-analysed using a fixed effect model with a weighted Z-scores method, following Breslow–Day testing indicating no significant heterogeneity between the two sets of data.
Results
Patient characteristics
Baseline characteristics of anti-TNF-α-treated patients with RA classified according to EULAR response criteria are shown in table 1. The ABCoN Consortium subjects were the test cohort, and subjects from the TETRAD registry were the validation cohort. Also, 27 of the 32 subjects (84%) from the ABCoN Consortium were of European ancestry. The majority of subjects from the TETRAD registry were of European ancestry (72%). Also, 14 per cent were African-American, 6% Asian and 1% Native American. Eighty-seven per cent were Non-Hispanic. Overall, the test and validation sets had similar baseline characteristics. There were significant differences (p<0.05) in baseline DAS scores between the no response and moderate response groups in the validation set, and there were differences in the type of TNF-inhibitor used between groups (table 1).
Baseline characteristics of anti-tumour necrosis factor (TNF)-treated patients with rheumatoid arthritis classified according to European League Against Rheumatism response criteria
Test set indicates high IFN-β/α ratio predicts anti-TNF response
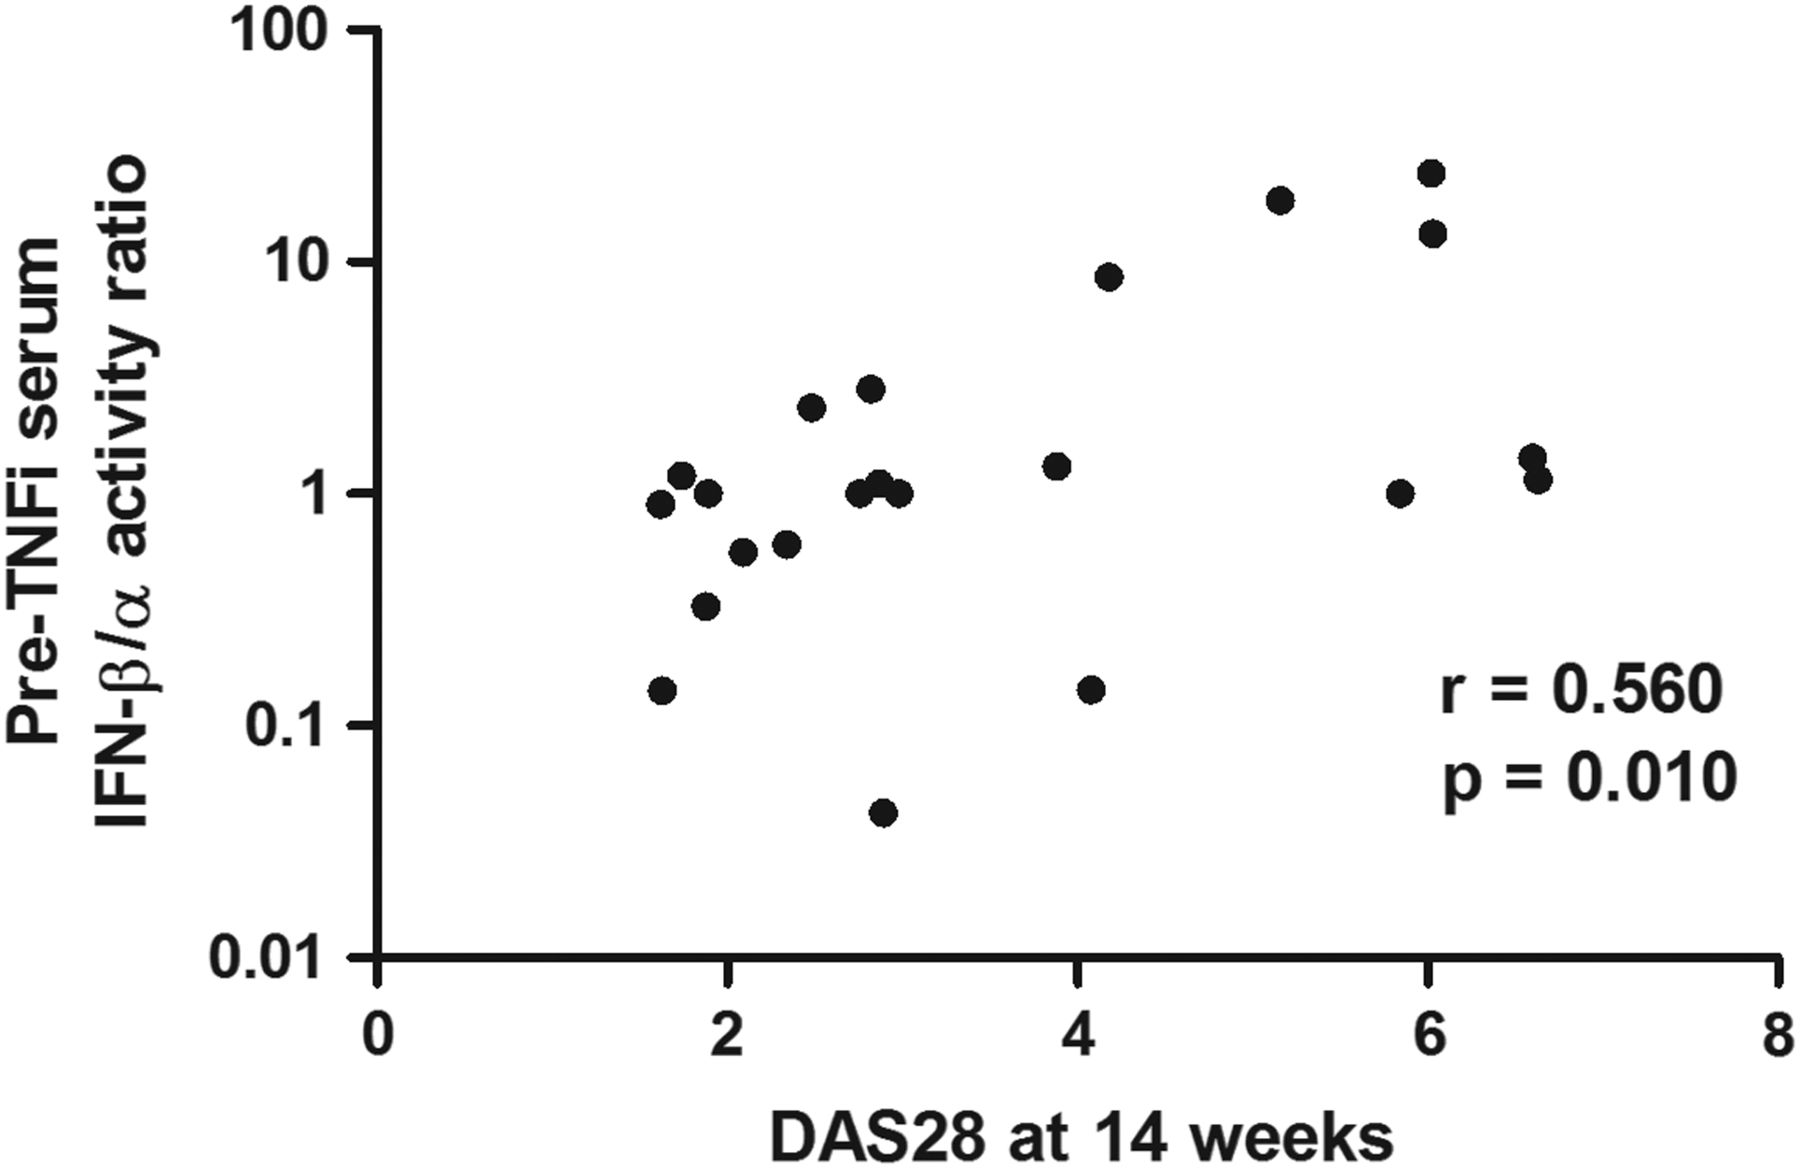
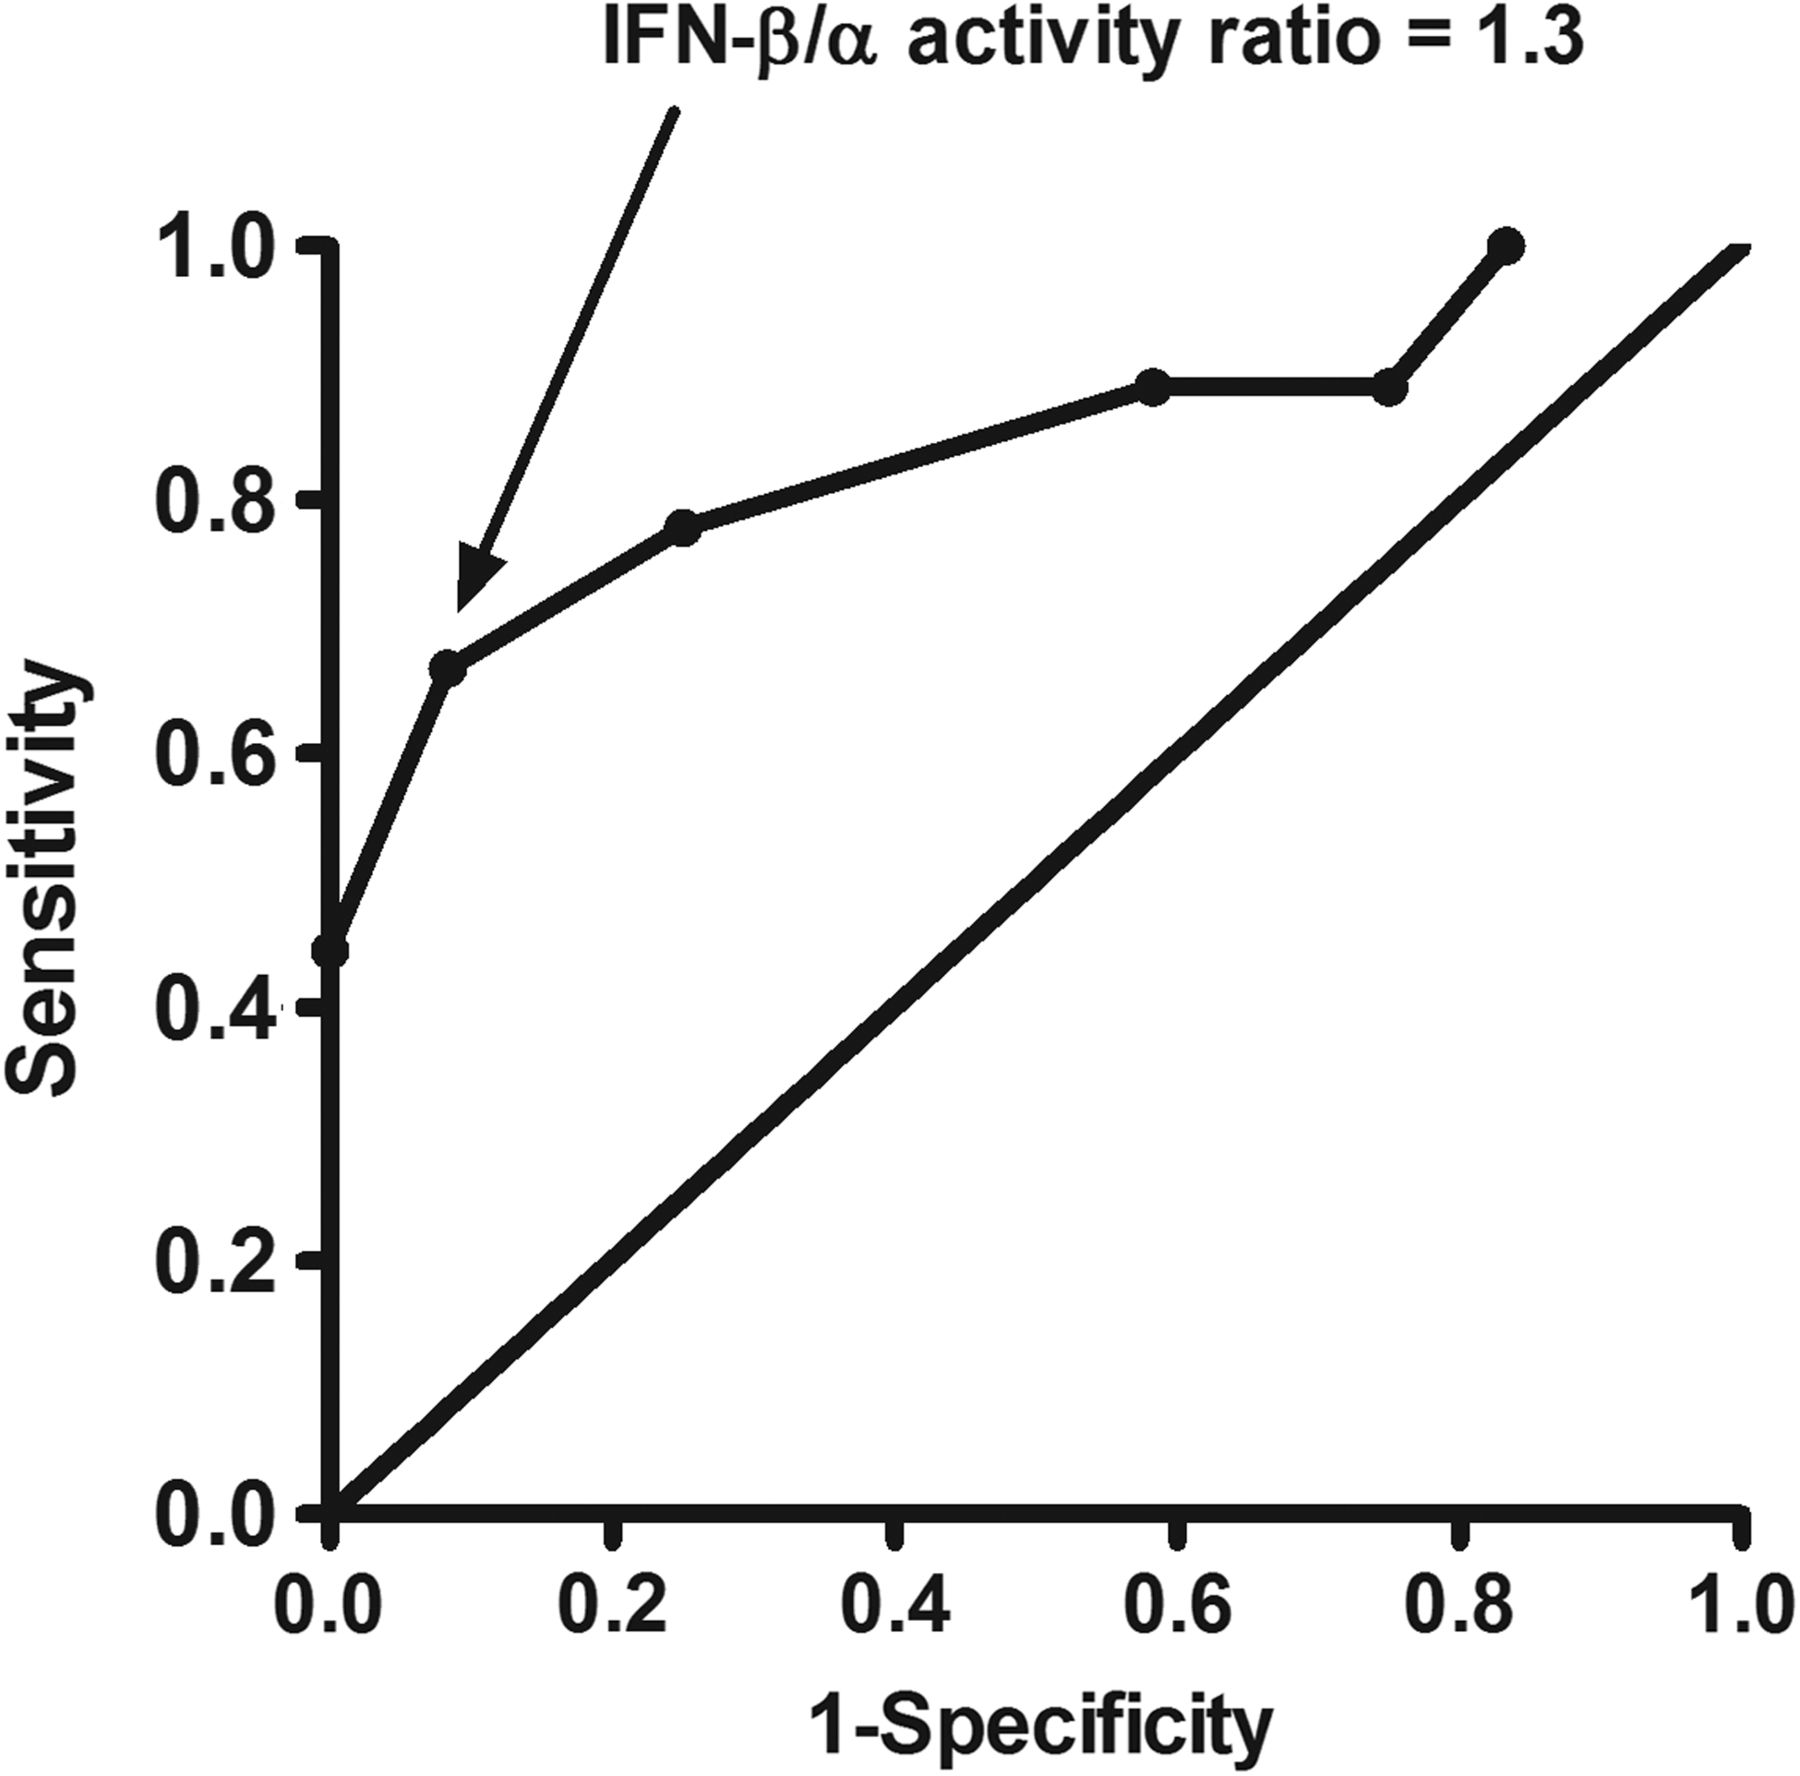
In the test cohort, we tested type I IFN activity in pretreatment sera from 32 subjects who either had a good response or non-response to TNF-α inhibition at 14 weeks by EULAR criteria. We observed a non-significant trend towards higher total type I IFN activity in pretreatment sera from non-responders compared with good responders (p=0.23). When IFN-β activity was examined separately, we found that higher pretreatment IFN-β activity was associated with lack of response to TNF-α inhibition (see online supplementary figure S1). There was a trend towards lower IFN-α activity in non-responders, and the IFN-β/α activity ratio between the non-responders and good responders provided the strongest p value for a difference between groups (see online supplementary figure S1). In correlation analyses, higher pretreatment IFN-β/α activity ratio was strongly correlated with higher DAS score at 14 weeks (Spearman's r=0.56, p=0.010, figure 1). Total type I IFN, IFN-β and IFN-α activity were not significantly correlated with DAS score at 14 weeks (p>0.05 for each). In regression models, anti-CCP antibody titre and type of TNF-α inhibitor did not influence this relationship. Based on these data, we chose pretreatment IFN-β/α activity ratio as a predictor of response to anti-TNF-α therapy, and considered all TNF-α inhibitors together. Also, 12 of 32 subjects had very low total type I IFN activity; thus, the IFN-β/α activity ratio was not determined for these subjects. A receiver–operator curve showed a strong discriminatory potential for pretreatment IFN-β/α activity ratio, and an optimum sensitivity/specificity point at an IFN-β/α activity ratio of 1.3 (sensitivity 67%, specificity 92%, figure 2). In categorical analysis, an IFN-β/α activity ratio of >1.3 in the pretreatment sera was associated with lack of response by EULAR criteria at 14 weeks (p=0.010).

Non-parametric correlation of pretreatment serum interferon (IFN)-β/α activity ratio and disease activity score 28 (DAS28) score at 14 weeks. r and p value by Spearman's rank order correlation test. Pre-TNFi, prior to tumour necrosis factor (TNF)-α inhibition.

Receiver–operator curve for pretreatment interferon (IFN)-β/α activity ratio predicting response by European League Against Rheumatism criteria at 14 weeks. Point corresponding to an IFN-β/α activity ratio of 1.3 is indicated by the arrow.
High IFN-β/α confirmed as a predictor in the validation set
We tested the pretreatment IFN-β/α activity ratio cut-off point of 1.3 in an independent cohort from the TETRAD consortium, consisting of pretreatment sera from 92 subjects with good, moderate and non-response to TNF-α inhibition at 12 weeks by EULAR criteria. IFN-β/α activity ratio could not be determined for 13 of the 92 subjects (14%), fewer than the test cohort. In the validation cohort, we found that subjects with an IFN-β/α activity ratio >1.3 were significantly more likely to have non-response to TNF-α inhibition by EULAR criteria at 12 weeks compared with good response (p=0.018, OR 6.67, 95% CI 1.37 to 32.55, table 2). IFN-β/α activity ratio >1.3 was a significant predictor of non-response compared with either moderate or good response (p=0.028, OR 2.80, 95% CI 1.14 to 6.88, table 2) and the test had 77% specificity and 45% sensitivity for prediction of non-response compared with moderate or good response to TNF-α inhibition. In meta-analysis, the proportion of subjects with a pretreatment IFN-β/α activity ratio >1.3 was significantly greater in non-responders compared with moderate or good responders (weighted Z-score meta-analysis p value=0.005). When baseline quantitative IFN-β/α activity ratios were compared between non-responders and good or moderate responders in the combined test and validation sets, the difference observed was greater than that observed with IFN-β alone (figure 3).
Categorical interferon (IFN)-β/α activity ratio by European League Against Rheumatism (EULAR) response criteria in the validation set

Serum type I interferon (IFN) activity prior to tumour necrosis factor (TNF)-α inhibitor therapy in the combined test and validation cohort. (A) Pretreatment IFN-β activity in subjects who had a good or moderate response to TNF-α inhibition at 12–14 weeks compared with those who had non-response by European League Against Rheumatism criteria. (B) IFN-β/α activity ratio in pretreatment sera in good or moderate responders and non-responders. Line indicates the median, error bars show the IQR, p value by Mann–Whitney U test.
Follow-up sera
Type I IFN activity in follow-up sera was also examined. In sera obtained at 4–6 weeks after starting anti-TNF-α therapy, there was a decrease in total type I IFN activity, IFN-β activity and IFN-β/α activity ratio (all with p value between 0.015 and 0.030, figure 4A–C), in subjects who would later have no response at 12–14 weeks. A decrease in total type I IFN activity was observed at 4–6 weeks in the subjects who would later have a good or moderate response at 12–14 weeks (p=0.022), but no significant differences were observed in IFN-β activity or IFN-β/α activity ratio in the responders when comparing baseline sera to 4–6-week sera (figure 4D–F).

Serum type I interferon (IFN) activity measurements prior to and 4–6 weeks after starting tumour necrosis factor (TNF)-α inhibitor therapy. (A–C) Type I IFN, IFN-β and IFN-β/α, respectively, in patients with non-response. (D–F) Type I IFN, IFN-β and IFN-β/α, respectively, in patients with good or moderate response. Line indicates the median, error bars show the IQR, p value by Mann–Whitney U test.
Discussion
Our study adds to a growing body of literature that suggests that baseline type I IFN in serum may predict response to biological therapeutics in RA. Raterman and colleagues16 found a number of type I IFN response genes (IRGs) in patients with RA that were associated with treatment response to rituximab. Others also found that a low IFN signature as defined by expression of three IRGs in peripheral blood mononuclear cells (PBMCs) in patients with RA was similarly associated with a better response to rituximab.27 More recently, Sanayama et al28 identified differential expression of four genes in PBMCs of patients with RA that were associated with treatment response to tocilizumab. Of these, three were IRGs and increased expression was associated with favourable therapeutic response. Thus, increased expression of IRGs at baseline was associated with a favourable response to anti-IL-6 receptor therapy, and low pretreatment IRG expression was associated with a favourable response to anti-CD20 therapy.
Previous studies have also examined the type I IFN pathway in the context of TNF-α inhibition. A recent study measured IRG activity in peripheral blood following TNF-α blockade with infliximab varied between patients with RA, and the changes in IRG activity during treatment were correlated with treatment response.29 Another study determined that a pretreatment neutrophil IFN gene expression signature correlated with a good response to TNF-α inhibition.30 IFN signatures in peripheral blood cells should reflect type I IFN in serum. In our study, we did not observe significant differences in pretreatment total type I IFN activity between responders and non-responders in either the test or validation cohort. This is consistent with a recent modular gene expression study of anti-TNF-α response, in which many modular changes were observed, but the IFN gene expression module was not informative for response either at baseline or after treatment.31
In contrast, we found that IFN-β/α activity ratio was the most predictive marker of response to TNF-α inhibition among the type I IFN activity measurements assessed, suggesting that the subtype of type I IFN is important, and that total type I IFN activity and IFN signatures may not be as efficient for predicting therapeutic response. After 4–6 weeks of anti-TNF-α treatment, there was a shift towards lower IFN-β activity and lower IFN-β/α activity ratio in the subjects that were EULAR non-responders at 12–14 weeks, and this was not observed in the good responders. This would suggest that the IFN-β/α activity ratio abnormality that predicts response to anti-TNF-α normalises somewhat during treatment with anti-TNF-α, and that measurements taken before the treatment is started would be more helpful than those taken while a patient is already taking a TNF-α inhibitor.
A previous study of IFN-β/α activity ratio and response to TNF-α inhibition in Hispanic-American patients with RA reported an association,15 although in a different direction than our predominantly European ancestry (84%) population. This may represent a population-specific difference. Both studies support the potential utility of serum type I IFN activity in predicting outcome of TNF-α inhibition in RA, and our non-European sample size was not large enough to make comment on this group. The cellular immunology that leads to different ratios of type I IFNs in circulation is not clear. While IFN-α has been strongly implicated as a causal factor in lupus and some other human autoimmune diseases,18 ,32–35 IFN-β may have more immunosuppressive or immunoregulatory functions.36 ,37 Cross-regulation of type I IFN by TNF-α could partially underlie the relationship we describe,3 ,4 although it is not clear how cross-regulation of type I IFN by TNF-α would lead to the type I IFN subtype differences we observed. The differences in type I IFN subtypes could potentially result from differences in upstream activators of the innate immune system and IFN-producing cells. For example, triggering cells via Toll-like receptor 4 would be expected to produce more IFN-β than IFN-α, while activating cells through the endosomal Toll-like receptors 7, 8 and 9 would be expected to produce more IFN-α than IFN-β.38 ,39
Testing in an additional independent larger cohort of patients with RA would be ideal to further validate these findings. It should also be noted that while an IFN ratio can be calculated in a majority of patients some patients have no detectable type I IFN and a ratio cannot be calculated. It seems likely that combing the IFN marker with other clinical and laboratory data associated with treatment response could improve person-level prediction of future treatment response.40 ,41 Availability of a prognostic pretreatment measurement that could predict response to TNF inhibition, which would allow for more rapid and efficient control of disease and more personalised treatment, would represent a major step forward in RA. It is also possible that a similar test could be useful in other conditions in which TNF-α inhibitors are often used, such as psoriatic arthritis and spondyloarthropathy.
References
Supplementary materials
Supplementary Data
This web only file has been produced by the BMJ Publishing Group from an electronic file supplied by the author(s) and has not been edited for content.
- Data supplement 1 - Online figures
Footnotes
Handling editor Tore K Kvien
Contributors TWM and PV are co-first authors. TWM, PKG, SLB and TBN designed and conceived the study. TWM, PV, JMD, MAJ and BSC performed the experiments. All authors provided and analysed and interpreted data, and assisted with the preparation of the manuscript, and approve of the manuscript submission. Supported by grants from TWM: Mayo Clinic Career Development Award in Rheumatoid Arthritis Research; TBN: NIH (AR060861, AR057781, AI071651), Rheumatology Research Foundation, CureJM Foundation, the Mayo Clinic Foundation, and the Lupus Foundation of Minnesota.
Competing interests TBN: research grants from Janssen, Inc, and EMD Serono, Inc.
Patient consent Obtained.
Ethics approval Institutional Review Boards at the respective institutions involved in the study.
Provenance and peer review Not commissioned; externally peer reviewed.
Data sharing statement Samples were drawn from the ABCoN and TETRAD registries, which both have policies and procedures in place for investigators to obtain samples and data. The IFN data generated in the studies outlined in this manuscript were returned back to these registries and can be accessed using these procedures by other investigators.