Article Text

Abstract
Objectives To evaluate and compare the clinical efficacy of three biomarkers for interferon (IFN) activity (measured directly and indirectly) and six traditional biomarkers in indicating current and prospective disease activity (DA) in systemic lupus erythematosus (SLE).
Methods IFNα (dissociation-enhanced lanthanide fluorescent immunoassay), IFNγ-inducible protein 10 (IP-10) (ELISA) and sialic acid-binding Ig-like lectin 1 (SIGLEC-1) (flow cytometry) were measured in 79 accurately characterised patients with lupus and compared with serum titres of Anti-dsDNA (ELISA and radioimmunoassay), Anti-dsDNA-NcX ELISA, Anti-Nuc ELISA, and complement C3 and C4. DA was evaluated using the British Isles Lupus Assessment Group 2004 Index (BILAG-2004) and a modified SLE Disease Activity Index-2000 (mSLEDAI-2K). In addition, 31 clinically quiescent patients were monitored for flares over the course of 180 days.
Results Increased levels of IFNα, IP-10 and SIGLEC-1 were found in 32%, 50% and 86%, respectively, of 66 patients with active SLE. IFNα (r=0.45; p<0.0001) and SIGLEC-1 (r=0.54; p<0.0001) correlated better with BILAG-2004 than did IP-10 (r=0.38; p=0.0002), Farr assay (r=0.40; p=0.0001), Anti-dsDNA-NcX ELISA (r=0.28; p=0.0061), Anti-dsDNA ELISA (r=0.31; p=0.0025), Anti-Nuc ELISA (r=0.25; p=0.0121), C3 (r=−0.43; p<0.0001) and C4 (r=−0.33; p=0.0013). Predictors of SLE flares were disease duration ≤92 months, mild clinical activity (in contrast with no activity), complement C3≤89 mg/dl and IFNα≥20 pg/ml, while only lymphocyte count and age were independent predictors in multivariate analysis.
Conclusions IFNα, IP-10 and SIGLEC-1 emerged as beneficial biomarkers of DA in patients with SLE. Therefore the implementation of IFN biomarkers in standard lupus diagnostics should be reappraised, especially in view of emerging anti-IFN-directed therapies.
- Autoantibodies
- Chemokines
- Cytokines
- Systemic Lupus Erythematosus
Statistics from Altmetric.com
Introduction
Systemic lupus erythematosus (SLE) is a chronic multiorgan autoimmune disease affecting predominantly women of childbearing age.1 It is characterised by recurrent exacerbations of disease activity (DA) leading to reduced quality of life, cumulative damage and increased mortality. Prediction of flares may be possible based on variables such as age, disease duration, blood concentration of hydroxychloroquine (HCQ), increased antibodies against double-stranded DNA (dsDNA) and low complement C3 levels.2 ,3 Nevertheless, flares do occur, and then expert knowledge, disease indices and biomarkers are essential to assess and monitor DA.
Anti-dsDNA antibodies and complement factors have been used as indicators of lupus activity for over 50 years,4 ,5 and efforts have been made to improve their performance. Erythrocyte-bound C3 and C4 reflect DA cross-sectionally and longitudinally nearly as well as serum levels of complement C3 and C4.6 We and others have found that antibodies against nucleosomes7 ,8 and dsDNA-complexed nucleosomes (Anti-dsDNA-NcX ELISA) may be more useful for monitoring DA than traditional anti-dsDNA antibodies.9
Over the past decade, IFNα has been identified as the key cytokine predisposing to and driving SLE pathology, and it is thus a commonly studied target molecule in therapeutic interventions.10 ,11 It is assumed that IFNα can serve as both a biomarker of DA and a companion diagnostic test for IFN inhibitors.12 A sensitive and reliable detection method for IFNα is indispensable, but a standard has yet to be established.
Currently, IFNα is generally detected either directly with antibodies or indirectly with IFN-induced transcripts (IFITs) or proteins. Whereas the specificity of ELISAs that detect IFNα has been questioned,13 indirect assessment of IFN activity has been reported to be much more sensitive.14–16 It should be noted that non-specific induction of IFITs and proteins by other IFNs17 and cytokines18 may contribute to this observation.
The first researchers to directly detect IFNα with antibodies were Kim et al, who found IFNα in 27 of 30 patients with SLE and showed its correlation with DA by radioimmunoassay (RIA) in 1987.19 Bengtsson et al confirmed these results using a dissociation-enhanced lanthanide fluorescent immunoassay (DELFIA) and also demonstrated that IFNα rises during flares.20
Indirect measurement of IFNα by assessment of IFITs in SLE has been broadly recognised since 2003, when microarray analysis revealed a prominent IFN signature in blood cells of children and adults with SLE.16 ,21 Baechler et al detected an IFN signature in peripheral blood mononuclear cells in about half of their SLE cohort using microarrays, while only 4% of the same 48 clinically quiescent patients had IFNα levels detectable using ELISA.16 These and other results14–16 led to the conclusion that indirect measurement of IFNα is more sensitive than direct measurement. Consequently, IFIT-based IFN scores that cross-sectionally correlated with DA were established,22 but these ultimately failed to show a longitudinal correlation.23 ,24 Taking a different approach, Hua et al incubated a cell line of defined density with lupus plasma before measurement of IFITs, thereby creating a functional assay of IFNα activity,25 which has been applied to many cohorts including large ones.26 ,27
Indirect measurements at the protein level include IFN-induced cell-secreted chemokines such as IFNγ-inducible protein 10 (IP-10) and cell surface expression of Fcγ receptor RI (CD64) or sialic acid-binding Ig-like lectin 1 (SIGLEC-1, sialoadhesin). It is notable that serum IP-10 correlated better with DA cross-sectionally and longitudinally than traditional biomarkers in two large independent SLE studies.28 ,29 Interestingly, Kong et al detected raised serum IP-10 levels in 35% of their 464 patients with SLE, whereas only 8% were IFNα positive by ELISA.28 As determined by flow cytometry, CD64 expression on monocytes also correlated with SLE Disease Activity Index (SLEDAI) in 108 patients with SLE.30 By combining cell sorting and microarray analysis, we previously identified SIGLEC-1 as a transcript encoding a surface protein on monocytes that is most strongly upregulated by IFN in SLE.31 This monocyte-restricted surface protein was further validated at the protein level by flow cytometry. SIGLEC-1 expression correlated with SLEDAI and indicated the success of IFN inhibitors such as glucocorticoids and sifalimumab, a monoclonal antibody against IFNα.31 ,32 Moreover, Yao et al described SIGLEC-1 as one of 21 potential pharmacodynamic markers for emerging anti-IFNα antibody trials.33
Based on these heterogeneous data sources and detection systems for IFNα, we designed the present study to compare three biomarkers of IFN system activation—IFNα, IP-10 and SIGLEC-1—with standard biomarkers with respect to their capacity to detect and predict lupus activity.
Patients and methods
Study participants
In all, 79 patients who fulfilled at least four of the 11 criteria for SLE of the American College of Rheumatology (ACR) were recruited from the Charité Universitätsmedizin Berlin Department of Rheumatology and Clinical Immunology from January 2009 to January 2011.34 Exclusion criteria were prednisolone dose >20 mg/day or increase in prednisolone dose within the previous 4 weeks because of IFN suppressive effects. To ensure exact assessment of DA, patients receiving dialysis therapy (n=1) or with psychiatric symptoms (n=1) or infections (n=7) were excluded.
DA was calculated using the modified SLEDAI 2000 (mSLEDAI-2K),35 which lacks items for anti-dsDNA antibody and complement components, and the British Isles Lupus Assessment Group 2004 Index (BILAG-2004).36 BILAG-2004 is an index where DA in eight systems is classified into five categories assigned a numerical score (A=12, B=5, C=1, D=0, E=0); the individual scores are summed yielding an overall DA score.37
Healthy controls consisted of 27 blood donors with a similar age and sex distribution to the patients with SLE; none were taking any medication or had signs of infection within the previous 2 weeks. Patients and healthy controls are characterised in table 1.
Characteristics of patients with SLE and healthy controls
In order to identify predictive variables for SLE flares, 31 of all 79 patients with no or mild SLE activity were monitored for 180 days. BILAG-2004 was assessed at 3 and 6 months after blood withdrawal. A flare was defined as a new BILAG A or B score.38
Written informed consent was obtained from all participants. The ethics committee of the Charité Universitätsmedizin Berlin approved the study.
Flow cytometric detection of SIGLEC-1 on monocytes
Peripheral venous blood samples (2.5 ml) from each subject were collected in Vacutainer EDTA tubes (Becton Dickinson, Heidelberg, Germany). For flow cytometric analysis, 90 µl whole blood samples were taken and stained with anti-CD14-FITC (Miltenyi Biotec, Bergisch Gladbach, Germany) and anti-CD169 RPE (clone 7-329) (AbD Serotec, Oxford, UK) for 15 min on ice. As a control, the same staining procedure was performed but omitting the anti-CD169 antibody. After staining, erythrocytes were lysed for 15 min on ice using FACS Lysing Solution (Becton Dickinson). The cells were then washed twice using phosphate-buffered saline containing 2% bovine serum albumin and 5 mmol/l EDTA, fixed using Cellfix (Becton Dickinson), and analysed within 24 h using an LSR II cytometer (Becton Dickinson). Data were analysed with DIVA software 6.0 (Becton Dickinson). Relative median fluorescence intensity (rMFI) values for SIGLEC-1 expression were calculated as the ratio of SIGLEC-1 expression on CD14-positive monocytes to the intensity of negative controls.
Definition of thresholds for SIGLEC-1 expression
Receiver operating characteristics (ROC) curve analysis of SIGLEC-1 fluorescence signals from healthy donors (n=27) and patients with SLE (n=79) revealed a specificity of 100% above an rMFI of 3.70. Thus a relative SIGLEC-1 expression value above 3.70 was considered to indicate an activated type I IFN system.
Determination of serum biomarkers
IP-10 levels were analysed using a Quantikine ELISA (R&D Systems, Minneapolis, Minnesota, USA) based on anti-human IP-10 antibodies. Samples were processed according to the manufacturer's instructions.
Serum IFNα levels were analysed by Miltenyi Biotec using a time-resolved, fluorimetry-based dissociation-enhanced lanthanide fluorescent non-commercial immunoassay with a detection limit of 35 pg/ml.
All autoantibodies were determined by Euroimmun, Lübeck, Germany with commercially available tests (Anti-dsDNA ELISA, Farr assay, Anti-dsDNA-NcX ELISA, Anti-Nuc ELISA).
IP-10, Anti-dsDNA RIA, Anti-dsDNA ELISA, Anti-dsDNA-NcX ELISA, Anti-Nuc ELISA, C3 and C4 thresholds were defined as recommended by the respective manufacturers. Stored (−80°C) sera were thawed and vortex-mixed. All measurements, except for C3 and C4, were performed in duplicate.
Statistical analysis
Statistical analysis was performed with GraphPad Prism 5.0 (GraphPad, La Jolla, California, USA) and IBM SPSS Statistics V.19.0. The Spearman rank test was used to correlate biomarkers with metric variables. The Mann−Whitney U test was used to reveal differences in biomarkers between different BILAG-2004 categories. For prediction of flares, ROC curves were used to identify informative thresholds of variables. These thresholds were then reassessed by comparing the composed groups in Mantel−Cox tests, which included the additional information on duration until flare. Furthermore, in a multivariate Cox survival analysis, all variables individually predictive of flares were tested in a combined model. Model robustness was rechecked by confirming model selection in both a stepwise forward and stepwise backward manner.
p Values less than 0.05 were considered significant. As this pilot study was considered to be a data-mining approach, significance level adjustment for multiple testing was only performed when identifying biomarkers associated with general clinical items in figure 1.

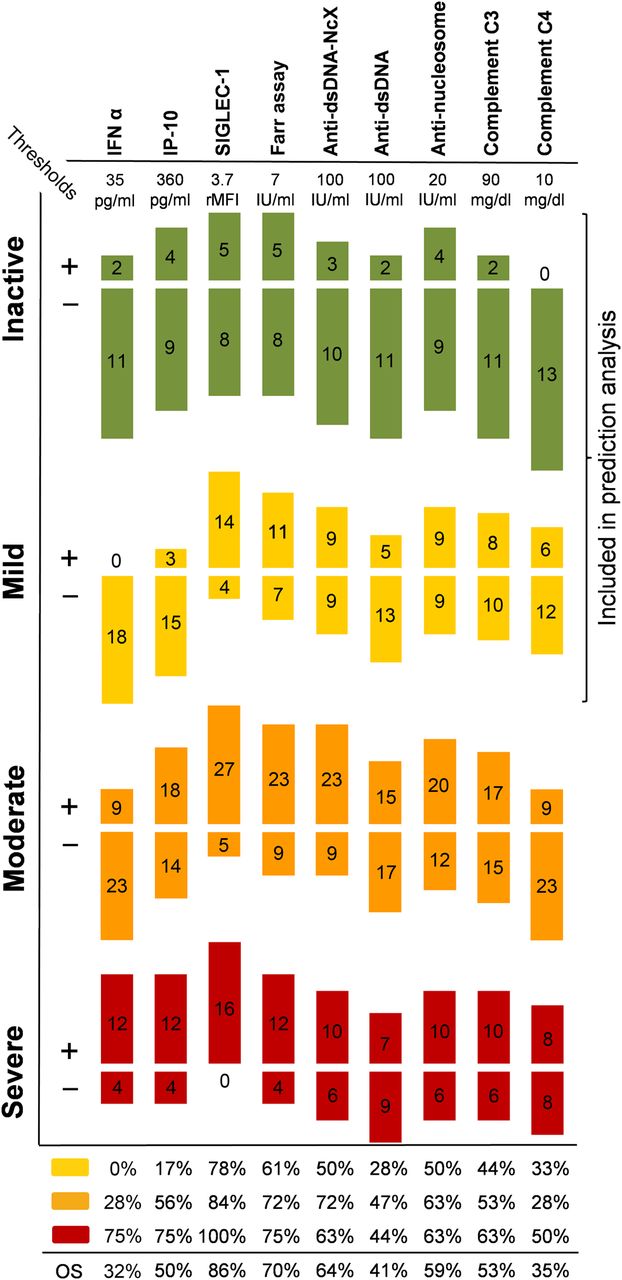
Sensitivities of nine biomarkers dependent from disease activity (DA). Numbers of positive and negative test results for each biomarker according to British Isles Lupus Assessment Group 2004 Index (BILAG-2004) DA level (inactive, no ‘A’, ‘B’ or ‘C’; mild, only ‘C’; moderate, at least one ‘B’ and no ‘A’; severely active, at least one ‘A’) in 79 patients with systemic lupus erythematosus. Sensitivities of each biomarker for mild, moderate and severe disease and overall sensitivity are listed in table form below.
Results
Comparison of biomarker sensitivities in detecting DA
Biomarker sensitivities were assessed by comparing the number of positive and negative test results for each biomarker in 13 patients with inactive disease, 18 with mild DA, 32 with moderate DA, and 16 with severe DA according to BILAG-2004, with subsequent calculation of overall sensitivity (figure 1).
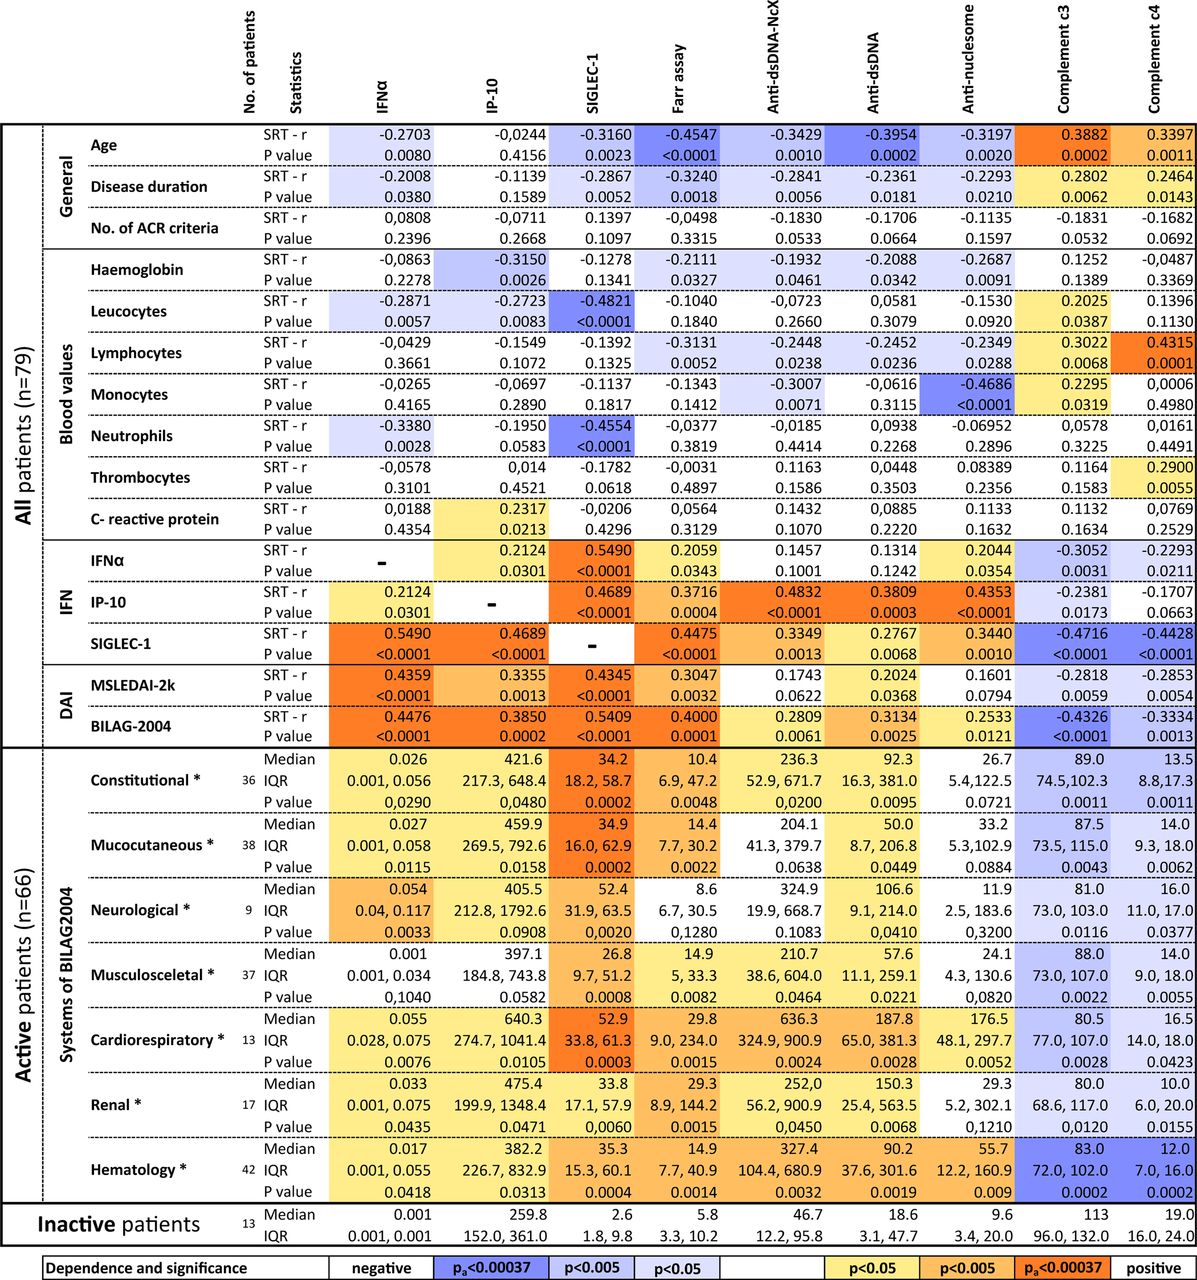
Laboratory and clinical significance of biomarkers. All nine biomarkers were investigated with regard to their statistical significance to general clinical items, whole blood values, their relationship to IFN biomarkers, overall disease activity and their manifestations in the BILAG-2004 systems. In the first category (‘All patients’), SRT was used to identify correlations. In the second category (‘Active patients’), levels of biomarkers in one affected system (A, B or C score) of the BILAG-2004 were compared with those in inactive patients using the Mann Whitney U test. Gastrointestinal and ophthalmic systems (normally assessed in BILAG) were excluded because of the low number of patients presenting with these manifestations. All 13 patients with inactive disease showed no clinical activity (BILAG = 0) (figure 2). The brightness of the colours indicates statistical significance levels, with orange values indicating positive and blue values negative correlations with respect to particular biomarker levels. The darkest colours indicate Bonferroni-adjusted significance level (pa = 0.00037) for the 15×9 parallel tests in all patients. *Mann Whitney U test. ACR, American College of Rheumatology; BILAG-2004, British Isles Lupus Assessment Group 2004 Index; DAI, disease activity index; IFN, interferon; IQR, IQR of the 25th and 75th centile; mSLEDAI-2K, modified SLE Disease Activity Index 2000; SRT, Spearman rank test.
SIGLEC-1 had the highest overall sensitivity (86%) for active disease, followed by the Farr assay (70%) and Anti-dsDNA-NcX ELISA (64%). SIGLEC-1 detected all 16 patients with severe DA (100%), and IFNα, IP-10 and Farr assays identified 12 out of 16 patients (75%).
SIGLEC-1 failed to detect five cases of moderate and four of mild DA in 66 patients with clinically active SLE. Of these nine SIGLEC-1-negative patients, five had raised anti-dsDNA levels as determined by Anti-dsDNA ELISA (n=1), Farr assay (n=2) and Anti-dsDNA-NcX ELISA (n=2). Two mild and two moderate cases were not detected by any of the investigated biomarkers.
Many of the biomarkers were abnormal even in patients with inactive disease. As the clinical relevance of this discrepancy to DA was unclear, we monitored all patients with inactive and mild disease for flares for 180 days and analysed the data to identify potential predictive abilities of these biomarkers.
Clinical and laboratory significance of biomarkers
To reveal further clinical associations and to elucidate similarities and differences, all nine biomarkers were statistically investigated with respect to variables extracted from medical records, including disease duration, number of ACR criteria, laboratory variables, DA indices, clinical manifestations and SLE medication (figure 2). Except for IP-10, all biomarkers correlated significantly with age and disease duration, indicating that young patients with short disease duration had the highest immunological activity. This observation was further supported by a negative correlation of age with DA (r=−0.22; p=0.02; Spearman rank test).
Regarding standard laboratory variables, low haemoglobin correlated with high IP-10 and high autoantibody titres. Lymphocyte counts correlated negatively with autoantibody and complement levels, but not with IFNα, IP-10 or SIGLEC-1. Remarkably, absolute neutrophil counts exclusively correlated negatively with IFNα and SIGLEC-1.
Correlation analysis of overall DA, as measured by BILAG-2004 and mSLEDAI-2K, revealed that IFNα and its response proteins reflect the DA in a highly significant manner and, in the case of IFNα and SIGLEC-1, even better than all other biomarkers studied (figure 2 and online supplementary figure S1). To further decipher specific biomarker associations with disease manifestations, biomarker levels for each active system (BILAG A, B or C score) were compared with those in 13 patients with inactive systems (BILAG D and E scores) using the Mann−Whitney test. Gastrointestinal and ophthalmic systems, which are normally evaluated in BILAG, were excluded because of the low number of patients presenting with these manifestations.
Four biomarkers (SIGLEC-1, Anti-dsDNA ELISA, C3 and C4) were significantly associated with each BILAG system studied. Surprisingly, Anti-Nuc ELISA was only associated with the haematological and cardiorespiratory systems, but not with the renal system. Notably, IFNα, IP-10 and SIGLEC-1 were significantly associated with neurological manifestations.
Prediction of flares
Some patients with inactive disease had abnormal biomarker levels (figure 1). Therefore 13 patients with inactive disease and 18 with mild disease were monitored to investigate the potential prognostic ability of the nine biomarkers. All other laboratory and clinical variables such as age and disease duration were also included so as not to miss any simple indicators and to possibly define reference points for the nine biomarkers.
During follow-up of 180 days, 10 of 31 patients developed a flare as defined by a new BILAG A or B score.38
Since biomarker levels may relate to the probability of flares, ROC curves were used to define individual predictive thresholds for all variables (see online supplementary table S1). Three laboratory and three clinical variables presented areas under the curve with prognostic abilities (p<0.1). Confirming our approach using separate thresholds for prediction of flares, five variables deviated from their standard threshold while only the predictive threshold of complement C3 was equal to the standard threshold. On the basis of determined predictive cut-offs, groups were plotted in Kaplan−Meier curves, and p values were calculated using the Mantel−Cox test, which also takes time-to-flare into account (figure 3).

Prediction of systemic lupus erythematosus flares. Kaplan−Meier curves of the three clinical and three laboratory variables capable of predicting a new British Isles Lupus Assessment Group 2004 Index (BILAG) A or B score are plotted. Groups were defined by individual cut-offs obtained from receiver operating characteristics curves. The given p values were calculated by Mantel−Cox test, which also takes time-to-flare into account. Lymphocyte count and age are given in bold, because these variables were independent predictive variables in multivariate analysis. Inactive patients were defined as having no BILAG A, B or C scores, while mild active patients had one or more BILAG C scores. The haematology system of BILAG-2004 were not accounted for to avoid bias to lymphocyte counts.
In a subsequent multivariate survival analysis of all individually prognostic variables, only lymphocyte count (p=0.004, OR=1.24 per 0.1 unit/nl decrease, 95% CI 1.07 to 1.43) and age (p=0.026, OR=1.60 per 5 years decrease, 95% CI 1.05 to 2.41) were selected by the model as independent predictive variables for flares, but none of the investigated biomarkers were (data not shown).
Discussion
This study was designed to compare IFNα and its induced response proteins, IP-10 and SIGLEC-1, with six traditional biomarkers with respect to their ability to indicate current and prospective DA in SLE. We also addressed the issue of whether indirect detection of type I IFN with IP-10 in ELISA or SIGLEC-1 in flow cytometry is superior to direct measurement of IFNα in a DELFIA. However, only 32% of the patients with active SLE were positive for IFNα, while 50% and 86% were positive for IP-10 and SIGLEC-1, respectively. These results are in line with previous data.14–16 ,28 The great sensitivity of SIGLEC-1 can be explained by (1) it is the most IFN-induced surface protein on SLE monocytes,31 (2) monocytes and granulocytes are highly sensitive biosensors of IFNα signalling,39 and (3) its possible non-specific induction by other cytokines. As we studied neither the frequently used bioassay of Hua et al25 nor IFITs assessed by PCR,22 it is not possible to say whether these tests would be more or less sensitive for indicating IFN activity than the three studied here.
Type I IFN levels vary depending on ancestry,25 ,26 age,27 activity22 and treatment,31 and therefore the sensitivity results for IFNα, IP-10 and SIGLEC-1 cannot be compared with those from other studies. More, larger and longitudinal head-to-head comparisons of type I IFN biomarkers12 ,25 ,30 are still needed to establish a valid detection standard.
SIGLEC-1 expression and IFNα levels correlated better with DA than any other variable investigated, including IP-10 and anti-dsDNA antibodies in the Farr assay. This is in accordance with earlier studies suggesting that surrogate markers for type I IFN better indicate DA than traditional biomarkers.28 ,29
While investigating associations of our set of biomarkers with laboratory variables, we found that leucocyte and neutrophil counts correlated exclusively and negatively with raised IFNα and SIGLEC-1. These results are in accordance with previous reports.20 ,24 ,29 IFNα influences the cellular composition of the blood compartment by inducing leucocyte adhesion and emigration40 and by priming neutrophils for a special form of cell death (NETosis), which is also a potent IFN inducer.41
Moreover, the negative correlation of IFNα with leucocyte count is remarkably consistent with the missing longitudinal correlation of the IFN gene signature in whole blood described in two recent studies.23 ,24 Since the magnitude of a whole blood IFN signature is the sum of all IFITs expressed by all blood cells, composition and absolute leucocyte count are critical disruptive factors to consider when assessing the IFN signature over time. Furthermore, the quantitative and qualitative compositions of SLE leucocytes are also influenced by DA35 and by SLE medication (eg, cyclophosphamide or glucocorticoids). All these disruptive factors may be responsible for the discrepant finding that the whole blood IFN signature did not correlate over time,23 ,24 whereas IFNα20 ,42 and its response protein IP-10 correlated well.28 ,29
Identification of variables or biomarkers that can predict lupus flares is an important diagnostic issue enabling physicians to optimise, for example, glucocorticoid use, which is a major reason for damage occurring in patients with SLE. In this small prediction study, IFNα levels showed a trend to be prognostic for SLE flares. However, this finding was dependent on age in multivariate analysis, which is consistent with an age-related pattern of IFN activity in SLE.27 Despite the low number of patients in this prediction study, the results obtained are similar to those of Swaak et al, who showed that young patients with short disease duration were prone to further exacerbations.2 Furthermore, Costedoat-Chalumeau et al reported low complement C3, raised anti-dsDNA antibodies and low HCQ concentrations to be predictive for flares of SLE.3 Interestingly, low HCQ concentrations may be linked to increased IFNα levels because HCQ decreases the production of IFNα by inhibiting Toll-like receptors in plasmacytoid dendritic cells.43
The data also have important implications with regard to novel IFNα inhibitors.11 First, since we observed a wide dynamic range in detecting IP-10 and SIGLEC-1 expression, precise monitoring of the course of the disease and the responsiveness to IFN inhibition is ensured. Second, we and others27 found higher activation levels of the IFN system in young patients with early disease than in older patients. Therefore, we speculate that higher dosages or shorter intervals of treatment are needed to adequately inactivate the IFN system over time in young patients. Conversely, older patients with long-term disease may need less intensive treatment, which could optimise the risk/benefit ratio of IFNα inhibitors. Finally, we demonstrated that IFNα itself is—depending on age—prognostic for flares. We thus hypothesise that treatment with monoclonal antibodies against IFNα will significantly reduce flare rates in patients with SLE.
In conclusion, we provide further evidence that IFN biomarkers can serve as reliable indicators of DA in SLE and recommend measurement of IP-10 and, especially, the highly sensitive SIGLEC-1 as companion diagnostic tests for emerging IFNα inhibitors.
References
Supplementary materials
Supplementary Data
This web only file has been produced by the BMJ Publishing Group from an electronic file supplied by the author(s) and has not been edited for content.
Files in this Data Supplement:
- Data supplement 1 - Online figure
- Data supplement 2 - Online table
Footnotes
-
Handling editor Tore K Kvien
-
TR, AG, FH and RB contributed equally to this work.
-
Contributors All authors were involved in drafting the article or revising it critically for important intellectual content, and all authors approved the final version to be published. Study conception and design were by RB, FH and AG. Data were acquired by TR, AG, CD, AD, TO, WS, HH. Analysis and critical interpretation of the data were performed by RB, TR, DH, AG, GRB, PE and FH.
-
Funding The work was supported by the European Union's Sixth Framework Programme (project AutoCure; LSHB-CT-2006-018861), the German Research Foundation (Collaborative Research Centre SFB650, TP12 and TP17), the IMI JU funded project BeTheCure (contract No 115142-29) and the Zukunftsfond Berlin (contract No 101399339).
-
Competing interests CD and WS are employed by Euroimmun, which provided test results for all included, commercially available autoantibodies (Anti-dsDNA ELISA, Anti-dsDNA RIA, Anti-dsDNA-NcX ELISA, Anti-Nuc ELISA). AD and TO are employed by Miltenyi Biotec, which provided test results for the non-commercial IFNα DELFIA. All other authors declare no competing interests.
-
Ethics approval Ethics committee of the Charité Universitätsmedizin Berlin.
-
Provenance and peer review Not commissioned; externally peer reviewed.