Article Text

Abstract
Objectives To evaluate the performance of individual biomarkers and a multi-biomarker disease activity (MBDA) score in the early rheumatoid arthritis (RA) patient population from the computer assisted management in early rheumatoid arthritis (CAMERA) study.
Methods Twenty biomarkers were measured in the CAMERA cohort, in which patients were treated with either intensive or conventional methotrexate-based treatment strategies. The MBDA score was calculated using the concentrations of 12 biomarkers (SAA, IL-6, TNF-RI, VEGF-A, MMP-1, YKL-40, MMP-3, EGF, VCAM-1, leptin, resistin and CRP) according to a previously trained algorithm. The performance of the scores was evaluated relative to clinical disease activity assessments. Change in MBDA score over time was assessed by paired Wilcoxon rank sum test. Logistic regression was used to evaluate the ability of disease activity measures to predict radiographic progression.
Results The MBDA score had a significant correlation with the disease activity score based on 28 joints-C reactive protein (DAS28-CRP) (r=0.72; p<0.001) and an area under the receiver operating characteristic curve for distinguishing remission/low from moderate/high disease activity of 0.86 (p<0.001) using a DAS28-CRP cut-off of 2.7. In multivariate analysis the MBDA score, but not CRP, was an independent predictor of disease activity measures. Additionally, mean (SD) MBDA score decreased from 53 (18) at baseline to 39 (16) at 6 months in response to study therapy (p<0.0001). Neither MBDA score nor clinical variables were predictive of radiographic progression.
Conclusions This multi-biomarker test performed well in the assessment of disease activity in RA patients in the CAMERA study. Upon further validation, this test could be used to complement currently available disease activity measures and improve patient care and outcomes.
This is an open-access article distributed under the terms of the Creative Commons Attribution Non-commercial License, which permits use, distribution, and reproduction in any medium, provided the original work is properly cited, the use is non commercial and is otherwise in compliance with the license. See: http://creativecommons.org/licenses/by-nc/3.0/ and http://creativecommons.org/licenses/by-nc/3.0/legalcode
Statistics from Altmetric.com
Introduction
Rheumatoid arthritis (RA) is a chronic inflammatory disease causing joint pain and destruction of joints, with resulting functional disability.1 When treating RA, minimising inflammation over a patient's lifetime is important to reduce functional disability and improve quality of life. This can be achieved by a concept, known as ‘tight control’.2,–,5 Current recommendations for treatment of RA advise measuring disease activity as frequently as monthly for patients with moderate-to-high disease activity, and less frequently, such as every 3–6 months, for patients with sustained low disease activity or remission.4
In the computer assisted management in early rheumatoid arthritis (CAMERA) study, subjects with early RA were randomly assigned to either an intensive or a conventional management strategy.6 ,7 The intensive strategy employed tight control, using more frequent follow-up and intensive therapy with methotrexate (MTX) according to a strict protocol as supported by a computerised decision program based on disease activity measurements with the aim of reaching remission. After 2 years of treatment, subjects in the intensive strategy group achieved remission more often, more rapidly and for a longer period of time than subjects in the conventional strategy group.7
Currently, measurements of disease activity in the clinic may include symptom assessment, joint counts, individual laboratory tests (eg, C reactive protein (CRP) and erythrocyte sedimentation rate (ESR)), or some combination of these in an index such as the disease activity score based on 28 joints (DAS28), Clinical Disease Activity Index, Simplified Disease Activity Index or Routine Assessment of Patient Index Data.8 ,9 The DAS28 and its variants (DAS, DAS28-CRP) are arguably the most extensively validated and accepted composite measures of RA disease activity. They combine three direct measurements of patient status (swollen joint count (SJC), tender joint count (TJC) and visual analogue scale general health (VAS-GH)) with one surrogate measure of inflammation (ESR or CRP).9 ,10 While the value of such measures has been rigorously demonstrated, they have limitations. Clinical assessments depend upon patient and/or physician judgments and are subject to intra-assessor and inter-assessor variability,11,–,13 while laboratory tests such as ESR and CRP are general measures of inflammation and can be in the normal range in approximately 40% of RA patients.14 ,15
In principle, biomarkers have the potential to provide objective measurements of the disease processes underlying RA. Numerous individual biomarkers have been shown to be associated with disease activity, and a recent study suggests that applying the tight control principle to biomarkers could improve outcomes.16,–,23 While no single biomarker has been found to capture the complex biology of the disease, a multi-biomarker score that captures the complex interactions and numerous biological pathways in RA could improve the assessment and tracking of disease activity. A multi-biomarker disease activity (MBDA) test has been developed that simultaneously measures serum levels of 12 proteins shown to be associated with RA disease activity in multiple studies and combines them into a score between 1 and 100.24 ,25
The purpose of the current study was to evaluate a broad set of serum biomarkers of RA disease activity and to evaluate the performance of the MBDA score as an instrument of disease activity in early RA patients from the CAMERA study.
Patient and methods
Patient cohort
Serum samples were studied from the CAMERA cohort, a 2-year, multicentre, prospective, open-label study.6 ,7 ,26 Patients with early RA who met the 1987 revised American College of Rheumatology criteria for RA27 and were 16 years of age or more were randomly assigned to either an intensive or conventional treatment strategy. Patients were initially treated with MTX alone. If MTX caused toxicity or was ineffective at the maximum dose of 30 mg/week, cyclosporine was added. Non-steroidal anti-inflammatory drugs were allowed. Oral glucocorticoids were not allowed but intra-articular were permitted if necessary. Every month (in the intensive treatment strategy) or every 3 months (conventional treatment strategy), the following clinical variables were assessed: SJC and TJC including 28 joints (SJC28 and TJC28, respectively), VAS pain (0–100 mm; 100=worst possible pain), VAS-GH (0–100 mm; 100=worst score), ESR (mm/h1st), CRP (mg/l) and morning stiffness (0–180 min). In the conventional strategy group, dose adjustments were made based on the opinion of the individual rheumatologist. In the intensive strategy group, dose adjustments were made based on changes in joint counts, ESR and the VAS-GH, as assessed using a computer decision program.7
The DAS28,9 an index for disease activity, was calculated based on TJC28, SJC28, ESR (or CRP) and VAS-GH.
Annual radiographs of hands and feet were evaluated for Sharp/van der Heijde score by two readers, blinded for treatment strategy and clinical information, but not sequence. The median yearly progression rate was calculated for the period 0–2 years.
Serum sampling and laboratory methods
A total of 120 serum samples from the CAMERA study were examined; of these, 72 were collected at baseline (39 from intensive strategy) and 48 were collected at 6 months (31 from intensive strategy). Although serum was only available for a subset of study subjects and these subjects had slightly lower baseline joint counts than the overall cohort, otherwise they were very representative and had similar clinical outcomes (supplementary table 1). Serum was collected in standard separator tubes according to the manufacturer's protocol, frozen as soon as possible after blood collection, and stored at −20°C until analysis.
Pearson correlations between individual biomarkers and clinical measures of disease activity
The concentrations of 20 serum protein biomarkers (calprotectin, C-C motif chemokine ligand 22, CRP, epidermal growth factor, inter-cellular adhesion molecule 1, interleukin (IL)-1 beta, IL-1 receptor antagonist, IL-6, IL-6 receptor, IL-8, leptin, matrix metallopeptidase 1, matrix metallopeptidase 3, pyridinoline, resistin, serum amyloid A, tumour necrosis factor receptor type I, vascular cell adhesion molecule 1, vascular endothelial growth factor A and cartilage glycoprotein 39 (YKL-40))were measured by customised immunoassays (Sector Imager 6000 (Meso Scale Discovery, Gaithersburg, Maryland, USA) or individual ELISA; supplementary table 2). The reagents used were designed to block interference from RF and other heterophilic antibodies.24
Agreement between classification of disease activity (low, moderate and high) according to the MBDA score and DAS28-CRP
MBDA score
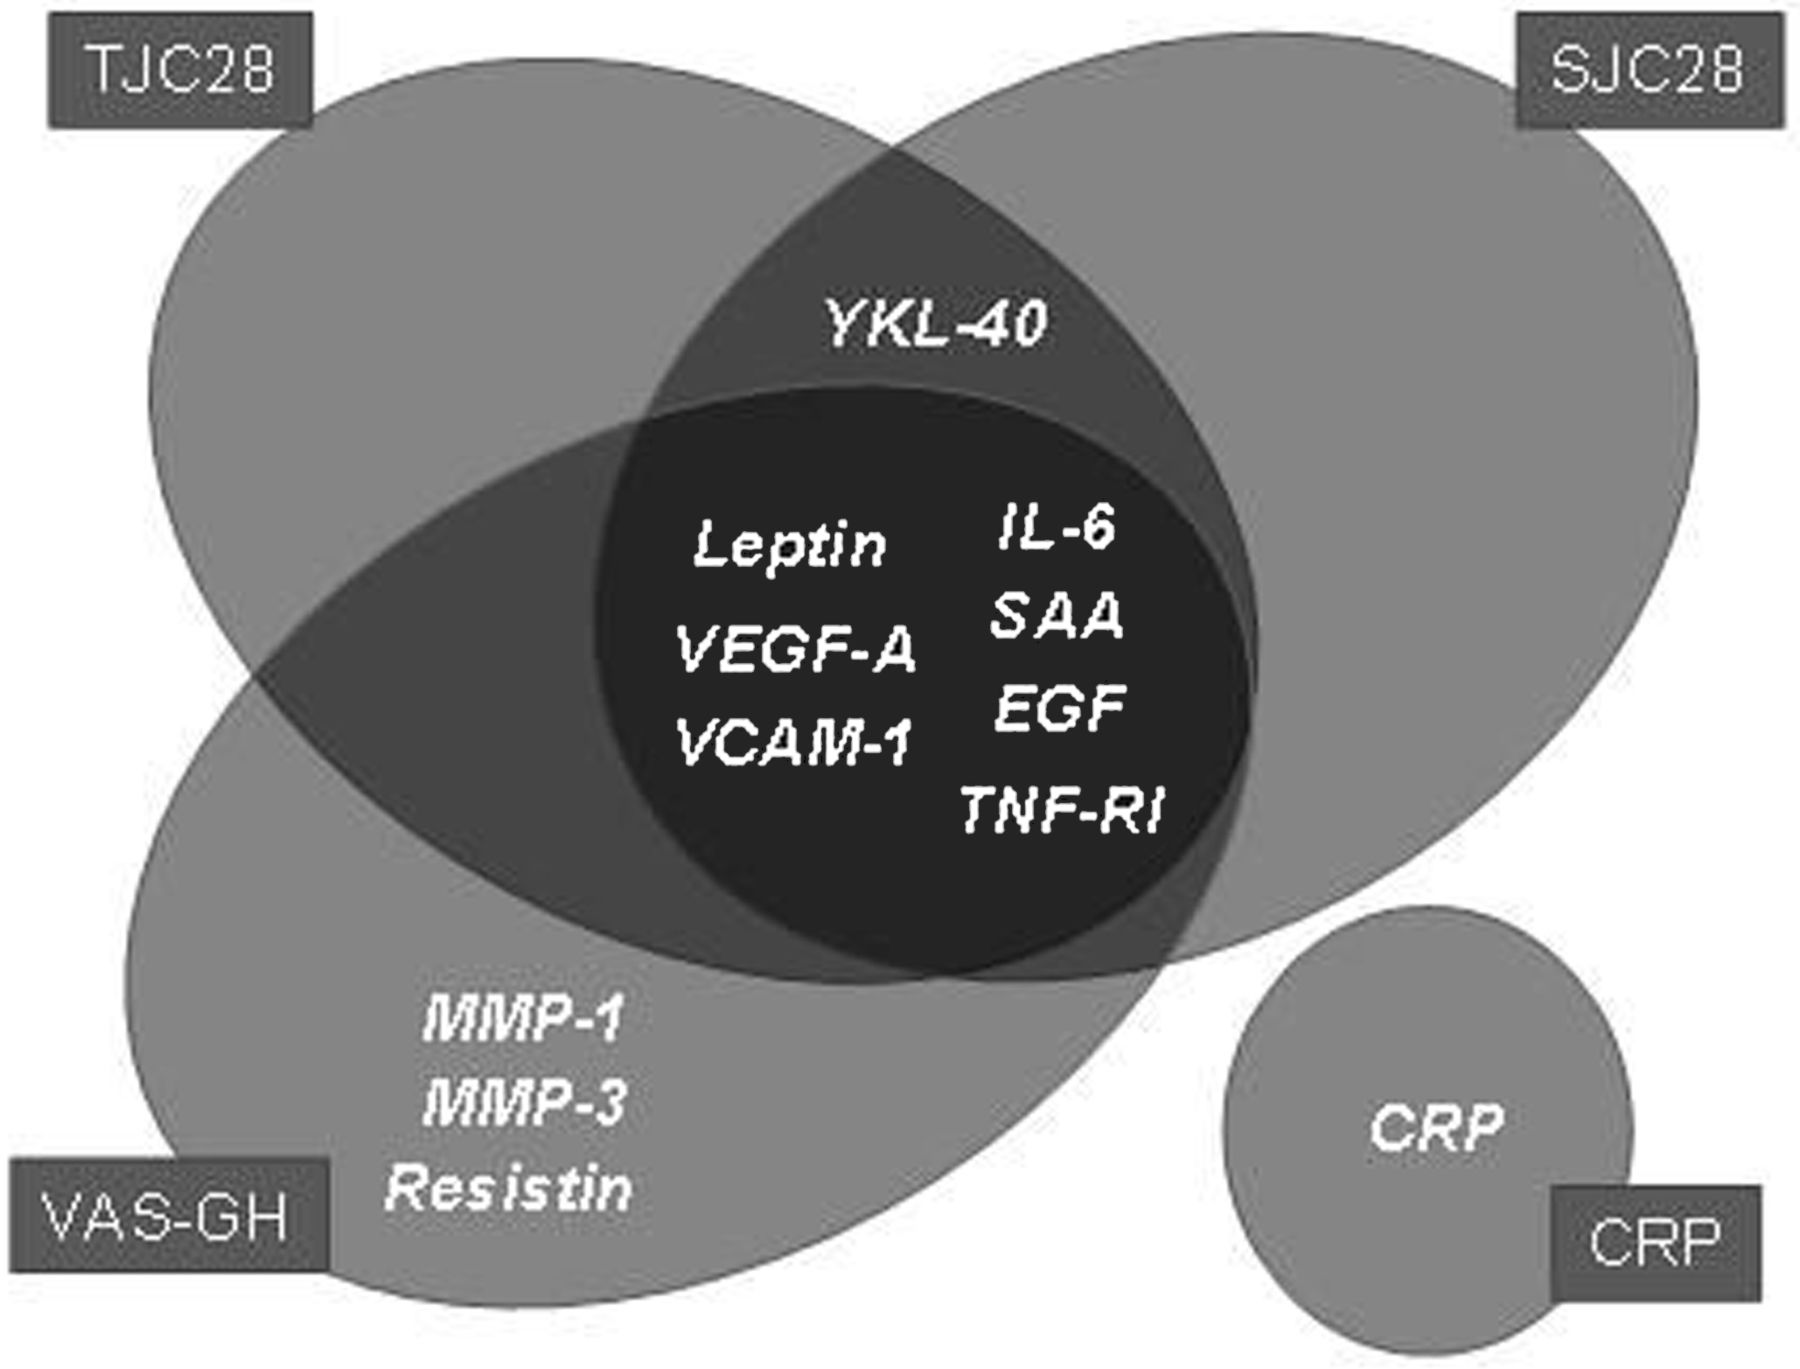
A disease activity algorithm using 12 of the serum protein biomarkers (figure 1) was applied to calculate MBDA scores. Biomarkers were selected (from 130 candidates) in prior studies by a combination of objective regression modelling and assay performance criteria.25 The assays and algorithm were the same as those used in the previously developed and validated MBDA test, Vectra DA (Crescendo Bioscience, South San Francisco, California, USA). This algorithm used serum biomarker concentrations to separately estimate TJC28, SJC28 and VAS-GH. The estimates for TJC28, SJC28 and VAS-GH were combined with a CRP test result to calculate an overall MBDA score: a whole number ranging from 1 to 100, using a formula analogous to that of the DAS28-CRP (figure 1).The algorithm was previously developed and trained using independent serum samples from the Index for Rheumatoid Arthritis Measurement (n=512) and Brigham and Women's Rheumatoid Arthritis Sequential Study (n=167) observational cohort studies.29 Since the MBDA score is calculated using a formula similar to that of the DAS28-CRP, it is straightforward to calculate the MBDA score equivalent to a given DAS28-CRP value (by multiplying the DAS28-CRP by 10.53 and adding 1). Thresholds were defined by calculating the MBDA score values equivalent to established DAS28-CRP thresholds separating low, moderate and high disease activity.30 The resulting thresholds defined MBDA scores ≤25 as remission, 26–29 as low, 30–44 as moderate and >44 as high disease activity.

MBDA score algorithm The MBDA score algorithm uses the same equation as the DAS28-CRP, with biomarkers used to predict the Swollen Joint Count (SJC28), Tender Joint Count (TJC28), and general health (VAS-GH) components of the equation. (PTJC= predicted TJC, PSJC= predicted SJC; PVAS-GH= predicted VAS-GH). The Venn diagram lists the MBDA score biomarkers used to predict each MBDA score component. This algorithm provides an MBDA score between 1 and 100.
Statistical analysis
Except where specified, analyses used data from all samples. The associations between individual biomarker concentrations (log-transformed to approach a normal distribution) and disease activity (DAS28-CRP, SJC28, TJC28 and VAS-GH) were assessed by Pearson correlation (r). p Values for correlations were calculated by permutation testing and adjusted for multiple hypothesis testing by calculating false discovery rate.31
The performance of the MBDA score algorithm was evaluated relative to clinical disease activity (DAS28-CRP) in three ways: (1) Pearson correlation (r). (2) Area under the receiver operating characteristic curve (AUROC) for discriminating between patients with moderate/high disease activity and those with remission/low disease activity (based on a DAS28-CRP cut-off of 2.7, the threshold separating remission/low disease activity from moderate/high disease activity for the DAS28-CRP; similar to the DAS28 threshold of 3.2).30 (3) The agreement between the classification of disease activity (low, moderate and high disease activity) according to the MBDA score and according to DAS28-CRP was calculated using (weighted) κ.
To determine whether CRP and the other MBDA biomarkers were independently predictive of disease activity, the MBDA score was calculated with the CRP term omitted. Multivariate linear models with clinical disease activity measures (DAS28, DAS28-CRP and their components) as dependent variables were fit by ordinary least squares regression. When using joint counts as dependent variables, the square roots of the counts were used (as in the DAS28 formula). The MBDA score and CRP (log transformed as in the DAS28 formula) were used as independent variables.
Changes in MBDA scores between visits were assessed by paired Wilcoxon rank sum test.
Prognostic value for progression of radiographic joint damage was assessed by logistic regression. Univariate logistic regression analysis was performed with the MBDA score or DAS28-CRP as independent variable and progression in Sharp van der Heijde (SHS) score over 2 years (progression >0 SHS units) as dependent variable. Multivariate (logistic) analyses adding other well-known prognostic factors for progression of joint damage (RF and baseline joint damage) were also performed (with treatment strategy, age and gender as covariates) to investigate the additional prognostic value of the MBDA score and DAS28-CRP. Separate analyses were performed for the MBDA score and DAS28-CRP at baseline and 6 months.
The statistical software packages R and SPSS V.15.0 were used for data analysis. Except where otherwise noted, a p value <0.05 was considered to be statistically significant.
Results
Association with clinical disease activity
Of the 20 proteins biomarkers examined, 14 were statistically significantly correlated with DAS28-CRP, 11 with DAS28, 11 with SJC, nine with TJC and six with VAS-GH (with a false discovery rate <0.05). Pearson correlations between the individual biomarkers and several disease activity measures are presented in table 1.
The MBDA score was calculated using 12 of the 20 biomarkers (Patient and Methods section and figure 1) and compared with DAS28-CRP, a widely accepted conventional measure of disease activity. Similar results were observed for DAS28 (data not shown). Figure 2A illustrates that the MBDA score achieved a statistically significant correlation to the DAS28-CRP (r=0.72; p<0.001). The MBDA score distinguished between remission/low disease activity and moderate/high disease activity with an AUROC of 0.86 (p<0.001, figure 2A,B). The prespecified AUROC analysis was conducted using a DAS28-CRP cut-off of 2.7, and it was noted that more subjects had high disease activity than low disease activity using this cut-off. To assess the impact of imbalance in the sizes of the disease activity groups upon classification performance, the AUROC was also calculated using a cut-off equal to the median DAS28-CRP of 4.6. The resulting AUROC was 0.83, very similar to the AUROC obtained using the prespecified cut-off of 2.7. Similar results were obtained using only a single visit per patient (data not shown).

The κ for agreement between the MBDA score and DAS28-CRP for classification of the disease activity level was 0.34 (95% CI 0.19 to 0.49). For baseline visits alone, κ was 0.23 (95% CI −0.027 to 0.48); this was 0.32 (95% CI 0.11 to 0.53) for 6-month visits alone. Weighted κ results were similar (table 2).
Contribution of non-CRP biomarkers
Since the MBDA score uses CRP, which is a commonly available laboratory test, we used multivariate regression to examine whether the other biomarkers in the score were independently associated with disease activity in the presence of CRP. The other biomarkers were combined together as in the MBDA score, but with CRP left out. When included in a multivariate model for DAS28-CRP (overall r2=0.52), these other MBDA biomarkers were independently associated with disease activity (p<0.001) and CRP was not (p=0.09). Similar results were obtained with multivariate models for the clinical components of DAS28: the other 11 MBDA biomarkers were independently associated with SJC28 (p<0.001), TJC28 (p<0.01) and VAS-GH (p=0.02), and CRP was not (p=0.35, p=0.81 and p=0.68, respectively).
Tracking response to therapy
In response to the treatment as used in the CAMERA study (n=46), the mean (SD) MBDA score dropped from 53 (18) at baseline to 39 (16) at the 6-month visit (p<0.0001; figure 3). The intensive and conventional strategy groups were also considered separately, revealing a significant decrease in MBDA score in the intensive strategy group (n=31) from 53 (17) to 35 (14) (p<0.0001). In the conventional strategy group (n=15), the mean MBDA score decreased from 55 (20) to 46 (19) (p=0.07).

MBDA scores by treatment arm and time point For each treatment strategy (i.e. intensive tight control MTX-based and conventional MTX-based treatment strategy) the results of the MBDA score are shown at baseline and after 6 months of treatment. Only results of patients with MBDA score at baseline and 6 months are shown.
Radiographic progression
The MBDA score and DAS28-CRP were examined for their ability to predict radiographic progression after 2 years of treatment. For one and five patients, respectively, no radiographs were available at baseline and 2 years. The median (IQR) yearly radiographic progression rate over 2 years was 0.0 (0.0–3.9); 26 patients were defined as progressors. At baseline neither the MBDA score (OR=1.018, 95% CI 0.988 to 1.049, p=0.25) nor DAS28-CRP (OR=1.041, 95% CI 0.645 to 1.680, p=0.87) was a significant predictor. Similar results were obtained using MBDA scores and DAS28-CRP at 6 months.
After inclusion of other known predictors for poor long-term outcome (RF and baseline damage) in a multivariate logistic regression model, the baseline MBDA score was borderline significant as an independent predictor for progression of joint damage (OR=1.033, 95% CI 0.995 to 1.072, p=0.09) next to RF (OR=1.768, 95% CI 0.396 to 7.885, p=0.46) and baseline joint damage (OR=4.213, 95% CI 0.878 to 20.211, p=0.07). When baseline DAS28-CRP was used in the model instead of the MBDA score, this result was less clear (OR=1.155, 95% CI 0.674 to 1.980, p=0.60) next to RF (OR=2.294, 95% CI 0.534 to 9.847, p=0.26) and baseline joint damage (OR=3.359, 95% CI 0.732 to 15.411, p=0.12). The 6-month MBDA scores or DAS28-CRP were not significant predictors in multivariate analysis.
Discussion
Tight control studies such as CAMERA, which include regular assessments of disease activity and intensive treatment approaches, have demonstrated beneficial effects on long-term patient outcomes for patients with RA.7 ,26 ,32 Although tight control strategies have been integrated into RA treatment guidelines,3 ,4 they may not be easily implemented in clinical practice around the world. A comprehensive panel of relevant serum protein biomarkers containing biologically rich RA disease activity information has the potential to assess disease activity in an objective manner and facilitate the use of tight control strategies.
In the present study, 20 serum biomarkers of RA disease activity were evaluated and 12 were used to calculate the MBDA score, a biomarker-based measure of RA disease activity. The individual biomarkers represent a broad range of biological pathways associated with RA disease pathophysiology. Some biomarkers that were found to be individually associated with disease activity in this study are not among the 12 biomarkers included in the MBDA score. This may be because they provide redundant information and are not independently predictive of disease activity in a multivariate model when other biomarkers are present. Conversely, some biomarkers that do not have significant individual correlations with disease activity in the CAMERA study are included in the MBDA score algorithm. One reason for this is that a biomarker may provide useful information in combination with other biomarkers but not individually.33
This analysis involved only a small number of patients, which limited our ability to address some questions of interest (such as predictive value for radiographic progression) and necessitates further studies. However, the final MBDA score was strongly associated with clinical disease activity despite the small sample size. κ Values also showed that there is fair agreement between disease activity levels according to both measures, although it is important to realise that there is no true gold standard for disease activity. It is expected that clinical assessment and disease biomarkers will differ in some cases, since they measure different aspects of the disease. Further studies are required to determine how to interpret cases in which the biomarker-based and clinical measures of disease activity differ. Also, performance estimates can be influenced by the characteristics of a given cohort and will vary between studies.
In this analysis, neither the MBDA score nor other clinical variables were clearly predictive of radiographic progression. This could be because the study population had quite limited progression over the 2 years examined, because of the limited sample size and because these disease activity measures were employed at only two time points. In another early RA population, the MBDA score was significantly correlated to future joint damage.34 Additional studies will further clarify the predictive value of the MBDA score for future radiographic progression.
To determine if MBDA scores in the CAMERA cohort at baseline and 6 months were affected by different RA management strategies, changes in MBDA scores were examined in patients receiving intensive and conventional therapy. MBDA scores improved in response to treatment with a 15-point decrease across all patients studied. The observed decrease in the MBDA score was greater in the intensive group than the conventional group. However, this study was not adequately powered to compare the effectiveness of the treatment strategies. Through monitoring RA disease activity and tailoring treatment strategies specifically to an individual patient's needs, low disease activity and, in some cases, remission are attainable. While obtained from a small patient population, these results suggest that monitoring of disease activity with the MBDA score can identify changes in disease activity and response to treatment. To confirm this, more measurements over time should be evaluated, and ultimately a trial evaluating the effect of a tight control strategy using the MBDA score (as compared with a clinical DAS) could be performed.
In conclusion, our results establish that the MBDA score measures clinical disease activity in RA patients and can detect changes in response to treatment. This clinical multi-biomarker test could be used (in conjunction with physical examination) to quantify overall disease activity in a patient management plan. Further studies are needed to define the optimal use of biomarkers in the management of RA.
References
Supplementary materials
Supplementary Data
This web only file has been produced by the BMJ Publishing Group from an electronic file supplied by the author(s) and has not been edited for content.
Files in this Data Supplement:
- Web Only Data - This web only file has been produced by the BMJ Publishing Group from an electronic file supplied by the author(s) and has not been edited for content.
Footnotes
-
Funding Crescendo Bioscience.
-
Competing interests Cavet, Haney, Shen and Hesterberg are all employees of Crescendo Bioscience, the company performing the multi-biomarker score and all laboratory analyses. Centola received a consulting fee from Crescendo Bioscience for his contribution to this manuscript.
-
Ethics approval Approval provided by the Medical Ethics Committee of UMC Utrecht, The Netherlands.
-
Provenance and peer review Provenance and peer review Not commissioned; externally peer reviewed