Article Text

Abstract
Objective To characterise activation of the type I interferon (IFN) pathway in patients with systemic lupus erythematosus (SLE), dermatomyositis (DM), polymyositis (PM), rheumatoid arthritis (RA) and systemic scleroderma (SSc) and to evaluate the potential to develop a molecular diagnostic tool from the peripheral blood that reflects this activation in disease-affected tissues.
Methods Overexpressed transcripts were identified in the whole blood (WB) of 262 patients with SLE, 44 with DM, 33 with PM, 28 with SSc and 89 with RA and compared with 24 healthy subjects using Affymetrix microarrays. A five gene type I IFN signature was assessed in these subjects to identify subpopulations showing both activation and concordance of the type I IFN pathway in the peripheral blood and disease-affected tissues of each disease and to correlate activation of this pathway in the WB with clinical measurements.
Results A common set of 36 type I IFN inducible transcripts were identified among the most overexpressed in the WB of all subjects. Significant activation of the type I IFN pathway in subgroups of each of the five diseases studied was observed. Baseline disease activity measurements correlated with a type I IFN gene signature in the WB of subjects with SLE, PM and SSc, as did various serum autoantibody levels in subjects with SLE and DM. This signature was also well correlated between disease-affected tissue and WB in subjects with SLE, DM, PM and SSc.
Conclusions The results indicate that the type I IFN pathway is activated in patient subsets of five rheumatic diseases and suggest that these subsets may benefit from anti-IFN therapy.
Statistics from Altmetric.com
Introduction
Cytokines play a significant role in regulating immune responses in inflammatory and autoimmune diseases. Targeting cytokines such as anti-tumour necrosis factor α, interleukin 6 and B cell-activating factor has shown clinical benefits in patients with rheumatoid arthritis (RA) and systemic lupus erythematosus (SLE).1,–,3 Interferon α (IFNα), a type I IFN, has been implicated in the pathogenesis of SLE and some patients periodically demonstrate elevated serum levels; this cytokine also correlates best with disease exacerbations.4,–,7 Furthermore, a phase Ia clinical trial evaluating an anti-IFNα monoclonal antibody (mAb) therapy has demonstrated evidence of clinical activity in patients with mild to moderate SLE with skin involvement concomitant with drug dose-dependent neutralisation of the type I IFN inducible gene signature in both the whole blood (WB) and skin lesions.8 9
In recent years, genomic studies have shown marked overexpression of type I IFN inducible genes in the peripheral blood of patients with SLE, dermatomyositis (DM), polymyositis (PM), multiple sclerosis, RA, systemic sclerosis (SSc) and Sjögren's syndrome.10,–,14 These observations raise an important question as to the association between abnormal activation of the type I IFN signalling pathway and disease activity in these diseases.
In this study we have extended our previous work8 15 by profiling the WB of a large cohort of patients with SLE, DM, PM, SSc, RA and healthy subjects. We confirmed a five gene type I IFN signature to identify specific subpopulations of diseased subjects showing activation of the type I IFN pathway. The activation pattern of this pathway was correlated with various clinical measurements of baseline disease activity and serum protein levels. Tissue-specific overexpression of type I IFN inducible genes was also evaluated at the disease sites in subjects with SLE (skin), SSc (skin), myositis (muscle) and RA (synovial tissue) and correlated with WB specimens for matched subjects. This work supports the possibility of developing a common molecular diagnostic to predict type I IFN activation at the diseased tissue of the five diseases surveyed.
Materials and methods
WB and affected tissue biopsies from disease and healthy subjects
WB from 262 patients with SLE (commercial vendors (n=41), a phase Ia clinical trial (n=65) and a phase Ib clinical trial (n=156) evaluating an anti-IFNα mAb therapy in patients with moderate to severe SLE) used in the study has been described previously.8 15 All patients with SLE had a history of at least four of 11 positive American College of Rheumatology (ACR) classification criteria for the diagnosis of SLE16 17 and active disease manifestations at the time of sample collection. Lesional skin biopsies were taken from 16 SLE subjects with skin involvement from the phase Ia clinical trial above.
WB from 22 patients with DM and 20 with PM used in the study were from collaborations with Brigham and Women's Hospital, Boston, Massachusetts, USA (n=16) while the remainder were from a phase Ib clinical trial evaluating anti-IFNα mAb therapy in patients with DM and PM. Muscle biopsies (37 DM, 36 PM) from patients with myositis were obtained either from this phase Ib trial or through Brigham and Women's Hospital.
WB from 28 patients with SSc and 16 skin biopsies were taken from patients enrolled in a phase Ia clinical trial evaluating anti-IFNα receptor mAb therapy in SSc. Full thickness skin biopsies from patients with SSc were taken from the extensor surface of the forearm and snap frozen in liquid nitrogen before RNA processing.
WB from 89 patients with RA was procured from Asterand (Detroit, Michigan, USA). Patients enrolled in the study were aged >18 years and had a history of at least three of seven ACR classification criteria for the diagnosis of RA.18 Patients ranged from early, moderate to severe in disease stage and were naïve to, current users of, responsive or refractory to biological agents (see table S1 in online supplement). The latter two groups were previously treated with at least one, two or three anti-TNF biological agents. Synovial tissue from 20 patients with RA and two normal healthy donors was procured from ILSBio (Chestertown, Maryland, USA).
The controls included WB from 24 healthy normal donors (age 23–56 years) enrolled at MedImmune as described previously.8 15 Normal skin from 25 healthy subjects was used as control as described elsewhere,19 and 29 normal muscle specimens or total RNA from normal muscle specimens were obtained from several sources including three total RNA specimens from Ambion (Austin, Texas, USA), six biopsies from Asterand (Detroit, Michigan, USA), 15 biopsies from ILSBio (Chestertown, Maryland, USA) and five biopsies from Brigham and Women's Hospital (Boston, Massachusetts, USA), 14 of which passed quality control. The majority of the donors were Caucasians (demographic information, where available, provided in table 1). All subjects provided informed consent and all studies were approved by the institutional review boards from the different sites or commercial vendors. Muscle or skin/WB paired sample sizes include: 14 SLE, 16 DM, 19 PM and 16 SSc.
Demographic characteristics (for available subjects) and percentage of normal donors and subjects with SLE, DM, PM, RA and SSc with a positive type I interferon (IFN) inducible gene signature in the WB
Methods for stimulation of WB and muscle cell lines and primary keratinocyte/fibroblast cultures with type I IFN family members, RNA processing and array analysis, the identification and the cut-off of the five gene type I IFN signature score and both disease severity and serology analyses are described in the online supplement. Medication information (where available) for patients used in this study is provided in table S1 in the online supplement.
Results
Concordant overexpression of type I IFN inducible transcripts in WB and disease tissue of SLE, DM, PM and SSc subjects
A subset of the five most overexpressed and prevalent genes in the WB (IFI44, IFI44L, IFI27, RSAD2 and IFI6) of the five diseases was identified from the 807 type I IFN transcripts determined from ex vivo stimulation experiments described previously.15 Both heatmap (see figure S1A in the online supplement) and principal component analysis (PCA) (see figure S1B–F in online supplement) showed a subset of subjects from each disease population with activation of the type I IFN pathway. A type I IFN composite signature score was determined from these five genes (see online supplement for description of method) and used to quantify activation of the type I IFN signalling pathway in the WB.
This five gene signature score for individual disease and healthy subjects is shown in figure 1A, where a score of at least 4 for WB and skin is classified as type I IFN inducible gene signature positive (see methods section in online supplement). Since both age and gender have been shown to be associated with type I IFN levels in the plasma or serum of patients with RA or SLE,20 21 and we calculated significant associations between the gene signature score and these two variables with healthy and diseased subjects in four of the five diseases studied (see table S2 in online supplement), we adjusted for age and gender (and race when available) in all comparisons presented in this study using a model extension to the Wilcoxon–Mann–Whitney rank sum test (see online supplement for method).22 The WB type I gene signature scores of the disease subjects were significant compared with the healthy subjects (SLE, DM, PM and SSc: all p<0.0001; RA: p<0.05). The overexpression of each of the five genes in the WB of disease subjects was validated with qRT-PCR (see figure S2 in online supplement; p<0.0001 for all five genes in diseased subjects compared with healthy subjects except RA with p<0.05).

Overexpression of type I interferon (IFN) inducible genes as captured by the five gene type I IFN signature score in the whole blood (WB) and disease tissues of subjects with SLE, DM, PM, RA and SSc. Five gene type I IFN signature score in (A) WB and (B) disease tissues for healthy and diseased subjects (healthy subjects (n=24); SLE (n=262); DM (n=44); PM (n=33); RA (n=89); SSc (n=38)). The p values for the signature scores between healthy subjects and SLE, DM, PM, RA and SSc subjects in the WB after adjustment for gender and age are p<0.0001, p<0.0001, p<0.0001, p<0.05 and p<0.0001, respectively. The p values for the lesional skin from SLE (n=16) and SSc (n=16) subjects compared with normal healthy subjects (n=25) is p<0.05 for both and p<0.0001 and p<0.01 in muscle specimens between DM (n=37) or PM (n=36) subjects and healthy subjects (n=14), respectively. No statistical test was calculated in the RA comparison due to sample size (n=2 vs n=20), although the trend is apparent. Horizontal bars represent the median values for each group and the grey dashed line indicates the threshold for signature positive or negative status. DM, dermatomyositis; PM, polymyositis; RA, rheumatoid arthritis; SLE, systemic lupus erythematosus; SSc, systemic scleroderma.
The breakdown of type I IFN signature positive patients for each disease was 73% SLE, 66% DM, 61% PM, 68% SSc and 33% RA, suggesting a substantial presence of type I IFN gene overexpression in a specific subgroup of patients with these autoimmune diseases (table 1).
We also evaluated the overexpression of type I IFN inducible genes in the disease tissues with the five type I IFN gene signature score. The majority of the transcripts induced by type I IFN in the resident skin cells or muscle cell lines were also inducible in the WB (skin data described in Walsh et al10 and Yao et al19; muscle data not shown). Although the sample size is modest (16 SLE, 37 DM, 36 PM, 16 SSc and 20 RA subjects), a significant overexpression of type I IFN inducible genes was observed compared with normal subjects (p<0.05 for SLE and SSc, p<0.0001 for DM and p<0.01 for PM; figure 1B). The overexpression of type I IFN inducible genes in DM muscle agreed with the results previously described by Der et al.23 The comparison of subjects with RA was limited by the small number of normal subjects for statistical evaluation.
In patients with matched WB and disease tissue specimens, 12 of 14 subjects with SLE showed concordant type I IFN gene signature status (ie, positive vs negative) in WB and lesional skin (linear correlation r=0.67, p=0.009; figure 2A). All 16 subjects with DM and 16/19 with PM showed gene signature status concordance between muscle and WB specimens (DM subjects: r=0.81, p=0.0001; PM subjects: r=0.66, p=0.002; figure 2B,C). Of the 16 subjects with SSc, 12 showed gene signature status concordance between lesional skin and WB (r=0.77, p=0.0005; figure 2D). These observations show a positive trend of concordant expression of type I IFN inducible genes in WB and disease tissues of subjects with SLE, DM, PM and SSc. Owing to a lack of matched specimens, we were unable to perform similar correlation analysis for the subjects with RA.

Correlation scatter plots of the five gene type I interferon signature score between that in disease tissue (y axis) and the whole blood (x axis) in subjects with (A) systemic lupus erythematosus (SLE, n=14), (B) dermatomyositis (DM, n=16), (C) polymyositis (PM, n=19) and (D) systemic scleroderma (SSc, n=16). Spearman rank correlation coefficients and p values are provided to quantify the association for each disease plot.
Commonality of type I IFN inducible transcripts overexpressed in the WB of disease subjects
We identified overexpressed transcripts (fold change (FC) >2, q value <0.05) for each disease separately (compared with healthy subjects) to assess the disease-shared similarity of type I IFN pathway activation in the WB. Downregulated transcripts are not presented since little commonality was shared among these diseases. Analysis revealed that 165 transcripts (137 unique genes) common to all diseases were overexpressed (see table S3 in online supplement), of which 36 were type I IFN inducible. Each gene was summarised across the five diseases using the median fold change. Six of the top 10 unique genes most overexpressed are type I IFN inducible (IFI6, RSAD2, STAT2, IFI44, LIPA and IFI27) and four are non-type I IFN inducible (MALAT1, LILRA5, SLC8A1 and CDC42SE1). Pathway analysis showed Janus kinase/signal transducers and activators of transcription pathway as most activated in the WB of these subjects. Among the non-type I IFN inducible genes, enriched biological processes included invasion of cancer cell lines, migration of fibroblasts, epithelial cells, keratinocytes, B lymphocytes and infiltration of leucocytes and macrophages. We also comprehensively examined non-type I IFN genes and their potential involvements in autoimmunity. These results are shown in table S4 in the online supplement.
Correlation between the five gene type I IFN signature in the blood and measurements of baseline disease activity
Baseline measurements of disease activity were available for some subjects with SLE (Systemic Lupus Erythematosus Disease Activity Index (SLEDAI) and British Isles Lupus Assessment Group (BILAG) Index), DM (manual muscle testing score; MMT8), PM (manual muscle testing score; MMT8) and SSc (modified Rodnan total skin score; mRTSS). We evaluated the correlation between these measurements and the five gene type I IFN signature score, first by calculating the difference in gene signature scores between subjects with low or high disease activity (cut at the median score) and then by grouping subjects by gene signature score status and calculating the difference in clinical measurements.
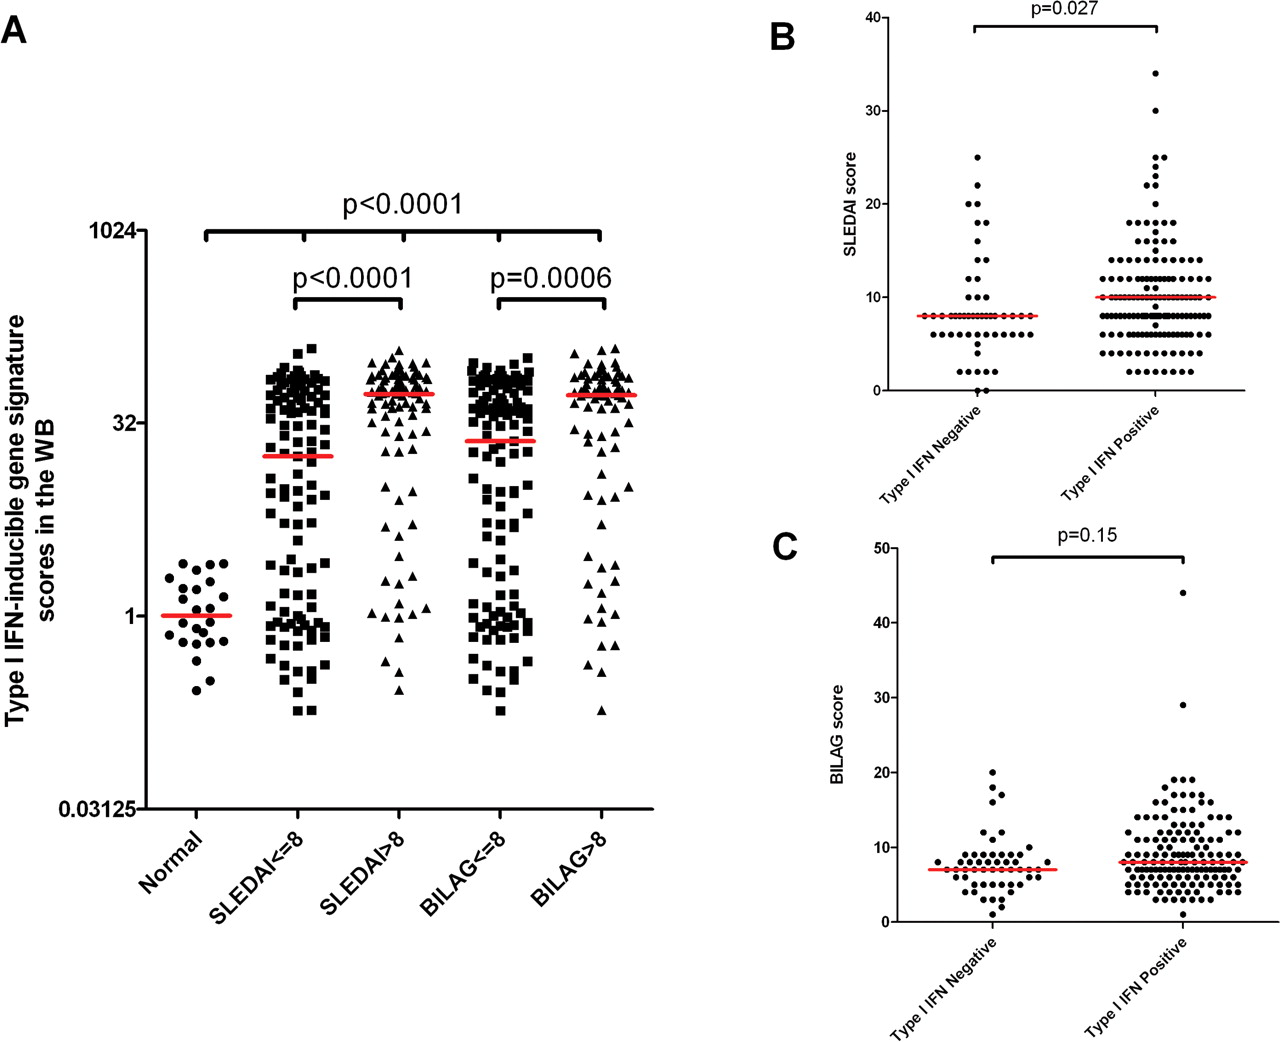
Figure 3A–C shows a significant difference in gene signature scores between healthy subjects and all four SLE subject groupings (SLEDAI ≤8 or SLEDAI >8; BILAG ≤8 or BILAG >8; p<0.0001 for all comparisons) and between subjects with SLE with low or high disease activity using either SLEDAI or BILAG scores (p<0.0001 and p=0.0006, respectively). Type I IFN signature positive versus negative SLE subjects had significantly different SLEDAI scores (p=0.027), whereas BILAG scores did not differ at an α level of 0.05 (p=0.15).

Scatter plots comparing disease activity scores with the five gene type I interferon (IFN) signature score in subjects with systemic lupus erythematosus (SLE). (A) Plot of type I IFN gene signature scores stratified by normal healthy controls, SLE subjects with low SLEDAI scores (SLEDAI ≤8, n=109), SLE subjects with high SLEDAI scores (SLEDAI >8, n=90), SLE subjects with low BILAG scores (BILAG ≤8, n=119) and SLE subjects with high BILAG scores (BILAG >8, n=80). (B) Plot of SLEDAI scores in subjects with SLE stratified by type I IFN signature negative (n=53) or positive groups (n=146). (C) Plot of BILAG scores in subjects with SLE stratified by type I IFN signature negative (n=53) or positive (n=146) groups. The low and high disease activity cut-off score for SLEDAI and BILAG was the median disease score across all subjects with SLE determined for each disease score index separately. Red bars represent the median value. BILAG, British Isles Lupus Assessment Group Index; SLEDAI, Systemic Lupus Erythematosus Disease Activity Index.
For the subjects with DM and PM, MMT8 scores (a clinical end point agreed by the FDA to evaluate efficacy of drugs that target DM and PM) were used in the same analysis with the MMT8 scores cut off at the combined median of 121 to partition low or high disease activity. Figure 4A–D shows a significant difference in gene signature scores between healthy subjects and both low and high disease activity groups in subjects with DM and PM (p<0.01 for all comparisons). Furthermore, in subjects with PM the difference in gene signature scores was significant between low and high disease activity groups (p=0.004), and gene signature positive versus negative groups showed a significant difference in disease activity scores (p=0.01).
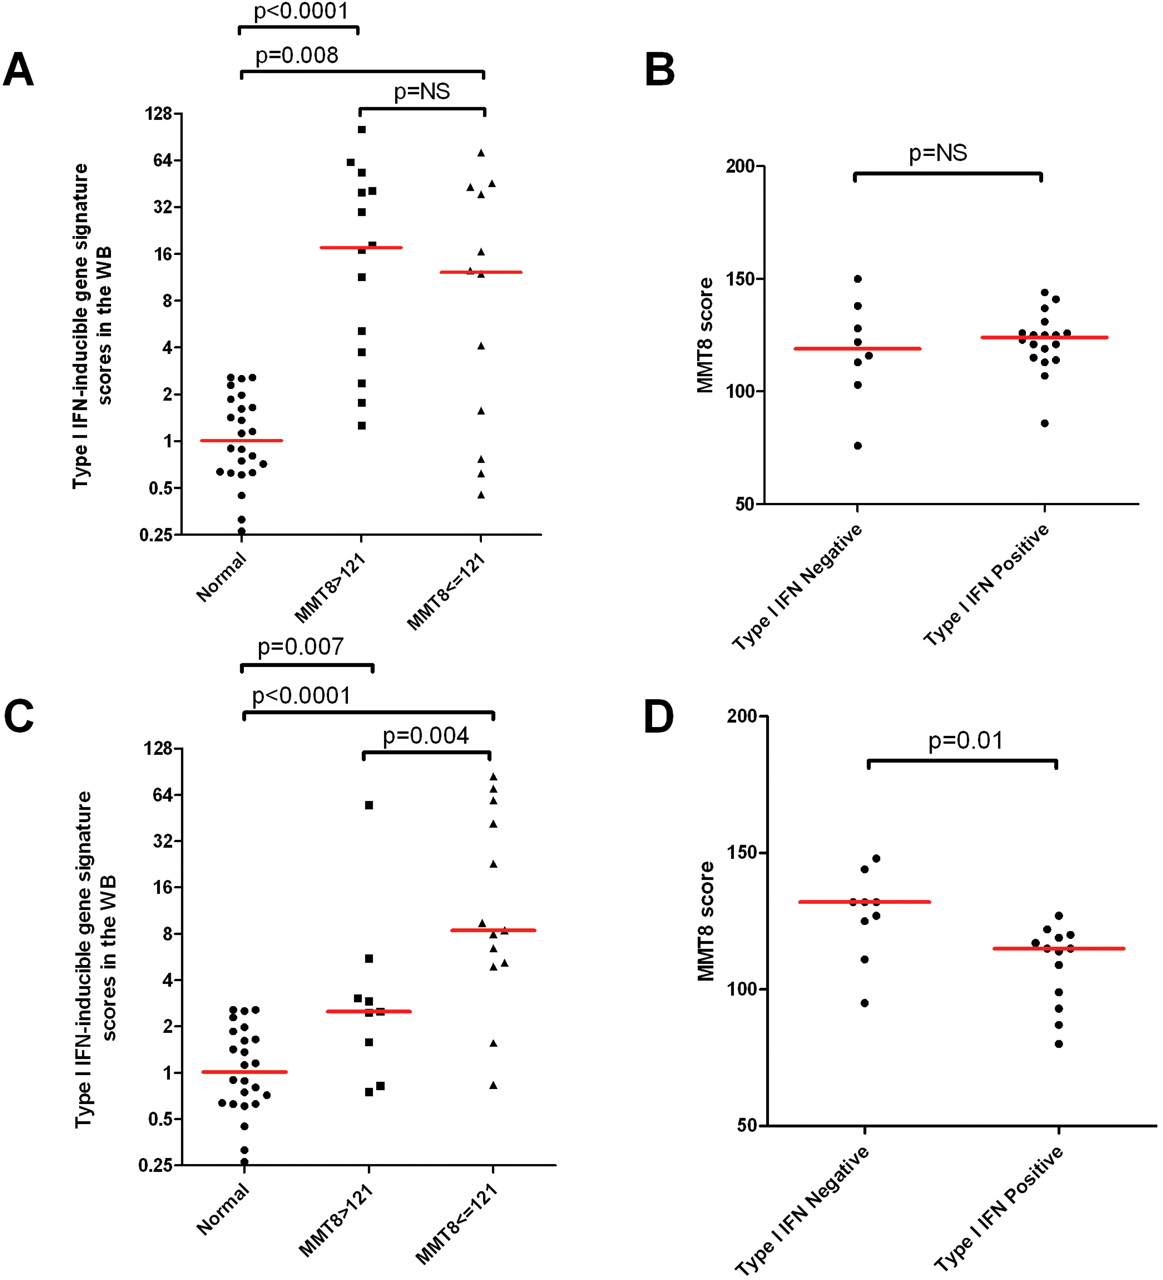
Scatter plots comparing disease activity scores with the five gene type I interferon (IFN) signature score in subjects with dermatomyositis (DM) or polymyositis (PM). (A) Plot of type I IFN gene signature scores stratified by normal healthy controls, subjects with DM with low MMT8 scores (MMT8 ≤121, n=12) and subjects with DM with high MMT8 scores (MMT8 >121, n=14). (B) Plot of MMT8 scores in subjects with DM stratified by type I IFN signature negative (n=8) or positive groups (n=18). (C) Plot of type I IFN gene signature scores stratified by normal healthy controls, subjects with PM with low MMT8 scores (MMT8 ≤121, n=13) and subjects with PM with high MMT8 scores (MMT8 >121, n=9). (D) Plot of MMT8 scores of subjects with PM stratified by type I IFN signature negative (n=9) or positive (n=13) groups. The low and high disease activity cut-off score for MMT8 was the median disease score across all DM and PM subjects combined. The MMT8 score for healthy subjects with normal muscle strength is 150. A lower MMT8 score is associated with weaker muscle strength. Red bars represent the median value.
For subjects with SSc, figure 5A,B shows the same pattern as that seen in other diseases with a significant difference in gene signature scores between healthy subjects and both low and high disease activity SSc groups (p<0.001 for both comparisons). There was also a significant difference in mRTSS scores between gene signature positive and negative groups (p=0.03).

Scatter plots comparing disease activity scores with the five gene type I interferon (IFN) signature score in subjects with systemic scleroderma (SSc). (A) Plot of type I IFN gene signature scores stratified by normal healthy controls, subjects with SSc with low mRTSS scores (mRTSS ≤19.5, n=14) and subjects with SSc with high mRTSS scores (mRTSS >19.5, n=14). (B) Plot of mRTSS scores of subjects with SSc stratified by either type I IFN signature negative (n=9) or positive (n=19) groups. The low and high disease activity cut-off score for mRTSS was identified by calculating the median disease score across all subjects with SSc. A higher mRTSS score is associated with severe skin disease activity. Red bars represent the median value.
Both disease stage and characteristics of anti-TNFα mAb therapy were used to identify any potential association with gene signature scores in subjects with RA (no baseline disease activity measurements available). There was no significant difference in gene signature scores in subjects with RA between moderate and severe disease stage (see figure S3A in the online supplement), between healthy subjects and anti-TNFα mAb naïve RA subjects, nor between subjects with RA who responded to anti-TNFα mAb therapy and those who were refractory to anti-TNFα mAb therapy (see figure S3B in online supplement).
Association of WB type I IFN inducible gene signature with serum proteins in SLE, DM and PM subjects
Serum protein levels were available for some of the subjects with SLE, DM and PM (see online supplement) and were used to identify any potential correlation with the type I IFN gene signature. Antinuclear antibody measurements (available in a limited number of subjects with SLE) showed a moderate correlation with gene signature score (p=0.08); however, four antinuclear antibodies individually showed a strong positive correlation with gene signature scores (anti-LA: p<0.05; anti-RNP: p<0.0001; anti-RO: p<0.0001; and anti-SM: p<0.0001). In addition, complement proteins (Ch50 complement activity) were found to be significantly negatively associated with gene signature scores (p<0.01). In subjects with PM antinuclear antibody was the only serum measurement correlated with gene signature scores (p<0.05), and no correlation of serum proteins with gene signature scores was seen in subjects with DM. Table S5 in the online supplement shows all the serum proteins measured, p values and sample sizes.
Discussion
As there is mounting evidence that type I IFN is probably involved in the pathogenesis of several autoimmune diseases including SLE,7 24,–,27 myositis,11 28,–,30 Sjögren's syndrome,13 31 32 RA12 33,–,35 and SSc,36,–,38 it will benefit patients if a potential diagnostic tool is developed that allows the identification of patients likely to respond to anti-type I IFN therapy. The overexpression of type I IFN inducible genes in the WB of these diseases may provide a solution. To better assess the utility of the type I IFN signature as a potential molecular diagnostic tool for these diseases, we sought to evaluate the prevalence of this signature in the WB of patients and to examine its correlation with disease activity.
Some of the key issues assessed are: (1) the robust and universal overexpression of the type I IFN gene signature in the WB of five diseases; (2) generation of a hypothesis of a universal molecular diagnostic tool; (3) the concordant overexpression of this gene signature in the WB and disease tissues of these subjects; and (4) correlations identified between this gene signature and certain measurements of baseline disease activity or serum protein levels.
There was concordant overexpression of the type I IFN inducible gene signature in the WB and disease tissues with matched samples in subjects with SLE, DM, PM and SSc (r>0.65). This suggests that the type I IFN signature in the blood may reflect activation of the type I IFN pathway at the disease sites, thus making it possible to use overexpression of the type I IFN gene signature in the blood as a potential diagnostic tool to predict patients who may respond to anti-type I IFN therapy.
The correlation between the type I IFN gene signature in WB and measurements of baseline disease activity in SLE, PM and SSc was found to be significant. Both SLEDAI and BILAG scores were correlated with the type I IFN gene signature in subjects with SLE when stratified by high or low disease activity or by gene signature. Similar results were obtained with MMT8 and mRTSS scores in subjects with PM or SSc at the α=0.05 level. Subjects with DM did not exhibit a correlation between disease activity and gene signature, which may in part be due to the small sample size in a heterogeneous autoimmune disease or to unknown confounding factors that were not available in this study. A previous study showed correlation of a three gene type I IFN signature with MMT8 scores in a combined group of adults and children with DM, but the analysis did not account for age, gender or race differences, nor did it include patients with MMT8 scores >80.38 It has also been reported that an activated type I IFN system was associated with disease manifestations of SSc.39
Subjects with RA who responded to anti-TNFα mAb therapy did not show correlation with increased type I IFN signature scores in the WB. This result is consistent with previous work that has shown no difference in selected type I IFN inducible gene levels between responders and non-responders prior to treatment with infliximab.40 Similarly, we did not observe a statistical difference between healthy subjects and any of three groups of subjects with RA (naïve to anti-TNFα mAb therapy, refractory to anti-TNFα mAb therapy or responders to anti-TNFα mAb therapy) although, with the additional 37 RA subjects, a modest significant difference was seen in the WB (figure 1A). With the known effects of multiple medications on gene signatures and the heterogeneous RA cohorts in this study, any observed association or lack thereof should be interpreted with caution.
In subjects with SLE we found that the type I IFN gene signature was positively correlated with antinuclear antibody subtypes anti-LA, anti-RNP, anti-RO, anti-SM and negatively correlated with complement protein levels. In subjects with PM a significant positive correlation was observed between the type I IFN gene signature and antinuclear antibody.
One limitation of this study is that all baseline disease activity scores presented are composite scores including qualitative measurements with inevitable subjective factors. Disease variations at the molecular level may not therefore directly and accurately reflect disease scores. Despite this limitation, the findings described in this study provide a quantitative objective measurement at the molecular level of type I IFN activity that correlates with disease activity for several diseases, and thus provide further evidence to support the hypothesis that subsets of patients across these autoimmune diseases may respond to anti-type I IFN therapy.
References
Supplementary materials
HTML Page - index.htslp
Files in this Data Supplement:
Footnotes
BWH and ZL contributed equally to this work.
-
Funding The study was supported by MedImmune LLC.
-
Competing interests MedImmune is developing anti-type I interferon therapy for autoimmune diseases. BWH, ZL, WZ, WW, CM, PB, LR, BJ and YY are full-time employees of MedImmune and SAG has served as a consultant for MedImmune. The Brigham and Women's Hospital manages research sponsored by MedImmune and intellectual property pertaining to myositis diagnostics. DF is not a paid consultant of MedImmune and is an employee of Stanford University.
-
Ethics approval This study was conducted with the approval of the institutional review boards from the different sites or commercial vendors and all subjects provided informed consent.
-
Provenance and peer review Not commissioned; externally peer reviewed.