Article Text

Abstract
Background Disease activity in rheumatoid arthritis (RA) can be measured clinically (eg, swollen joint count (SJC)) or systemically (eg, C reactive protein (CRP)). In general, both contribute to the progression of joint damage, but the relevance of residual inflammation in patients near remission is unclear.
Objective To determine the independent contribution of SJC and CRP to progression of joint damage in patients near remission.
Methods Data from methotrexate monotherapy arms of the ASPIRE, ERA, Leflunomide, PREMIER and TEMPO trials (n=1184) were pooled and the average SJC and CRP values from visits at 6, 9 and 12 months were determined. The two variables were then dichotomised into active and inactive, where inactive was defined as a mean. Radiographic outcomes were assessed according to these definitions.
Results The greatest progression was seen in patients in whom both SJC and CRP were active and the smallest in those in whom both were inactive. If SJC was inactive, radiographic progression was not different between those with inactive or active CRP (0.7±4.3/year and 0.8±5.4/year, respectively, p=0.19). However, if CRP was inactive (<1 mg/dl), SJC status still determined radiographic progression (0.7±4.3/year and 1.8±5.6/year, for inactive and active SJC, respectively, p=0.004). The importance of SJC in patients with inactive CRP was also shown in a linear model (p=0.019), while CRP was not significantly different in patients with inactive SJC (p=0.40).
Conclusion In patients with RA who are near remission, the amount of joint swelling appears to be more predictive of radiographic progression than the amount of CRP.
Statistics from Altmetric.com
Rheumatoid arthritis (RA) is characterised by joint swelling and tenderness as well as features of systemic inflammation reflected by an increase in acute phase reactants (APRs) such as C reactive protein (CRP) or the erythrocyte sedimentation rate (ESR).
Swollen joint counts (SJCs) and APRs have repeatedly been shown to be associated with radiographic progression of RA.1,–,5 Modern therapies with synthetic disease-modifying antirheumatic drugs (DMARDs) frequently improve clinical and serological markers of inflammation.6,–,10 However, in a considerable proportion of patients, normalisation is seen in only one of them (often the APR) but not in the other. While composite measures of disease activity are widely recommended to assess disease activity,11 12 they are not invariably applied13 and targeting only a reduction in SJC or, more frequently, CRP might often be used in clinical practice.14,–,17 Consequently, in patients with normal APRs but residual joint swelling, treatment might not be amended despite the current call for dynamic and intensive use of available therapies to attain low disease activity and, ideally, remission,11 12 because the residual swelling might be considered irrelevant without serological evidence of systemic inflammation. On the other hand, increased levels of APRs in patients without joint swelling might be considered to be unrelated to RA and likewise be undertreated.
The effects of joint swelling and elevated APR levels on joint damage at the boundary between active disease and remission are therefore unclear, especially when the other variable has already normalised. In the present study we explored the effects of joint swelling and APR on radiographic progression in patients in whom one of the two markers has normalised.
Methods
Databases
We were provided with relevant data from a random sample of 80–90% of patients from the ASPIRE,18 PREMIER,19 ERA20 and TEMPO trials on tumour necrosis factor inhibitors (TNFi; adalimumab, etanercept or infliximab) combined with methotrexate (MTX) (or not) compared with MTX21; we also used data from leflunomide trials compared with sulfasalazine or MTX.22,–,25 All patients had active RA at entry into these studies and, with the exception of the ASPIRE trial, raised levels of APRs were also required (CRP ≥1.5–2.0 mg/dl or ESR ≥28 mm/h). Sharp scores or van der Heijde modified Sharp scores were available for radiographic analysis in all trials. Demographic data have been presented in the respective publications.
Data preparation
In the present analyses only patients with available clinical data at baseline and at the 6-, 9- and 12-month follow-up visits and radiographic data at baseline and at 1 year were studied. Data from all trials were pooled into three groups by drug regimen: (1) synthetic DMARD monotherapy (including MTX and leflunomide); (2) TNFi monotherapy (adalimumab and etanercept); and (3) a combination of TNFi with MTX. The main focus of the analyses was the group treated with traditional DMARDs, as the major outcome in this study was radiographic progression which is mostly inhibited even independently of disease activity if the regimen included a TNFi in combination with MTX.26 27
Outcome measures
The van der Heijde modified Sharp score produced very similar results to the modified Sharp score used in group analyses28 and the data were therefore combined and are reported as the total Sharp score (TSS) or as joint space narrowing (JSN) and erosion (ERO) scores. Progression was calculated based on the baseline and 12-month radiographic score readings.
For assessment of the radiographic implications of SJC and CRP, we obtained the typical 28 SJC and CRP in mg/dl. We then determined the average SJC and the average CRP levels from 6 to 12 months (based on the visits at 6, 9 and 12 months), providing more robust variables for the statistical analyses than a single point in time.
Main analyses
The main analysis was performed in the group of patients treated with DMARDs using time-averaged SJC as a measure of clinical inflammation and time-averaged CRP as a measure of serological inflammation. We dichotomised both variables into ‘active’ and ‘non-active’, where ‘non-active’ was defined as a mean SJC of <1 joint or a mean CRP of <1 mg/dl.
We cross-tabulated the mean radiographic progression from baseline to 12 months in 2×2 tables according to the activity/non-activity status of the two variables (SJC and CRP) and assessed the differences using the Wilcoxon two-sample test. Differences with a p value <0.05 were considered statistically significant.
Linear model analysis
To avoid dichotomisation we used a generalised linear model (GLM) to assess the principal effects of SJC and CRP and their interaction. We then tested the effect of increasing SJC in the subgroup with inactivity for CRP (<1 mg/dl), and vice versa. Linear model data were used to supplement the dichotomised data analysis. They may be appropriate despite non-normality of the dependent variable given the large number of patients (central limit theorem) and the lack of sufficient possibilities to transform a variable with also negative values. In an additional multivariate GLM we adjusted the effects of CRP on radiographic changes in the patient group with inactive SJC for the effects of age, gender and duration of RA, rheumatoid factor positivity and the nominal ‘trial’ variable and, vice versa, the effect of SJC in patients with inactive CRP was also adjusted for these variables.
Effects on JSN and ERO
To determine if the observed associations in the total score were driven by one of these components alone or by both, we repeated the 2×2 analysis as described but replaced the outcome/dependent variable by JSN and then by ERO.
Analysis in patient groups treated with TNFi monotherapy or in combination with MTX
Additional identical analyses (2×2 table) were performed separately for the TNFi monotherapy and combination therapy groups of these trials as applicable. These were excluded from the main analysis given the expected minimal changes in the outcome variable (radiographic progression).
Sensitivity analysis
We then performed a series of sensitivity analyses to ensure the robustness of our results. We first repeated the 2×2 table analysis using a cut-off point of 0.5 mg/dl instead of 1 mg/dl to define activity/inactivity by CRP and substituted ESR for CRP as the measure of APR. For that purpose, we defined ESR <20 mm as ‘inactive by APR’ and ESR ≥20 mm as ‘active by APR’.
Then, as the 28 SJC does not include the feet, we used the comprehensive 66 SJC instead to define inactivity/activity by clinical means (cut-off <1 to define inactivity). We also examined a looser definition of ‘inactive’ (SJC cut-off point of 2 on the 28 SJC).
Finally, new remission criteria have recently been put forward29 which use inclusive cut-off points of 1 (≤1) for swollen and tender joints as well as patient global and CRP. In another sensitivity analysis we therefore used the cut-off point of ≤1 to define normal SJC and normal CRP.
All statistical preparations of the dataset and analyses were performed using SAS Version 9 (SAS, Cary, Illinois, USA).
Results
The detailed characteristics at baseline for all the therapeutic subgroups are shown in table 1. Using a cut-off point of >0.5,30 604 (51%) of the 1184 patients treated with DMARDs progressed radiographically during the 12-month period with a mean (SD) change in TSS of 2.5 (9.2) (median 0.5 (quartiles 0–3.1)). With TNFi therapy, 182 (43.4%) progressed by a mean progression of 1.4 (6.0) (median 0 (0–1.1)) and, with combined TNFi+MTX treatment, 284 (36.7%) progressed by a mean of 0.4 (4.4) (median 0 (−1.0 to 1.2)).
Baseline characteristics by drug regimen and swollen joint count (SJC) and C reactive protein (CRP) activity status
Effect of activity/inactivity of SJC and CRP on radiographic progression
The initial analysis used a 2×2 tabulation by activity/inactivity of SJC or CRP. The main outcome of interest was the impact on radiographic progression (table 2). Since data are non-normally distributed, statistical comparisons were done by non-parametric tests.
Comparison of radiographic progression in groups of patients by activity/inactivity status of swollen joint counts (SJCs) and C reactive protein (CRP)
Radiographic progression was expected to be highest in patients with active SJC and CRP and lowest in patients with inactive SJC and CRP (table 2). If SJC was inactive, the average progression in joint damage was similar in patients with active and inactive CRP (0.8 vs 0.7, table 2). By contrast, if CRP was inactive, radiographic progression was still determined by SJC status, with patients with active SJC progressing more than those with inactive SJC (1.8 vs 0.7; table 2). The probability plots in figure 1 illustrate graphically the differences in progression.31

Radiographic progression in patient groups defined by activity status of swollen joint count (SJC) and C-reactive protein (CRP). Probability plots depict the radiographic progression (by Sharp/Sharp van der Heijde scores) over 1 year (y axis) in patients treated with traditional disease-modifying antirheumatic drugs (including methotrexate and leflunomide, n=1184) ordered by percentile ranks (x axis). Patients with active CRP (≥1 mg/dl) and active SJC (≥1/28 joints) showed the most radiographic progression (red line). Compared with patients with inactivity by both variables (<1 mg/dl, <1/28 joints) who had the least progression (green line), patients active only for CRP showed the same progression while patients active only for SJC showed significantly more progression. For descriptions of the groups and test statistics see table 2.
Effect of levels of SJC and CRP on radiographic progression
We next developed a GLM including both SJC and CRP as linear variables and their interactions. In this model CRP showed an even more statistically significant association with radiographic progression than SJC (CRP: p=0.0005; SJC: p=0.0058; interaction CRP*SJC: p=0.59), consistent with the prognostic implications of CRP in higher levels of disease activity. However, again when addressing the near remission situation in which one of the two measures is normal, the results were congruent with the main analysis. In a model in patients with inactive SJC, CRP values had no association with progression (p=0.40) while, in contrast, in patients with inactive CRP, SJC was significantly associated (p=0.019).
When we adjusted the model for patients with inactive SJC for age, gender, duration of RA, rheumatoid factor positivity and trial, CRP did not have a significant effect on radiographic progression (p=0.54). However, in patients with inactive CRP, the adjusted effects for SJC on x-ray progression was highly significant (p=0.0025).
Effect of SJC and CRP on radiographic progression in the TNFi monotherapy and combination groups
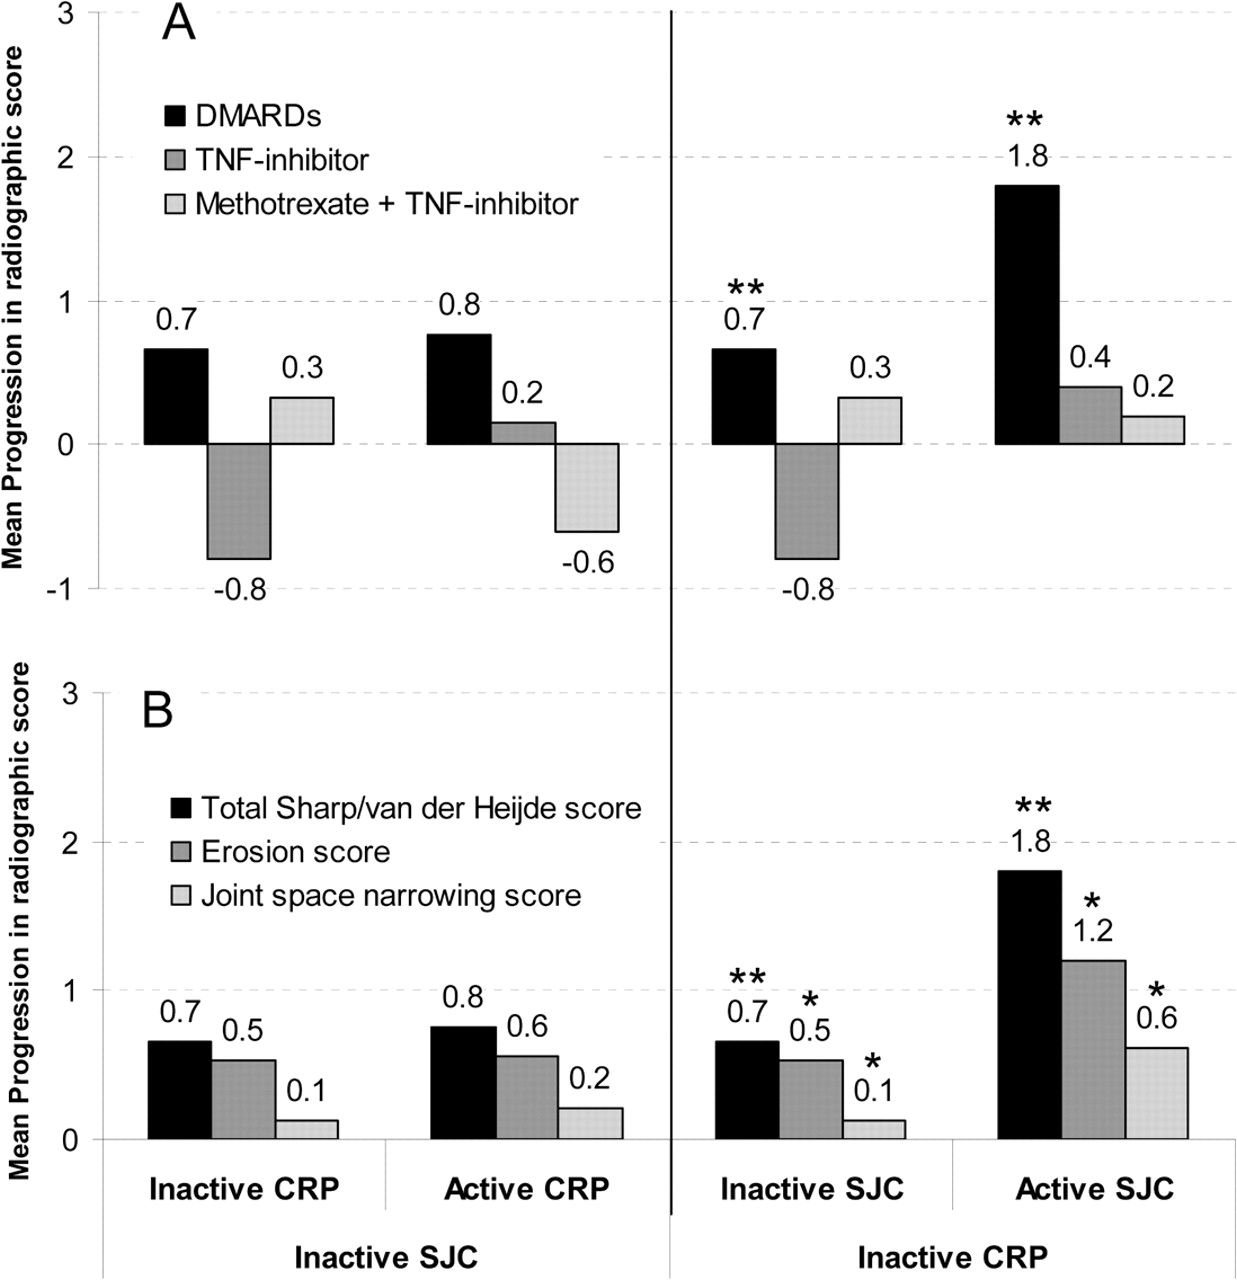
Evaluating TNFi monotherapy (n=419) and TNFi+MTX (n=774), there was no effect of CRP in patients with inactive SJC. However, in these treatment groups, in patients with inactive CRP, the effects of active versus inactive SJC were not significant in either of the treatment groups (figure 2A, right panel, dark grey and light grey bars). Nevertheless, patients with inactive CRP in the TNFi monotherapy group had a numerical difference between those inactive and active for SJC (−0.8±6.5 vs 0.4±2.5, p=NS), while there was no notable numerical difference with TNFi+MTX (0.3±3.1 vs 0.2±4.4). Compared with the DMARD group, a smaller proportion of patients progressed radiographically on TNFi or TNFi+MTX treatment (43.4% and 36.7%, respectively), consistent with the known pronounced effects of TNFi+MTX on structural progression independent of disease activity.

Subgroup analysis by (A) drug regimen (DMARD, including methotrexate (MTX) and leflunomide vs TNFi monotherapy vs TNFi+MTX) and (B) subscale of total Sharp/Sharp van der Heide score (erosion score vs joint space narrowing score). For definitions of activity and inactivity status see legend to figure 1; *p<0.05, **p<0.01 (Wilcoxon test). CRP, C reactive protein; DMARD, disease-modifying antirheumatic drug; JSC, swollen joint count; TNFi, tumour necrosis factor inhibitors.
Effects of SJC and CRP on progression of ERO and JSN
The results observed in the main analysis using the TSS were similar when ERO and JSN were analysed separately. Again, SJC showed effects on progression in the group with inactive CRP but not vice versa (figure 2B, right panel, dark grey and light grey bars).
Sensitivity analysis
In additional sensitivity analyses we tested a different cut-off point for CRP inactivity (<0.5 mg/dl) as well as ESR as APR for distinguishing active from inactive disease. With a CRP <0.5 mg/dl, similar to the cut-off point of <1.0, differences in radiographic progression were significant between patients with inactive SJC and those with active SJC (0.7±4.8/year vs 1.4±4.3/year, p=0.01; figure 3, right panel, black bars). This effect was even more pronounced when we used ESR (cut-off point <20 mm) to define inactivity (0.9±2.2/year for inactive SJC vs 3.3±11.5/year for active SJC, p=0.002; figure 3, right panel, dark grey bars).

Sensitivity analysis of radiographic progression by the Sharp/Sharp van der Heijde scores in groups of patients defined by their activity/inactivity status of clinical and serological inflammation using different definitions of inactive acute phase response as C reactive protein (CRP) <0.5 (left bars) instead of <1 and erythrocyte sedimentation rate (ESR) <20 mm (middle bars) instead of CRP, and also using the 66 swollen joint count (SJC) (right bars) instead of the condensed 28 SJC (keeping the same <1 joint cut-off; CRP activity status defined in this subanalysis as <1). *p<0.05; **p<0.01 (Wilcoxon test). APR, acute phase reactant.
When using the comprehensive 66 SJC in the subset of MTX-treated patients in whom it was available (n=457), there was a higher progression in patients with inactive CRP and active joints (SJC66 ≥1) than in those with inactive CRP and inactive SJC66 (2.8±7.5/year vs 0.6±4.9/year; p=0.003; figure 3, right panel, light grey bars). When using the 28 joint count with a SJC cut-off point of 2 instead of 1 (ie, a somewhat looser definition of absence of swelling), the results were essentially similar although CRP had increased importance in the group of patients without swelling (p=0.04).
Finally, using an inclusive cut-off point of ≤1 instead of <1 to define absence of CRP and SJC,29 the results remained essentially unchanged (data not shown).
These sensitivity analyses confirm that, once patients are truly inactive for SJC, inactivity/activity of the acute phase response measures do not matter with regard to structural progression (p=NS for all; figure 3, left panel). As increasing joint swelling is present, the importance of CRP increases as an additional prognostic marker.
Discussion
In this study we show that, in patients near remission regarding radiographic progression of RA, the impact of SJCs as a clinical surrogate of inflammation is significantly higher than the impact of laboratory markers of inflammation (as typically measured by CRP levels or ESR).
Although it is well known that both of these measures of inflammation are independent determinants of radiographic progression, previous data have mostly related to associations of inflammation over the complete range of disease activity. It is obvious that radiographic progression increases in patients with high levels of overall inflammation regardless of which variable is studied, mostly because serological and clinical measures would be partly collinear or redundant. Indeed, in the GLM performed on the total DMARD-treated population, CRP and SJC were significantly associated with joint damage with CRP being associated to a somewhat higher degree.
However, in the past few years a state of remission or near remission has become achievable for a significant proportion of patients with RA with new therapeutic strategies and regimens.32 However, a common clinical dilemma in these patients is the interpretation of success of the anti-inflammatory effects of DMARDs such as MTX. For example, patients may have no laboratory signs of inflammation but have residual joint activity (swelling) or, conversely, patients may have no clinical swelling but have residual inflammatory markers on blood testing. Our data indicate that the SJC constitutes a more important target than CRP in these situations, calling for some therapeutic means such as adaptation of ongoing therapy or glucocorticoid injections into joints.
While SJC and CRP levels are usually correlated, it is conceivable that a low level of inflammation in a few small joints is not accompanied by sufficient cytokine production to induce CRP but will still allow for progression of joint damage locally. It is also possible that, in such patients, the cytokine response comprises other proinflammatory cytokines but not high levels of interleukin 6, the pivotal driver of the acute phase response.33 Furthermore, it has been observed that RA can be clinically active without abnormal APR levels.34 The new RA classification criteria even anticipated such situations, since the presence of an elevated acute phase response is not essential for classifying RA.35 However, it is also possible that the reverse situation is present, in which clinical joint swelling is absent but the APR levels are raised. Since comorbidity causing an increase in the CRP level is unlikely in a clinical trial setting and the APR level was averaged over a 6-month period, subclinical synovitis could have led to increased CRP levels but that would mean that subclinical joint involvement does not lead to joint destruction.
It is also worth mentioning that the data obtained solely relate to treatment with synthetic DMARDs. The same analyses performed in patients treated with a combination of TNFi+MTX did not show progression of joint damage in patients with residual swollen joints and a normal acute phase response, confirming previous notions on the dissociation of the tight relationship between the inflammatory response and joint destruction with such treatment.36
One limitation of our study is that it is a secondary data analysis of clinical trials, which were not designed to test the hypothesis of our study. Some of the outcome measures, especially radiographic scores, were not obtained by the same method (Sharp scores in some, van der Heijde Sharp scores in other trials) nor by the same readers. While this would be of concern if radiographic efficacy analyses were the main goal, it is unlikely that, for the research purpose used here, these differences are relevant. Furthermore, trial patients may differ from patients seen in clinical practice, and our data will therefore require validation in a clinical cohort setting. However, the fact that we pooled trial cohorts probably adds to the overall generalisability of the results obtained.
In conclusion, our data suggest that, when treating patients with very low levels of disease activity, the relevance of APR might be small. The data further confirm the importance of joint assessment in follow-up examinations of patients with RA, and also indirectly support previous notions on the value of using composite measures of disease activity rather than assessing individual variables during follow-up.11 37 38 Moreover, especially in the situation of low disease activity, it may be sufficient to evaluate clinical disease activity alone using scores such as the Clinical Disease Activity Index39 and even to disregard laboratory markers of, at least for therapeutic decisions related to RA in clinical practice.
Acknowledgments
The authors thank Abbott, Amgen, Centocor, Sanofi-Aventis and Pfizer (formally Wyeth) for kindly providing us with data from their clinical trials.
References
Footnotes
-
Funding This study was supported through Coordination Theme 1 (Health) of the European Community's FP7; Grant Agreement number HEALTH-F2-2008–223404 (Masterswitch). This is a publication of the Joint and Bone Center for Diagnosis, Research and Therapy of Musculoskeletal Disorders of the Medical University of Vienna.
-
Competing interests DA: expert advice or speaker for Abbott, BMS, MSD, UCB, Pfizer, Roche. FA: none. JSS: grant/research support from Abbott, BMS, MSD, Pfizer, Roche; expert advice or symposia presentations for Abbott, Amgen, BMS, MSD, Pfizer, Roche, Sanofi-Aventis, UCB.
-
Provenance and peer review Not commissioned; externally peer reviewed.