Article Text

Abstract
Objective: To develop evidence based recommendations for the diagnosis of gout.
Methods: The multidisciplinary guideline development group comprised 19 rheumatologists and one evidence based medicine expert, representing 13 European countries. Ten key propositions regarding diagnosis were generated using a Delphi consensus approach. Research evidence was searched systematically for each proposition. Wherever possible the sensitivity, specificity, likelihood ratio (LR), and incremental cost-effectiveness ratio were calculated for diagnostic tests. Relative risk and odds ratios were estimated for risk factors and co-morbidities associated with gout. The quality of evidence was categorised according to the evidence hierarchy. The strength of recommendation (SOR) was assessed using the EULAR visual analogue and ordinal scales.
Results: 10 key propositions were generated though three Delphi rounds including diagnostic topics in clinical manifestations, urate crystal identification, biochemical tests, radiographs, and risk factors/co-morbidities. Urate crystal identification varies according to symptoms and observer skill but is very likely to be positive in symptomatic gout (LR = 567 (95% confidence interval (CI), 35.5 to 9053)). Classic podagra and presence of tophi have the highest clinical diagnostic value for gout (LR = 30.64 (95% CI, 20.51 to 45.77), and LR = 39.95 (21.06 to 75.79), respectively). Hyperuricaemia is a major risk factor for gout and may be a useful diagnostic marker when defined by the normal range of the local population (LR = 9.74 (7.45 to 12.72)), although some gouty patients may have normal serum uric acid concentrations at the time of investigation. Radiographs have little role in diagnosis, though in late or severe gout radiographic changes of asymmetrical swelling (LR = 4.13 (2.97 to 5.74)) and subcortical cysts without erosion (LR = 6.39 (3.00 to 13.57)) may be useful to differentiate chronic gout from other joint conditions. In addition, risk factors (sex, diuretics, purine-rich foods, alcohol, lead) and co-morbidities (cardiovascular diseases, hypertension, diabetes, obesity, and chronic renal failure) are associated with gout. SOR for each proposition varied according to both the research evidence and expert opinion.
Conclusions: 10 key recommendations for diagnosis of gout were developed using a combination of research based evidence and expert consensus. The evidence for diagnostic tests, risk factors, and co-morbidities was evaluated and the strength of recommendation was provided.
- ESCISIT, EULAR Standing Committee for International Clinical Studies Including Therapeutics
- EULAR, European League Against Rheumatism
- ICER, incremental cost-effectiveness ratio
- LR, likelihood ratio
- MSU, monosodium urate
- SOR, strength of recommendation
- SUA, serum uric acid
- VAS, visual analogue scale
- EULAR
- guidelines
- gout
- diagnosis
Statistics from Altmetric.com
- ESCISIT, EULAR Standing Committee for International Clinical Studies Including Therapeutics
- EULAR, European League Against Rheumatism
- ICER, incremental cost-effectiveness ratio
- LR, likelihood ratio
- MSU, monosodium urate
- SOR, strength of recommendation
- SUA, serum uric acid
- VAS, visual analogue scale
Gout is a prevalent disease that results from urate crystal deposition. It affects up to 1–2% of adults and is the most common inflammatory arthritis in men. The prevalence increases with age to rates up to 7% in men aged over 65 and to 3% in women aged over 85.1,2 Despite reasonable understanding of its pathogenesis and the availability of effective treatment, gout is often misdiagnosed or diagnosed late in its clinical course and even when correctly diagnosed treatment is often suboptimal.3–5 Therefore, the European League Against Rheumatism (EULAR) gout task force was formed to develop evidence based recommendations on aspects relating to the diagnosis and management of gout. This paper reports the first part of the project: evidence based recommendations for the diagnosis of gout.
METHODS
Participants
A multidisciplinary guideline development group was commissioned by the EULAR Standing Committee for International Clinical Studies Including Therapeutics (ESCISIT). Nineteen rheumatologists and one evidence based medicine expert representing 13 European countries agreed to take part in the study. The objectives were first, to agree 10 key propositions related to the diagnosis of gout; second, to identify and critically appraise research evidence for the diagnostic tests, risk factors, and co-morbidities associated with gout; and third, to generate recommendations based on a combination of the best available evidence and expert opinion.
Expert consensus
Each participant was asked to contribute independently up to 10 propositions related to key clinical aspects in the diagnosis of gout. Consensus regarding the propositions was reached using the Delphi technique. The initial propositions were collated into a single list. Similar, substantially overlapping propositions were combined. The list was then returned to the experts and they were asked to select the 10 most important from the list. Propositions were accepted if over half the participants selected them in any round, while propositions receiving only one to three votes were removed. Propositions receiving less than 50% of the votes but more than three votes entered the next Delphi round. The procedure was repeated until 10 propositions were agreed.6
Systematic search of published reports
A systematic search of the papers published between 1945 and January 2005 was undertaken for both diagnosis and management of gout using MEDLINE (1966–), Old MEDLINE (1950–), EMBASE (1980–), CINAHL (1980–), Science Citation Index (1945–), and Cochrane Library databases (1996–). The search included both a general search and a proposition specific search. The general search strategy consisted of two basic components: gout in whatever possible terms in the databases (appendix 1), and types of research in the forms of systematic review/meta-analysis, randomised controlled trial (RCT)/controlled trial, uncontrolled trial, cohort study, case–control study, cross sectional study, and economic evaluation (appendix 2) (the appendices are available on the journal website as supplementary material (http://www.annrheumdis.com/supplemental)). The two components were combined to search for the current available research evidence from the literature for gout. The summary results of this search were reported to the committee before the Delphi exercise.
After the Delphi exercise, the proposition specific search was undertaken to identify evidence for each specific proposition. The search strategy included the terms for gout (appendix 1) and any possible terms for the specific component of each proposition. For example, “monosodium urate crystal”, “synovial fluid analysis”, and “tophus aspiration” were used for monosodium urate (MSU) crystal identification. The results of the general search and the proposition specific search were then combined and duplications excluded. Medical subject heading search (MeSH), together with key word search, was used whenever possible. All MeSH search terms were exploded. The reference lists within reviews or systematic reviews were examined and any additional studies meeting the inclusion/exclusion criteria were included.
The search in the Cochrane Library included MeSH search of the Cochrane review, abstracts of Quality Assessed Systematic Reviews, the Cochrane Controlled Trial Register, NHS Economic Evaluation Databases, Health Technology Assessment Database, and NHS Economic Evaluation Bibliography, Details Only. In addition, a topics search on gout was undertaken.
Inclusion/exclusion criteria
Studies retrieved from the literature search were scrutinised and only studies with a clinical diagnosis of gout were included. Studies for hyperuricaemia were included only if serum uric acid was measured for diagnostic purposes or as a risk factor for gout. The main focus of interest was on systematic reviews/meta-analyses, randomised controlled trials/controlled trials, uncontrolled trial, cohort studies, case–control studies, cross sectional studies, or economic evaluations. Case reports, review articles, editorials, and commentaries were excluded, as were studies on healthy subjects or animals.
Level of evidence
Evidence was categorised according to study design. Three study designs are usually used for diagnostic tests: cohort studies, case–control studies, and uncontrolled descriptive studies. As systematic reviews/meta-analyses of each design may increase the power of the estimate and allow evaluation of the variance of the estimate across studies, their quality was considered to be higher than that of any single study (table 1). Cohort studies were graded higher than case–control studies, as they estimate the relation prospectively before disease expression and are therefore more specific and less likely to be confounded. Questions were answered using the best available evidence. For example, if a question could be answered by level Ia evidence (for example, a systematic review of cohort studies) then studies with a weaker design (such as cohort studies, level IIa) were not reviewed. Results of the latest systematic review were used if there was more than one systematic review for the same question.
Level of evidence*
Outcome measures
Validity
Diagnostic tests were assessed for validity and reliability. Validity was evaluated by sensitivity and specificity. Sensitivity is the proportion of true positives that are correctly identified by the test, whereas specificity is the proportion of true negatives that are correctly identified by the test.7 The ideal test would have a value of 1 for both sensitivity and specificity—that is, 100% sensitive and specific. However, in real life this is rarely possible and as sensitivity increases specificity often decreases. For example, increasing the cut off of serum uric acid (SUA) level would reduce the sensitivity but increase the specificity of the test in the detection of gout. We therefore calculated the likelihood ratio (LR) using sensitivity/(1−specificity) to produce an overall trade off index for both variables.8 LR summarises how many times more (or less) likely patients with gout are to be test positive than patients without gout. An LR greater than 1 indicates that the test result is associated with the presence of gout, whereas an LR less than 1 indicates that the test result is associated with absence of gout. LRs above 10 or below 0.1 are considered to be strong evidence to respectively rule in or rule out a diagnosis in most circumstances.8 In addition, LR allows users to predict the probability of gout for a patient, based on the risk of the source population.
Reliability
The reliability of a test was assessed using the κ statistics (dichotomous data) and intraclass correlation analysis (continuous data) if repeat measures were available.
Relative risk and odds ratio
For risk factors and co-morbidities associated with the diagnosis of gout, the relative risk (RR) and odds ratio (OR) were calculated. The RR was estimated from cohort studies (for incident risk) or cross sectional studies (for prevalent risk), whereas the OR was calculated from case–control studies.9 Both present how many times more likely (or less likely) subjects who are exposed to a risk factor are to have gout than those who are not exposed to the same risk factor. RR/OR = 1 indicates no relation, whereas RR/OR >1 or <1 indicates positive or negative relations between the risk factor and gout.
Incremental cost-effectiveness ratio
For economic evaluations, the incremental cost-effectiveness ratio (ICER) was calculated for the different costs between two diagnostic tests (for example, the cost of a 24 hour urine test minus the cost of the spot urine test), divided by the different diagnostic values (sensitivity, specificity, or LR) between the two tests. In addition, the study design, comparator, perspective, time horizon, discounting, total costs, and effectiveness were critically appraised.
The outcomes are presented with the point estimate (for example, the mean) and 95% confidence interval (CI) unless otherwise stated. Statistical pooling was undertaken as appropriate10 when there was more than one estimate for the same outcome using the same study design, and a systematic review was not available.
Ratification of proposition and strength of recommendation
Following the literature search and the initial drafting of the manuscript the task force met to discuss each proposition. At this stage, the wording (but not the content) of propositions could be adjusted to clarify specific statements and to reduce any ambiguity if the majority of the task force agreed. The 10 propositions were then ratified and a final adjusted manuscript was approved by all task force members.
The strength of recommendation (SOR) was graded using the EULAR ordinal scale and visual analogue scale (VAS).6 Each participant was asked to score their SOR for each proposition using both a 0–100 mm VAS and an A–E ordinal scale (A = fully recommended, B = strongly recommended, C = moderately recommended, D = weakly recommended, and E = not recommended). Participants were asked to determine their scores by taking into account both the research evidence (sensitivity, specificity, LR, and cost-effectiveness, if available) and their clinical expertise (logistics, patient perceived acceptance, and tolerability). The mean VAS and 95% CI and the percentage of strongly to fully recommended (A–B) were calculated.
Future research agenda
After the initial 10 propositions for diagnosis had been searched, reviewed, and discussed by the task force, each participant was asked to propose 10 topics for the future research agenda based on currently available evidence and clinical experience in the diagnosis of gout. Similar substantially overlapping propositions were combined and then a Delphi approach was used to reach a consensus on the 10 most important topics. The same criteria as those used to select diagnostic propositions were employed (that is, accepted: more than 50% votes; removed: fewer than three votes; next round: less than 50% but more than three votes).
RESULTS
General literature search
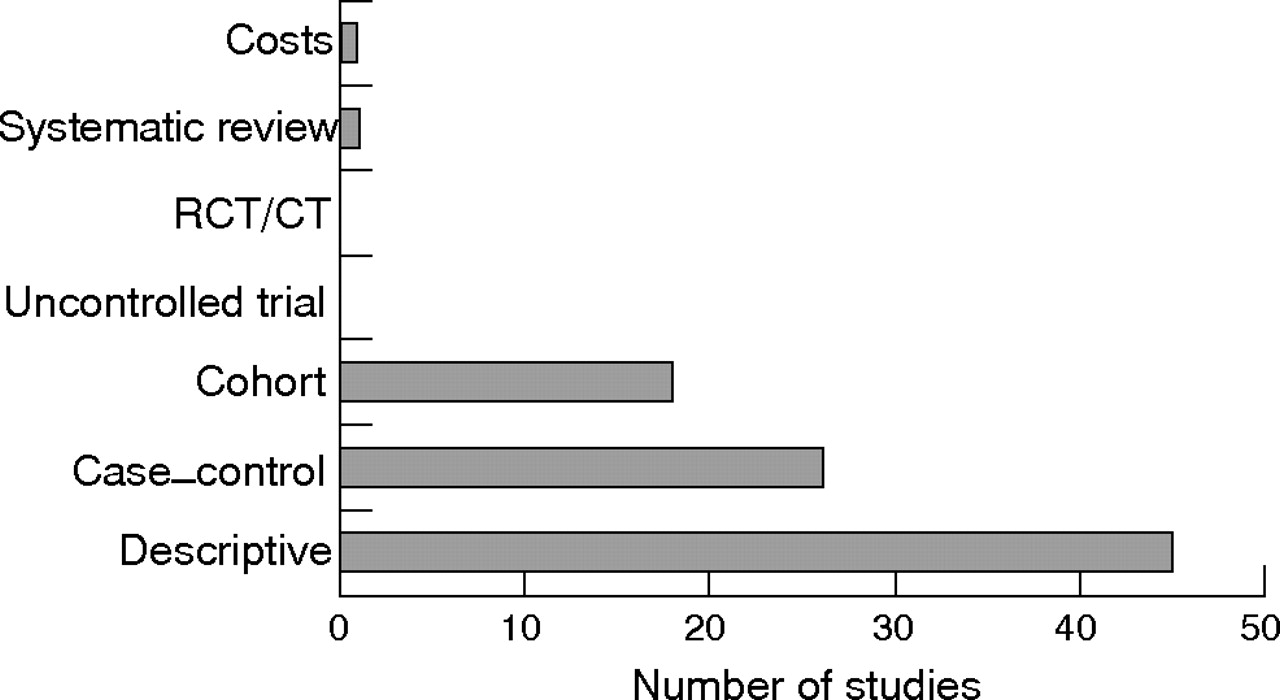
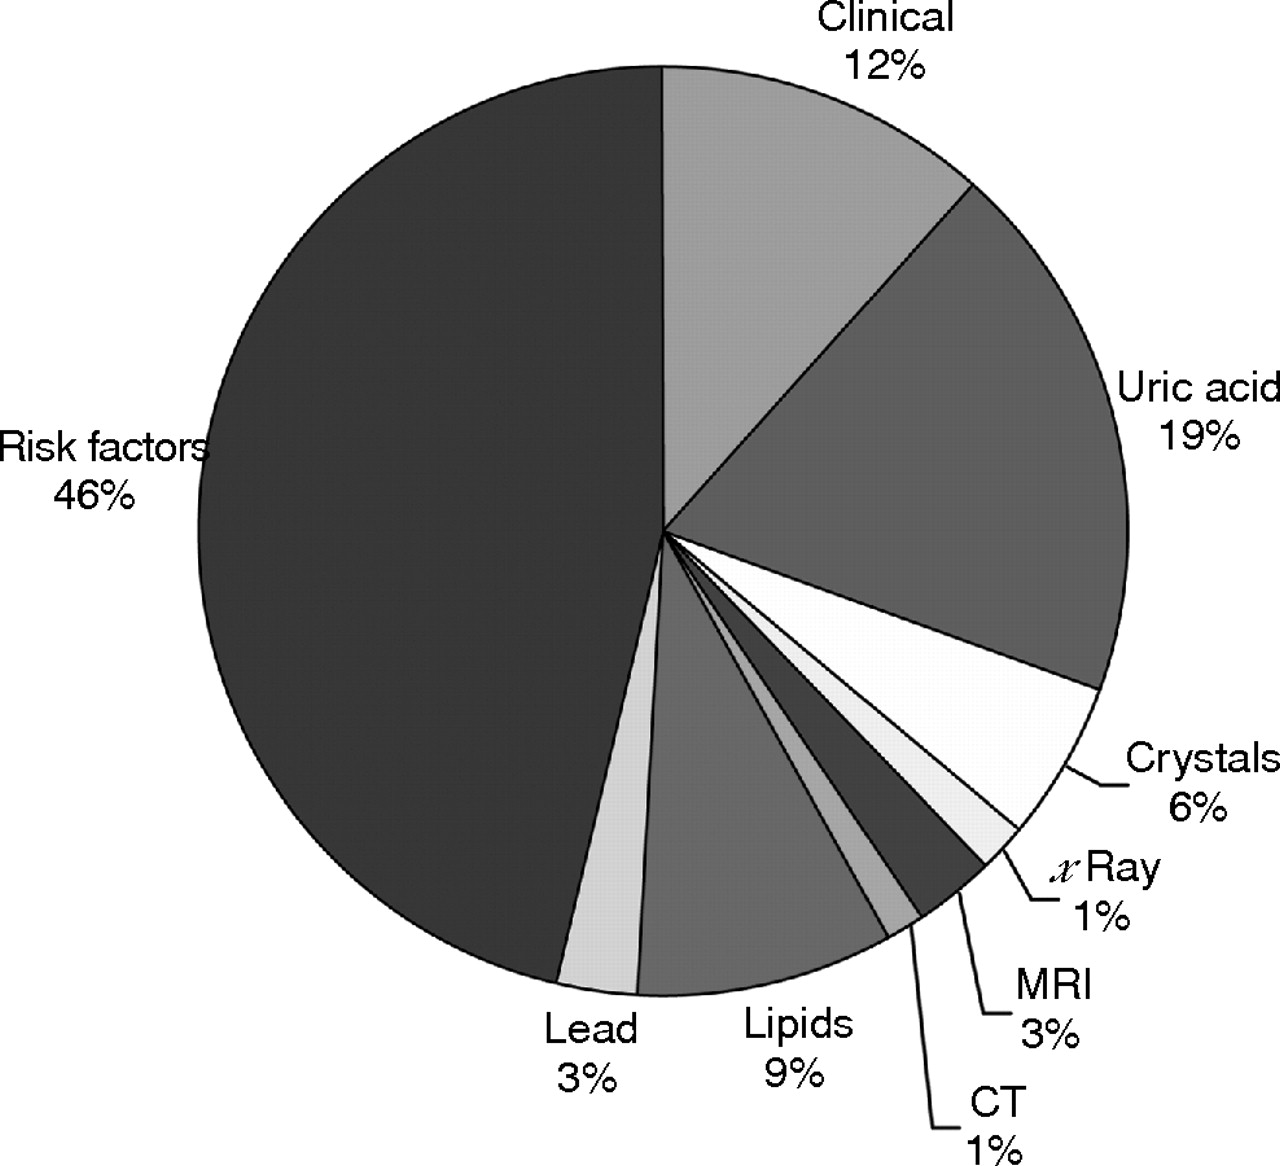
The general search yielded 3316 hits. The breakdown, based on the types of evidence and databases, is shown in table 2. After deleting duplications within and between databases, 2352 hits remained. Of these, only 181 studies met inclusion/exclusion criteria, including 83 for diagnosis, 86 for management, and 12 for both. The remainder were narrative reviews, commentaries, editorials, and case reports. Figure 1 shows the breakdown according to examination elements for diagnosis. Figure 2 shows categories of evidence according to study designs.
General literature search for types of research evidence on gout*

Elements involved in the diagnosis of gout. CT, computed tomography; MRI, magnetic resonance imaging.
Types of evidence for the diagnosis of gout. CT, controlled trial; RCT, randomised controlled trial.
Expert’s opinion approach
The experts were informed of the results of the general literature search, and then the Delphi exercise was undertaken by email. The first round produced 127 propositions for diagnosis. After three anonymous Delphi rounds, 10 final propositions were agreed (table 3). The wordings of four of these propositions (1, 7, 8, and 10) were adjusted for clarification of key points at the final meeting.
Propositions and strength of recommendation (SOR): order according to topic (clinical, urate crystals, biochemical, radiographic, and risk factors/comorbidities)
Assessment of propositions
The proposition specific search was then undertaken and the results were merged with the results from the general search to form the basis of evidence for the evaluation of each proposition or modalities within each proposition. The following propositions are grouped by topic (clinical, urate crystals, biochemical, radiographic, and risk factors/co-morbidities) with no weighting according to order.
1. In acute attacks the rapid development of severe pain, swelling, and tenderness that reaches its maximum within just 6–12 hours, especially with overlying erythema, is highly suggestive of crystal inflammation though not specific for gout.
Strength of recommendation: 88 (95% CI, 80 to 96)
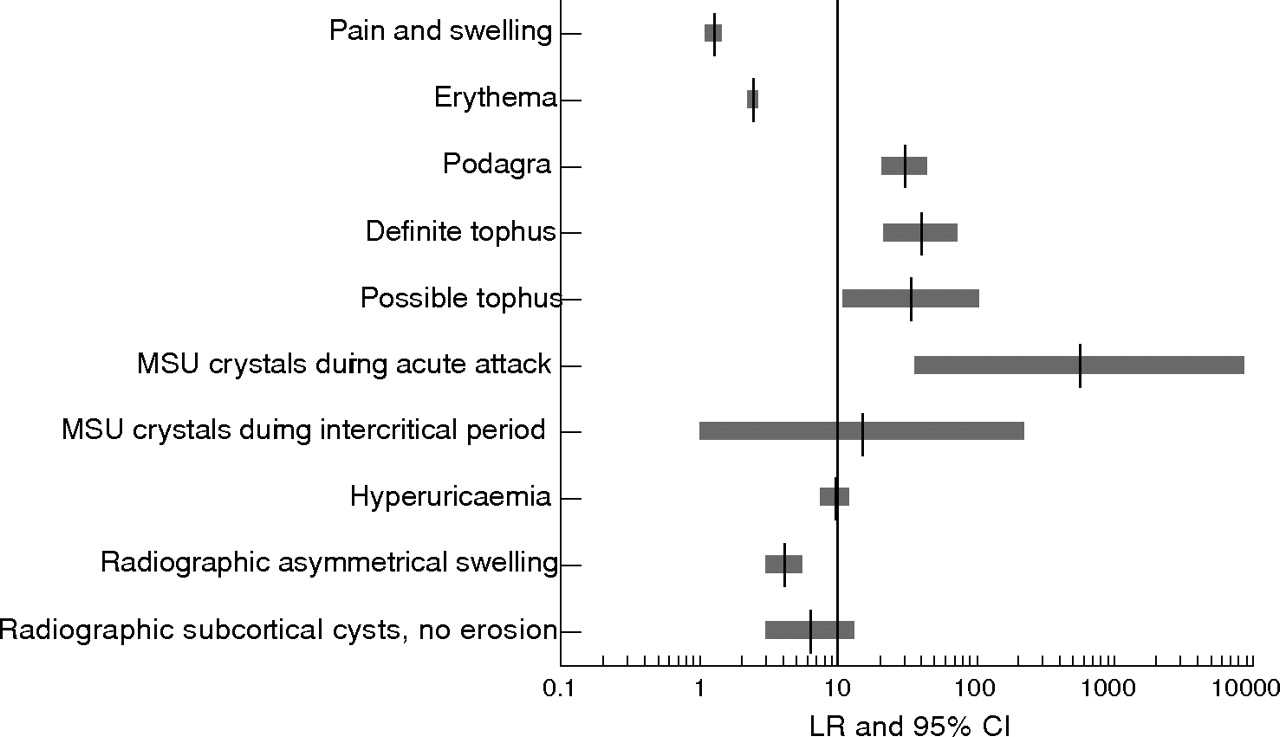
One multicentre case–control study was undertaken in Europe—including Manchester, Paris, Moscow, Heinola, Piestanny, and Sofia—through a WHO fellowship programme.11 Fifty nine patients with gout and 761 patients with other musculoskeletal diseases were recruited from rheumatology outpatient settings. The gold standard diagnosis was established on the basis of the clinician’s opinion. Composite diagnostic criteria of painful joint, swelling, attacks with abrupt onset of severe pain, and remission within two weeks were examined. This composite had very high sensitivity (0.98 (95% CI, 0.95 to 1.02)) but very low specificity (0.23 (0.10 to 0.35)). LR was 1.27 (1.08 to 1.50), suggesting only limited diagnostic value of this criteria set for the presence of gout. It was less specific than classic podagra and the presence of tophus (table 4). (NB: Although “podagra”, as in this document, is commonly used to describe acute attacks affecting the first metatarsophalangeal joint, podagra literally means “seizing the foot”.) Erythema has been investigated as a diagnostic criterion in another similarly sized case–control study in the USA (table 4).12 The diagnostic value of erythema was slightly higher than the composite of pain and swelling (fig 3). It is recognised that rapid onset, severely painful, self limiting attacks of synovitis with erythema may be produced by other crystal associated synovitis syndromes (for example, calcium pyrophosphate dihydrate crystal or pseudogout) and by septic or reactive arthritis, although involvement of the first metatarsophalangeal joint and tophi are both more specific for gout. However, as the gold standard of these studies was not urate crystal presence the results have yet to be confirmed.
Evidence of diagnostic test: sensitivity, specificity, and likelihood ratio

Likelihood ratio (LR) and 95% confidence interval (CI) for various features in the diagnosis of gout. MSU, monosodium urate
In conclusion, rapid onset of severe pain, swelling, and erythema that is self limiting, while indicative of crystal associated synovitis, appears to have limited diagnostic value specifically for gout (level IIb evidence). Further evidence using urate crystal presence as the gold standard for diagnosis is still required.
2. For typical presentations of gout (such as recurrent podagra with hyperuricaemia) a clinical diagnosis alone is reasonably accurate but not definitive without crystal confirmation.
Strength of recommendation: 95 (95% CI, 91 to 98)
Unlike pain, swelling, and erythema, podagra has very high sensitivity (0.96 (95% CI, 0.91 to 1.01) and specificity (0.97 (0.96 to 0.98)).11,12 An LR of 30.64 (20.51 to 45.77) confirms that this presentation has excellent diagnostic value for gout (table 4; fig 3). Other conditions, such as calcific periarthritis cause by apatite crystal deposition, may produce “pseudo-podagra”, but these are relatively rare. There are no data for both podagra and hyperuricaemia, but the LR of this combination is likely to be higher than for podagra alone.
In conclusion, classic podagra is an excellent clinical marker for an acute attack of gout (level Ib evidence). However, the results are based on clinically diagnosed gout and further evidence using urate crystal presence as the gold standard is still required.
3. Demonstration of MSU crystals in synovial fluid or tophus aspirates permits a definitive diagnosis of gout
Strength of recommendation: 96 (95% CI, 93 to 100)
Two systematic reviews have examined the value of synovial fluid analysis in the diagnosis of joint disease.18,19 Of the 200 studies included in the latest review, six relate to MSU crystal identification.19 The gold standards for these studies were crystal samples predefined by expert investigators. The studies aimed to compare results between different observers or between laboratories. Sensitivity ranged from 0.63 to 0.78 and specificity from 0.93 to 1.00; the inter-observer reliability (κ) ranged from 0.35 to 0.63. Therefore, although training and quality control relating to crystal identification is clearly an important issue, identification of MSU crystals is a reliable investigation when undertaken by experienced operators.
A multicentre case–control study was undertaken in the USA to examine various clinical features and investigations, including MSU crystal identification, in the diagnosis of acute gout.12 The study compared the features of patients with established gout, diagnosed by experienced rheumatologists, with features of patients diagnosed with other joint diseases such as pseudogout, rheumatoid arthritis, and septic arthritis. The results showed reasonable sensitivity (0.84 (95% CI, 0.77 to 0.92)) and extremely high specificity (1.00 (0.99 to 1.00)) and LR (566.60 (35.46 to 9053.50)) for the presence of MSU crystals during an acute attack (table 4; fig 3).
In conclusion, the detection of MSU crystals has excellent value in the diagnosis of symptomatic gout (level IIb). However, the results of this test may vary between observers and laboratories (level Ib), which has implications for training and quality control for this investigation, and its cost-effectiveness merits further investigation.
4. A routine search for MSU crystals is recommended in all synovial fluid samples obtained from undiagnosed inflamed joints.
Strength of recommendation: 90 (95% CI, 83 to 97)
Although there are no direct comparative studies, examination of synovial fluid for MSU crystals should be an investigation undertaken for undiagnosed inflammatory arthritis as gout is a prevalent cause of joint inflammation and may present atypically (level IV evidence).
5. Identification of MSU crystals from asymptomatic joints may allow definite diagnosis in intercritical periods.
Strength of recommendation: 84 (95% CI, 78 to 91)
Several case series studies have identified MSU crystals in synovial fluid aspirated from the asymptomatic first metatarsophalangeal joint or knee of patients with proven gout during the intercritical period, even in synovial fluid from joints that had not been subject to a previous acute attack.20,21 In these studies synovial fluid urate crystal identification was positive in approximately 70% of patients. This finding was confirmed by a small case–control study in which synovial fluid urate crystals were identified in asymptomatic joints aspirated during intercritical periods from 16 of 23 patients (70%) with known crystal proven gout, but in none of 10 asymptomatic joints of normouricaemic controls with other types of arthritis, giving a sensitivity of 0.70 (95% CI, 0.50 to 0.87), a specificity of 0.95 (0.83 to 1.08), and an LR of 15.13 (0.99 to 229.95).13 In addition, urate crystals can be identified in a small proportion of hyperuricaemic subjects who have never experienced gout (one of 19 healthy people with asymptomatic hyperuricaemia and two of nine hyperuricaemic patients with renal failure13), thus confirming gout in its preclinical phase. Conversely, detection of MSU crystals from asymptomatic joints of patients with confirmed gout can become negative with time if appropriate urate lowering treatment has been instituted.22
In conclusion, MSU crystals can be detected during the intercritical period (level IIb evidence) and are highly likely to confirm the diagnosis if previously inflamed joints of untreated patients are examined. In treated patients with normal or low SUA levels, the detection rate depends on the duration and effectiveness of urate lowering treatment.
6. Gout and sepsis may coexist, so when septic arthritis is suspected Gram staining and culture of synovial fluid should still be performed, even if MSU crystals are identified.
Strength of recommendation: 93 (95% CI, 87 to 99)
There are reported cases of patients with coexistent sepsis and gout occurring in the same joint. Among 30 such cases reported by Yu et al,23 all fulfilled American Rheumatism Association criteria for acute gout,12 19 had positive MSU crystal identification, and 25 had subcutaneous tophi; one patient required above-knee amputation and two died. Organisms were identified in synovial fluid culture in 73% of these patients. This is similar to the 76% positive culture rate in the septic arthritis patient group included in the study by Wallace et al to test diagnostic criteria for gout12; in that study, 4% of patients with septic arthritis had coexistent gout (tophi but not MSU crystal identification).12 The discriminative value of synovial fluid culture between septic arthritis and gout is quite high (sensitivity 0.76 (95% CI, 0.68 to 0.84); specificity 0.96 (0.90 to 1.01); LR = 18.61 (4.77 to 72.63)). This is an important clinical message as septic arthritis is a treatable cause of rapid joint destruction that carries significant associated morbidity and mortality. Therefore in clinical situations where sepsis is suspected full investigation for sepsis, including synovial fluid Gram stain and culture, should be undertaken, even if the more rapidly performed test of MSU crystal identification has confirmed gout as a diagnosis (level IIb evidence).
7. While being the most important risk factor for gout, serum uric acid levels do not confirm or exclude gout, as many people with hyperuricaemia do not develop gout, and during acute attacks serum levels may be normal.
Strength of recommendation: 95 (95% CI, 92 to 99)
Two population based cohort studies, one of New Zealand Maoris24 and one of North Americans,25 have examined whether higher SUA levels associate with a higher incidence of gout. During the 11 year follow up period of the first study,20 the age standardised incidence of gout was over four times higher in men (RR = 4.57 (95% CI, 1.11 to 18.84)) and 17 times higher in women (RR = 16.90 (95% CI, 2.21 to 129.07)) who had SUA ⩾6 mg/dl (360 μmol/l) compared with those with SUA below this level.24 This finding was supported by the US Normative Aging Study which followed for 15 years 2046 healthy subjects who were free of gout at baseline.25 Levels of SUA were categorised as <6, 6–, 7–, 8–, 9– and 10– mg/dl. The RR per level increase was 2.33 (95% CI, 2.00 to 2.71), adjusted by age, body mass index (BMI), serum lipid and glucose levels, hypertension, alcohol intake, and socioeconomic status using the Cox regression model.
Such data have encouraged the use of an SUA level of 6 mg/dl (360 μmol/l)—which is below the theoretical saturation point for MSU crystals—as a convenient cut off point for a risk factor for gout. Five case–control studies with sufficient data for calculation of sensitivity and specificity have been identified.11,14–16,26 The results show that the cut off level of 6 mg/dl (360 μmol/l) has moderate sensitivity (0.67 (95% CI, 0.47 to 0.87)) and specificity (0.78 (0.51 to 1.05)). Not surprisingly, a higher cut off index (>7 mg/dl or 420 μmol/l) has reduced sensitivity (0.57 (0.44 to 0.70)) but increased specificity (0.92 0.93 to 0.94)). Nevertheless, when using different criteria for men and women, the LR increases substantially, from 3.00 (95% CI, 0.85 to 10.57)) to 7.61 (5.31 to 10.91)), indicating an overall improvement (table 4). These results are supported by a cohort study where the level of 6 mg/dl (360 μmol/l) was less appropriate for men (LR = 1.32 (95% CI, 1.14 to 1.52)) than for women (LR = 2.47 (1.96 to 3.12)), as men have higher mean levels of SUA than women.24 In practice most laboratories calculate their own cut off level for hyperuricaemia as the mean plus two standard deviations from their local healthy population (calculated separately for men and women). This may further increase LR up to 9.74 (7.45 to 12.72), as shown by Wallace and colleagues12 (table 4).
Nevertheless, although a raised SUA level is a major risk factor for gout, many people with high SUA levels do not have gout. Conversely, individual patients who present with MSU crystal proven gout may have normal SUA levels at the time of investigation.27 One reason for this could be that SUA behaves as a negative acute phase reactant, being temporarily lowered during episodes of acute inflammation and stress.28 Two studies of patients with gout have reported lower SUA levels, even within the normal range, when measured during acute attacks, compared with raised SUA levels when measured in intercritical periods.29,30 An increase in renal excretion of uric acid during acute episodes is also suggested as the mechanism.28 In some patients the prior risk factors for hyperuricaemia may have been modified or removed at the time of presentation with gout (for example, cessation of diuretic, reduction of obesity or beer intake). Thus SUA has limited diagnostic value, especially during an acute attack of gout.
In conclusion, hyperuricaemia is one of the risk factors for gout (level IIa evidence). The definition of hyperuricaemia varies between populations, and men usually have higher levels of SUA than women. Therefore different diagnostic levels based on the normal range of SUA for the local population may be more valuable if SUA is to be used for diagnostic purposes (level Ib evidence). However, care must be taken as some individuals may develop gout without raised SUA, or may have a normal SUA during an acute attack.
8. Renal uric acid excretion should be determined in selected gout patients, especially those with a family history of young onset gout, onset of gout under age 25, or with renal calculi.
Strength of recommendation: 72 (95% CI, 62 to 81)
Three case–control studies met the inclusion/exclusion criteria for this proposition. All were hospital based studies comparing the 24 hour urinary uric acid/creatinine ratio (Uur/Ucr) between subjects with gout and those without.31–33 Gout was diagnosed on the basis of either the American Rheumatism Association criteria12 or the presence of synovial fluid MSU crystals. In addition, subjects with gout were categorised into three groups, according to urine uric acid excretion, as overexcreters, normoexcreters, and underexcreters. Overexcretion of uric acid was defined by a 24 hour urinary uric acid excretion of ⩾1000 mg/day with regular diet, while underexcretion was defined by a uric acid clearance of <6 ml/min.31 The results showed no differences of Uur/Ucr ratio between gout and non-gout patients (p>0.05). However, within the gout patients, a graded Uur/Ucr ratio was observed, with the highest ratio in uric acid overexcreters, followed by normoexcreters and underexcreters (p<0.05). In addition, patients treated with allopurinol had a lower Uur/Ucr ratio than those without (p<0.05).32 One study also examined a spot urine test for this ratio.31 Unfortunately, the ratio was similar in all group comparisons, including overexcreters versus normoexcreters. However, using mean plus two standard deviations in subjects with normal uric acid excretion as a cut off value to define overexcretion, the early morning spot urine sample and the 24 hour sample had similar sensitivity (0.25) but the 24 hour test had greater specificity than the spot test (24 hour, 0.99; spot, 0.96).
In conclusion, tests for urinary excretion status such as the uric acid to creatinine ratio may be useful to identify overexcretion of uric acid for treatment purpose (level IIb evidence). This may be undertaken by collecting a 24 hour urine sample or an early morning spot urine sample, but the robustness of the latter and its cost-effectiveness need further evaluation.
9. Although radiographs may be useful for differential diagnosis and may show typical features in chronic gout, they are not useful in confirming the diagnosis of early or acute gout.
Strength of recommendation: 86 (95% CI, 79 to 94)
Although radiographs of joints affected by gout are frequently normal (apart from non-specific soft tissue swelling), non-comparative case series analyses have identified radiographic changes in all stages of gout, even in clinically silent cases.34,35 A multicentre case–control study suggested that the radiographic evidence of asymmetrical swelling and subcortical cysts without erosion may be useful (LR 4.13 and 6.39, respectively) to differentiate chronic gout from other joint conditions (fig 3) (level IIb). A further case–control study matched by age, sex, and disease duration showed that radiographs had some value in detecting the severity of tophi.17 Patients with intradermal tophi were more likely to have severe radiographic changes, supporting the clinical impression that the more specific radiographic features for gout tend to occur late in the evolution of the disease (table 4) (level IIb). Thus radiographs play only a minor role in diagnosis in most patients with gout, though in late or severe disease characteristic radiographic features may be present.
10. Risk factors for gout and associated co-morbidity should be assessed, including features of the metabolic syndrome (obesity, hyperglycaemia, hyperlipidaemia, hypertension).
Strength of recommendation: 93 (95% CI, 88 to 98)
Various epidemiological studies have examined the risk factors and associations of gout, including one cohort study and four case–control studies relevant to this proposition. The cohort study compared the incident rates of gout between 2295 hypertensive individuals and 2280 normotensive controls in an eight year follow up period.36 The incidence of gout in men was fourfold higher in hypertensive subjects than in controls (RR = 3.93 (95% CI, 1.6 to 9.7)), adjusted for the use of diuretics. The four case–control studies included two population based studies (the UK General Practice Research Database (GPRD) study and the Taiwan study) and two hospital based studies.2,37–39 The UK GPRD study investigated the relation between gout and co-morbidities such as coronary heart disease (OR = 1.75 (95% CI, 1.70 to 1.79)), hypertension (OR = 1.52 (1.48 to 1.56)), diabetes mellitus (OR = 1.11 (1.06 to 1.16)), and chronic renal failure (OR = 4.95 (4.28 to 5.72)).2 The Taiwan study examined the association between gout and obesity (OR = 3.81 (1.22 to 11.84)).37 The two hospital based studies showed that triglyceride and apo-lipoprotein B were higher (p<0.05) but high density lipoprotein was lower (p<0.05) in gout patients than in control subjects.38,39
In addition, other factors including sex,2 diuretics,2 purine-rich food,40 and alcohol41 have been well documented as risk factors for gout (table 5). Three cohort studies investigated gout as a risk factor in the development of coronary heart disease.42–44 Only one study found significant risk (RR = 1.6 (95% CI, 1.1 to 2.2)) after adjustment for other risk factors for coronary heart disease such as hypertension, obesity, and diabetes mellitus.42 The pooled RR from these three cohort studies was 1.24 (0.92 to 1.67), suggesting that although cardiovascular risk factors may play a role in the development of gout,2 gout itself may make no contribution to the development of coronary heart disease.
Selected risk factors and co-morbidities associated with gout
In conclusion, a number of common risk factors and co-morbidities have been identified for gout (level IIa or IIb evidence). Because of their prevalence, impact on gout development and requirement for treatment in their own right, these factors should be considered when treating a patient who present with gout.
Future research agenda
One hundred and three research topics were recommended initially. The 10 that were agreed eventually after three Delphi rounds as the most important topics for the future research according to current available research evidence and clinical practice are shown in table 6.
Future research agenda: propositions developed through three Delphi rounds
DISCUSSION
These recommendations on diagnosis of gout are the first to be published for some time. Previous guidelines in diagnosis include the Rome criteria (1963),46 the New York criteria (1968),47 and the American Rheumatism Association diagnostic criteria for diagnosis of acute gout (1977).12 The current EULAR recommendations have the advantage of including reference to research data undertaken since the last published guidelines in 1977.12 Also, in contrast to previous guidelines the EULAR recommendations were developed by an international group using an evidence based format. This involved an anonymous Delphi approach to reach consensus on key propositions, a subsequent systematic search for research evidence to support each proposition, calculation of likelihood ratios where possible, pooling of studies across populations, and separate presentation of both the category of evidence for supporting research data and the strength of recommendation for each proposition. Possible benefits of such an international evidence based approach include reduction in personal bias, good external validity and generalisability, and ready identification of areas of clinical practice where more research data are required.48 Several methodological issues merit emphasis.
First, the method of deriving the overall strength of recommendation for each proposition was one that has been recently developed to accommodate the multidimensional trade off between efficacy, safety, costs, practicality, and acceptability.6 The validity and reliability of this system was examined during the current exercise and the results will be reported separately. The traditional ranking method, originally devised by a Canadian task force,49 derives strength of recommendation primarily from the category of research evidence and is best suited to propositions relating to treatment efficacy.49 The advantage of the EULAR system is that strength of recommendation is not solely linked to the hierarchy of research evidence but includes consideration of other aspects of evidence based decision making, such as benefit, risk, and clinical expertise. It is equally applicable to propositions relating to diagnosis and management. Presentation of the mean values gives a clear indication of the true support felt by the task force for each proposition, and the confidence intervals reflect how much agreement or diversity of opinion there is within the task force (table 3). This seems a better system, reflecting both research evidence and expert opinion, than the traditional semiautomatic estimation based on category of research data alone.49
Second, we used the likelihood ratio to estimate the diagnostic value for propositions. This has advantages over sensitivity and specificity in that it presents the overall usefulness of a diagnostic test that balances both its sensitivity and its specificity, and it allows the user to predict the probability of gout based on patient characteristics. For example, for a patient presenting with “a rapidly painful, swollen tender joint” from a population with a 0.5% risk of gout, the probability of this patient having gout is 0.63%, which is estimated using Bayes theorem50:
Pre-test probability = p1 = 0.005
Pre-test odds = odds1 = p1/(1−p1) = 0.005/0.995 = 0.005
Post-test odds = odds2 = odds1×LR = 0.005×1.27 = 0.0064
Post-test probability = odds2/(1+odds2) = 0.0064/1.0064 = 0.0063
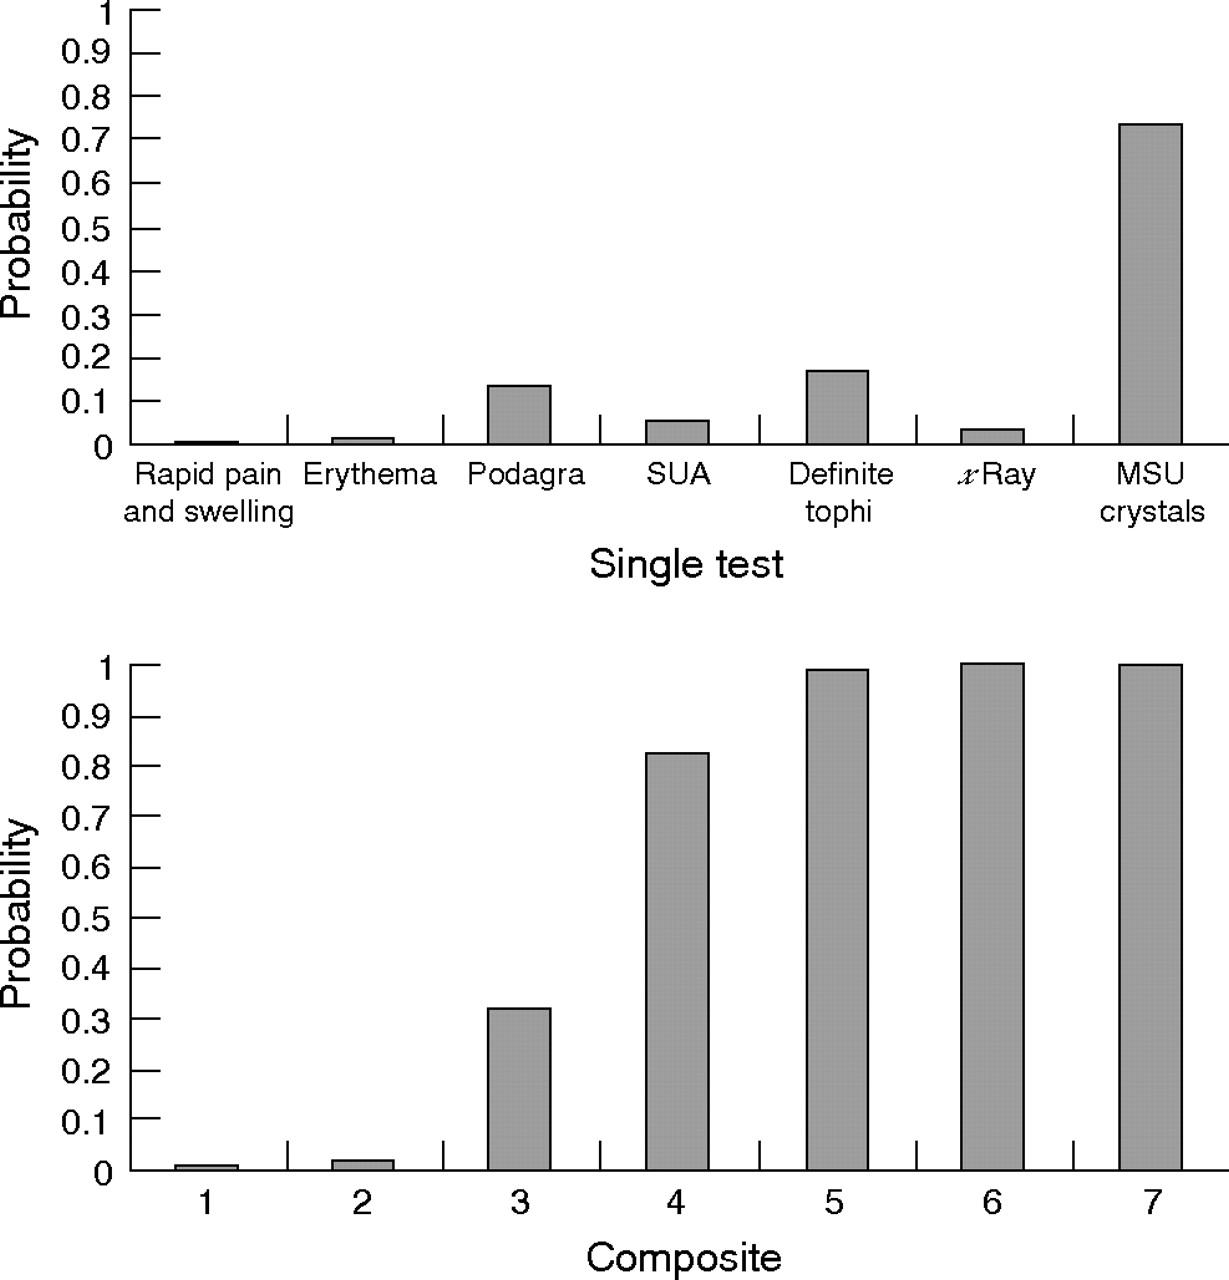
Likewise, the probability (that is, the post-test probability) is 1.21% for a patient with “erythema” from the same population, 13.34% for classic “podagra”, and 74% for patients in whom MSU crystals have been demonstrated. Therefore the probability of gout for any patient can be estimated from the LRs shown in table 4 and the background risk (pre-test probability) of gout in the source population. In a busy clinical setting this estimation can be directly obtained using Fagan’s nomogram (fig 4).51 The LR is particularly useful for developing a diagnostic ladder based on a composite of diagnostic tests or clinical symptoms. For example, the 0.63% probability of gout for a patient with “a rapidly painful, swollen tender joint” increases slightly to 1.53% if this patient also has “erythema”, to 32.30% if it involves his first metatarsophalangeal joint (“podagra”), to 82.29% if he also has hyperuricaemia and to over 99% (definite) if tophi or MSU crystals are detected (fig 5). The risk for any composite can be calculated. For example, for the combination of podagra and hyperuricaemia (proposition 2) the probability of gout is 59.99%, given the LRs of 30.64 for podagra and 9.74 for hyperuricaemia, respectively (table 4). In summary the LR provides a simple tool to estimate the probability of a diagnosis that can be applied to either individual or combined diagnostic observations (clinical or investigational) or to construct a diagnostic algorithm aligned to an individual’s daily clinical practice.

Fagan’s nomogram for calculating post-test probability. (To use this nomogram, first select the point on the pre-test probability scale on the left that is the local population risk of gout, for example 0.01. Then select the point on the likelihood ratio scale in the middle according to the diagnostic test, for example LR = 10. Where the extension of the line drawn between these two points crosses the post-test probability scale on the right is the estimated risk of gout, for example 0.1.)

Diagnostic ladder of gout: composite 1, rapid pain and swelling; composite 2, composite 1 plus erythema; composite 3, composite 2 plus podagra; composite 4, composite 3 plus hyperuricaemia; composite 5, composite 4 plus tophi; composite 6, composite 5 plus x ray changes; composite 7, composite 6 plus MSU crystals. MSU, monosodium urate; SUA, serum uric acid.
Third, the task force discussed at length the details relating to the Delphi exercise and the way in which propositions are developed. Compared with the nominal method for generating key propositions the Delphi technique has several advantages, the most important being the reduction in individual bias afforded by anonymity and the equal weighting afforded to all members.48 However, practical issues relating to the exercise include: (1) whether the aim should be comprehensive coverage of all options or selective highlighting of only key issues; (2) how best to edit and amalgamate propositions submitted in the first round; (3) the possibility, and timing, of subsequent modifications to wording or content of propositions; and (4) how to involve patient opinion. The task force elected for a free range of submitted propositions for diagnosis of gout without specifying headings that needed to be addressed by at least one proposition, though recognising that this less standardised approach would not necessarily result in exhaustive coverage of the topic. Because amalgamation sometimes introduced additional facets to a central statement that one of the proposing members might not fully support, the task force recommend that for future projects the initial propositions should be edited for grammar (especially with multiple country representation), that overlapping statements should be combined by an independent member who does not participate in this initial round, and that each member is given the opportunity to approve or to argue against any adjustments to their propositions before these are entered into the second Delphi round. Finally, to improve clarity, the task force undertook minor modifications to the wording of some propositions at the end of the process (after they had been voted in, researched and fully discussed) but no change was made to the key content of the propositions.
There are various limitations to these recommendations. First, there are caveats relating to the research data: as with any search strategy it is possible that some relevant research data were overlooked; the gold standard for gout diagnosis varied between studies, which may have caused measurement bias, so further studies using urate crystal identification as the gold standard are still required; and most comparative studies are hospital based and whether they represent the source population remains unknown. Second, as with previous EULAR recommendations we examined the research evidence and combined this with expert opinion, but patient opinion—the third important element of evidence based medicine52—was omitted. For future task forces ESCISIT is considering appropriate ways in which patient opinion can be included. Third, the task force was comprised solely of rheumatologists. General practitioners, who manage a substantial proportion of gout patients in Europe, were not represented, so the generalisability of the recommendations may be reduced. Finally, for relevant application of the recommendations we urge the user to study the commentary as well as the statements. This is particularly critical for the diagnosis of gout, as illustrated above by the discussion relating to LR, which is only useful when applied in conjunction with the risk of gout in the source population.
Conclusions
We have developed recommendations for the diagnosis of gout based on both clinical practice and the best available evidence. Ten key recommendations regarding clinical features of gout, biochemical examinations, urate crystals, radiographs, risk factors, and co-morbidities have been evaluated. A full review of this topic has also prompted 10 key recommendations for the future research agenda. We trust that these recommendations will lift the profile of gout and act as a catalyst for discussion between all health professionals involved in the diagnosis and management of patients with gout.
Acknowledgments
We would like to thank the European League Against Rheumatism for financial support, Helen Richardson for logistical support, Jane Robertson for literature search and database development, and Maggie Wheeler for language translations. We would also like to thank Dr Eloy van de Lisdonk from the University Medical Centre, Department of General Practice and Family Medicine, Nijmegen, for providing disaggregated data from their study.43
REFERENCES
Footnotes
-
See linked article, p 1312
-
Published Online First 2 June 2006