Article Text

Abstract
Background: Systemic lupus erythematosus (SLE) is an autoimmune disease affecting multiple organ systems triggered by the production of autoantibodies. Previous clinical studies in humans and murine models suggest that type I interferons (IFNs) are important for the initiation and potentiation of SLE activity.
Methods: 65 consecutive patients with SLE were identified from the University of California, San Francisco Lupus Clinic with moderate-severe disease activity. 94 serological samples were collected. Type I IFN levels and the ability of plasma to induce expression of several surface markers of dendritic cell maturation were measured.
Results: Type I IFN levels correlated with the presence of cutaneous manifestations, and there was a trend towards correlation with renal disease. No correlation was found between type I IFN levels and neurological disease. Type I IFN levels correlated positively with the SLEDAI score and anti-dsDNA levels and inversely with C3 levels. Interestingly, type I IFN levels were highest in African American patients. SLE plasma also induced the expression of MHC class I, CD38, and CD123 on monocytes, and was blocked by the addition of a monoclonal antibody to IFNAR1.
Conclusions: The pathogenic role of type I IFN is suggested by the induction of cell surface markers for dendritic cell maturation. The potential therapeutic utility of antibodies directed to either type I IFN or IFNAR1/IFNAR2 may be of interest in further studies.
- CI, confidence interval
- DCs, dendritic cells
- ESR, erythrocyte sedimentation rate
- GM-CSF, granulocyte monocyte-colony stimulating factor
- IFN, interferon
- IFNAR1, α chain of the receptor for type I IFN
- ISRE-Luc, IFN stimulated response element luciferase
- MHC, major histocompatibility complex
- PBMCs, peripheral blood mononuclear cells
- PBS, phosphate buffered saline
- SLE, systemic lupus erythematosus
- SLEDAI, Systemic Lupus Erythematosus Disease Activity Index
- SLEDAI
- interferon
- renal disease
- systemic lupus erythematosus
Statistics from Altmetric.com
- CI, confidence interval
- DCs, dendritic cells
- ESR, erythrocyte sedimentation rate
- GM-CSF, granulocyte monocyte-colony stimulating factor
- IFN, interferon
- IFNAR1, α chain of the receptor for type I IFN
- ISRE-Luc, IFN stimulated response element luciferase
- MHC, major histocompatibility complex
- PBMCs, peripheral blood mononuclear cells
- PBS, phosphate buffered saline
- SLE, systemic lupus erythematosus
- SLEDAI, Systemic Lupus Erythematosus Disease Activity Index
Systemic lupus erythematosus (SLE) is the prototypic autoimmune disease. Increasing evidence suggests that type I interferons (IFNs) have a critical role in both disease initiation and progression.
The IFN family of cytokines comprises both type I and type II subgroups. The type I subgroup is composed of IFNα, IFNβ, IFNω, IFNκ, and IFNτ and the type II subgroup is represented by IFNγ. Type I IFNs have multiple immunomodulatory effects including (a) stimulation of polyclonal T cell responses; (b) isotype switching; (c) expression of class I major histocompatibility complex (MHC) molecules; and (d) induction of dendritic cell (DC) differentiation.1
The association of raised IFN levels with SLE disease activity was initially reported in a small study, in which 71% of patients with active SLE had raised serum IFN levels. In addition, IFN levels correlated positively with both disease activity and anti-dsDNA titres and inversely with C3.2 Additional studies have since corroborated the presence of raised levels of IFN in patients with active SLE.3–,8 Clinically, evidence for a putative role of IFNα in SLE comes from the observation that patients without SLE treated with IFNα occasionally develop autoantibodies and clinical manifestations consistent with SLE.9,10 More recently, levels of IFNα in patients correlated positively with the Systemic Lupus Erythematosus Disease Activity Index (SLEDAI) scores and rash.11
Additional evidence for the role of IFNα in SLE has been demonstrated in several in vitro studies. Blanco et al reported that serum from patients with SLE induced DC maturation from monocytes.12 Baechler et al reported that IFN regulated genes were up regulated in half of the lupus patients compared with controls.13
Two recent studies reported further data supporting the role of type I IFNs in SLE murine models. NZB knockout mice lacking the IFNAR1 (the α chain of the receptor for type I IFN) had increased survival, reduced haemolytic anaemia, and reduced glomerulonephritis in comparison with wild-type mice.14 A second study demonstrated that treatment of lpr mice with an inducer of type I IFN worsened immune complex glomerulonephritis and led to higher titres of autoantibodies.15
With this background, we examined the correlation of type I IFNs with clinical and serological manifestations of SLE in a large, ethnically diverse group of patients. In addition, we investigated the ability of SLE plasma to induce the expression of several cell surface markers important in the differentiation of DCs from monocytes.
PATIENTS AND METHODS
Patients and serum samples
The study was conducted from March 2000 to December 2003. Patients were recruited consecutively from the University of California, San Francisco Lupus Clinic. All patients met the revised American College of Rheumatology criteria for SLE and had at least moderate disease activity.16,17 After informed consent, 65 patients were enrolled. At each study visit, 10 ml of whole blood was obtained. Twenty two patients had more than one sample drawn. A total of 94 samples were collected. Twenty five samples from healthy volunteer donors were also collected. Blood was centrifuged at 3000 rpm for 12 minutes and serum was separated for type I IFN determination. Blood was also sent for measurement of the Westergren erythrocyte sedimentation rate (ESR), complement components (rate nephelometry), and anti-dsDNA antibodies (enzyme immunoassay). On each visit, the patient’s clinical manifestations and drugs were recorded and the SLEDAI score was calculated by the treating rheumatologist (JCD and MCD).
Growth media and reagents
The following reagents were purchased from Gibco (Invitrogen): RPMI 1640, 2-mecaptoethanol, penicillin/streptomycin/l-glutamine, fetal calf serum, and Versene (used at 1:5000.) IFNα2B (Intron A) was purchased from Schering-Plough (2.6×10⁸ IU/mg). IFNβ and IFNω were purchased from PBL Biomedical Laboratories. Leucocyte IFN was purchased from Sigma-Aldrich. Phycoerythrin or FITC conjugated antibodies anti-CD38 (IO Tests), CD123 (BD Pharmingen), and MHC class I (Caltag) were used in these studies.
Antihuman IFNAR1 antibody production
Hybridoma cells secreting antibody 64G12 (murine IgG1) were obtained from the laboratory of Dr Michael Tovey.18 The antibody was purified using a protein A Sepharose column, followed by an ion exchange column (Pharmacia). Both were run according to the manufacturer’s instructions.
Type I IFN assay
A human hepatoma cell line Hil3 was transfected with a plasmid containing an IFN stimulated response element—luciferase (ISRE-Luc), and a neomycin resistance gene. These cells were kindly provided by Dr Michael Tovey (CNRS, Paris, France). Hil3, 30 000 cells/well, was cultured in white reflective 96 well plates (DYNEX Microlite) and grown overnight in Dulbecco’s modified Eagle’s medium containing 10% fetal bovine serum and 1 mg/ml G418 (+penicillin/streptomycin/l-glutamine). After this incubation, 10 μl of growth media and 10 μl of healthy donor human plasma or SLE plasma was added and the plates were cultured for 18 hours. A three step serial dilution of IFN in triplicate beginning at 3000 U/ml and ending at 0.0063 was included on each plate. The reaction was terminated by adding 10 ml of lysis buffer to luciferase substrate vial (Luc Lite Plus kit, Perkin-Elmer); 100 μl of this substrate solution was added to each well and read on Top Count for 10 minutes (10 minutes waiting in the dark, then 1 second read/well). The counts per second (cps) at each IFN concentration were determined and the IFN concentration or cps in each sample was calculated from the IFN titration curve using Prism software (San Diego, CA) with linear regression parameters.
Assays for induction of cell surface markers and monocyte differentiation
A 25 ml buffy coat was diluted fourfold with phosphate buffered saline (PBS). The sample was separated into 4×50 ml conical tubes, and 15 ml of lymphocyte separation medium (ICN Biomedicals) was layered underneath. After a 30 minute spin at 500 g, the buffy layer containing the peripheral blood mononuclear cells (PBMCs) was removed and washed with PBS. Cells were resuspended in culture media containing 1% heat inactivated human serum at 4×10⁶ cells/ml. Monocytes were isolated by incubating PBMCs (2.0×10⁷ cells/5 ml/25 cm2 flask) for 1.5 hours at 37°C in culture media and then washing away non-adherent cells twice. For induction of monocyte maturation, the cells were incubated with medium containing 25% human plasma from healthy volunteers or from patients with SLE. Antibody blocking studies were conducted by adding 30 μg/ml of antihuman IFNAR1 antibody or isotype control, IgG1, to the culture. The cells were incubated for 4 days, washed with PBS, and treated with 1:5000 Versene for 10 minutes at 37°C. When necessary, the cells were detached by gentle cell scraping before being washed and analysed.
Each culture was resuspended in staining medium (Hanks’s Balanced Salt Solution with 0.2% sodium bicarbonate, 0.01% sodium azide, 0.1 mM EDTA, 20 mM HEPES, and 2% fetal calf serum) and separated equally into six wells of a V bottom 96 well plate. The cells were pulse-spun at 2100 rpm on a Sorvall RTH-750 rotor, and resuspended in 25 μl of staining media. One microgram of specific phycoerythrin conjugated antibody was added to each well and incubated on ice for 45 minutes. The cells were washed three times, resuspended in 200 μl of 2% paraformaldehyde in PBS, and analysed by flow cytometry with the Becton Dickinson FACScalibur. Gates were drawn on the forward v side scatter graph to remove contaminating cells from the analysis.
Statistical methods
Twenty two patients contributed multiple serological samples over time. For all of the analyses, we chose the sample that corresponded with the time point of greatest disease activity as determined by the SLEDAI.
Descriptive statistics are expressed as median and range for continuous variables and as number and percentage for categorical variables.
The IFN data were non-parametric. The Mann-Whitney statistical test was used in the comparison of type I IFN levels with disease manifestations and ethnicity. The Spearman rank correlation statistical test was used in the analysis of the correlation of type I IFN levels and the variables SLEDAI, ESR, anti-dsDNA, and C3. Values of p<0.05 were considered significant.
Mixed effects regression models with bootstrapping were used to determine whether ethnicity, SLEDAI, ESR, anti-dsDNA, and C3 were independently associated with type I IFN levels.
RESULTS
Characterisation of the IFN stimulated response element luciferase (ISRE-Luc) reporter assay
To determine the levels of type I IFN in SLE patient plasma, a reporter assay was established in which hepatoma cells, Hil3, were transfected with a plasmid containing ISRE-Luc. Unlike an enzyme linked immunosorbent assay (ELISA), this assay has the advantage of recognising multiple type I IFNs. Initial assays using recombinant IFNα2b, IFNβ, IFNω, and natural leucocyte IFN, which consists of multiple type I IFN species, demonstrated that all the type I IFNs tested have the ability to stimulate a luciferase response. Luciferase activity was measured as light emission (cps), and linear regression analysis showed it to be proportional to IFN concentration in the range tested. Although all type I IFNs gave very similar dose responses, the response to IFNγ or type II IFN was minimal, with a barely detectable signal at the highest concentration tested (fig 1⇓).

The human hepatoma cell line Hil3, transfected with ISRE-Luc, responds to type I IFN stimulation in a dose dependent manner. Luciferase activity is measured in counts per second and is proportional to IFN activity as demonstrated by linear regression analysis (Graphpad Prism). All recombinant type I IFN subtypes tested show significant activity. Similarly, natural leucocyte IFN (multiple IFNα subtypes + IFNω) produces a robust luciferase response. In contrast, the Hil3 reporter assay exhibits a very weak response to type II IFN (IFNγ).
To determine assay specificity, a blocking study was conducted in which each IFN subtype was added to cells either in the absence or presence of anti-IFNAR1 (64G12) or isotype control antibody. Addition of 100 U/ml IFN to cells induced a robust response, which was blocked by anti-IFNAR1 antibody 64G12 in a dose dependent manner. The 50% inhibitory concentration (IC50) for anti-IFNAR1 activity was very similar (∼2 μg/ml) for IFNα2b, leucocyte IFN, and IFNω, but the potency of the antibody for IFNβ blockade was lower. As expected, isotype control antibody had no effect on IFN activity (fig 2⇓). Further assay validation examined the activity of known concentrations of IFN spiked into plasma from healthy donors. The resulting signals correlated well with those of the IFN standard curve (data not shown). Thus, this assay represents a robust and specific assay for measuring levels of type I IFN in patient plasma samples. In all assays measuring the level of type I IFN in patients with SLE, a standard curve with IFNα2b was generated in the presence of healthy donor plasma and used to interpolate IFN concentrations.

Type I IFN activity in the Hil3 ISRE-Luc reporter assay is neutralised by mouse anti-IFNAR1 (64G12) in a dose dependent manner. A fixed concentration of IFN (100 U/ml) is added to cells in the presence of a dose titration of IFNAR1 specific antibody or isotype control. Luciferase activity is measured in counts per second and neutralisation is proportional to antibody concentration as demonstrated by non-linear regression analysis, sigmoidal dose response, variable slope (Graphpad Prism).
Patients
Table 1⇓ shows the baseline characteristics of the patients. Fifty four women and 11 men were enrolled. Their median age was 32 years (19–72), and median disease duration 85 months (1–492). The median SLEDAI was 5 (range 0–30), median anti-dsDNA 84 (range 0–12,000), median ESR 27 mm/1st h (range 1–105), and the median C3 was 0.8 g/l (range 0.2–1.5). The median prednisone dose was 10 mg/day (range 0–70).
Baseline characteristics (n = 65)
Comparison of type I IFN levels in patients with SLE v controls
IFN levels were significantly greater in patients with SLE than in control samples: median 1.66 U/ml (range 0.000–604.0) v 0.000 (range 0.000–0.003), p<0.0001.
Correlation of type I IFN levels with disease manifestations
IFN correlated positively with SLE cutaneous manifestations. In patients with skin disease, the median level of IFN was 3.138 U/ml (range 0.004–604.0) compared with 1.022 U/ml (range 0.000–19.0) in patients without skin involvement (p = 0.0002) (fig 3⇓). There was a trend towards a positive correlation of IFN with the presence of renal disease (median 2.072 U/ml v 1.193 U/ml, p = 0.0669). We did not observe a statistically significant correlation between IFN and the presence of neurological disease.

IFN correlated significantly with the presence of skin disease (median 3.138 U/ml v 1.022 U/ml, p = 0.0002). There was a trend towards a positive correlation between IFN and the presence of renal disease (median 2.072 U/ml v 1.193 U/ml, p = 0.0669). No statistically significant correlation between IFN and neurological disease was found. IFN levels were significantly higher in African American patients than in white patients (median 2.651 U/ml v 1.060 U/ml, p = 0.0299).
Correlation of type I IFN levels with ethnicity
IFN levels were significantly higher in African Americans than in white patients: median 2.651 U/ml (range 0.626–75.249) v 1.060 U/ml (range 0.001–19.0), p = 0.0299. A trend towards greater IFN levels in African Americans than in Hispanics was seen: median 2.651 U/ml (range 0.626–75.249) v 1.118 (range 0.000–34.95), p = 0.0952.
Correlation of type I IFN levels with measures of disease activity
IFN correlated positively with SLEDAI scores (rs = 0.451, 95% confidence interval (CI) 0.233 to 0.626), p = 0.0002; ESR (rs = 0.481, 95% CI 0.233 to 0.626), p = 0.0002; and anti-dsDNA levels (rs = 0.509, 95% CI 0.301 to 0.671), p = 0.000); and correlated inversely with C3 levels (rs = −0.591, 95% CI −0.731 to 0.404), p = 0.000) (fig 4⇓).

IFN levels correlated positively with SLEDAI scores (rs = 0.451, p = 0.0002), ESR (rs = 0.481, p = 0.0002), and anti-dsDNA (rs = 0.509, p = 0.000). IFN levels correlated negatively with C3 levels (rs = −0.591, p = 0.000).
Additional multivariate analysis using mixed effects regression models demonstrated that anti-dsDNA was independently associated with IFN. For each unit increase in anti-dsDNA, there was a predicted IFN increase of 0.033, p = 0.000.
Monocyte differentiation
Previously published studies reported that monocytes purified from healthy volunteers differentiate in response to treatment with plasma from patients with SLE.12 To monitor monocyte maturation, we measured the levels of three cell surface proteins, MHC class I, CD38, and CD123. These are induced on monocytes and B cells cultured overnight with IFNα or on DCs which were matured by addition of IFNα and granulocyte monocyte-colony stimulating factor (GM-CSF).19 Figure 5⇓ shows that normal healthy donor plasma did not mediate changes in monocyte cell surface expression of MHC class I, CD123, and CD38. In contrast, normal plasma supplemented with 100 U/ml recombinant IFNα2b mediated an induction of marker expression which was neutralised specifically by mouse anti-IFNAR1(64G12) but not by isotype control antibody. It should also be noted that anti-IFNAR1 antibody had no effect on marker levels in the presence of normal plasma alone.
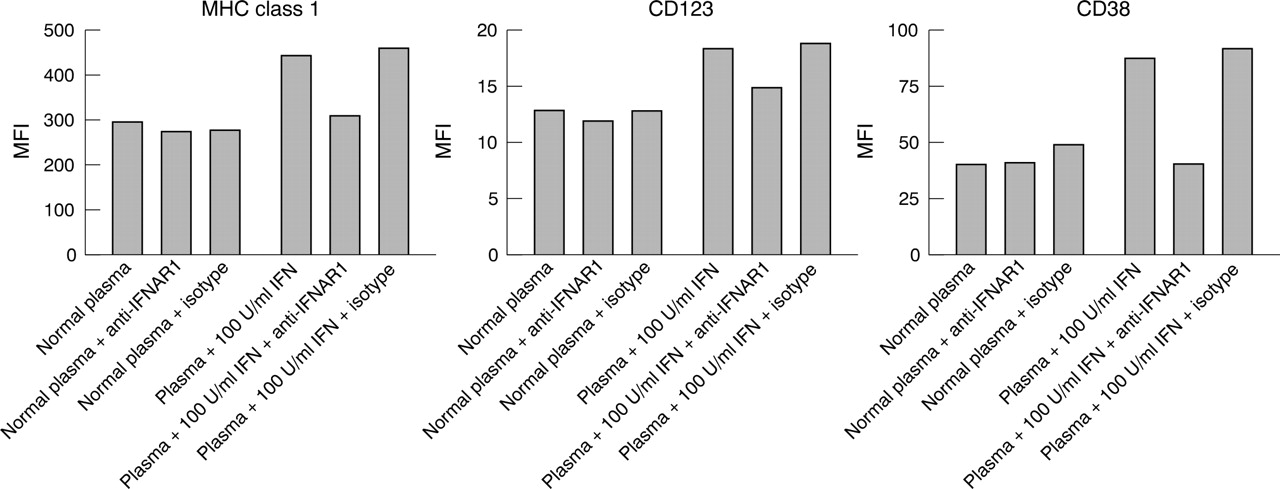
Anti-IFNAR blockade of recombinant IFNα mediated dendritic cell development. Monocyte differentiation was monitored by increased expression of the cell surface markers MHC class I, CD123, and CD38. Normal healthy donor plasma does not mediate IFN dependent changes in monocyte maturation as demonstrated by treatment of monocytes in the presence and absence of blocking antibody. Normal plasma supplemented with 100 U/ml recombinant IFNα2b mediates an induction of marker expression in comparison with normal plasma alone. Neutralising mouse anti-IFNAR1 (64G12) returns the levels of MHC class I, CD123, and CD38 to baseline but has no effect on marker levels in the presence of normal plasma alone. Isotype control has no significant effect on marker levels.
Figure 6⇓ shows that 10 or 100 U/ml of IFNα2b (Intron A) spiked into healthy donor plasma increased the expression of MHC class I, CD123, and CD38. Similarly, the addition of 10% SLE plasma induced expression of these cell surface markers. The two representative SLE donors illustrated in this figure have type I IFN levels of 35 and 18 U/ml as measured by the Hil3 reporter assay described in “Patients and methods”. The induction of cell surface marker expression, mediated by SLE plasma, was reversed by the addition of a monoclonal antibody to IFNAR1 while a control antibody showed minimal activity.

Anti-IFNAR blockade of SLE plasma mediated DC development. Monocytes isolated from healthy donor PBMCs differentiate in response to IFN stimulation. This maturation process is monitored by up regulation in the expression of cell surface markers MHC class I, CD123, and CD38 after treatment of monocytes with normal plasma supplemented with 100 U/ml and 10 U/ml IFNα2b. Similarly, plasma from patients with SLE, in the absence of antibody, mediates induction of marker expression consistent with the activity of the type I IFN detected in a reporter assay. SLE plasma activity is neutralised in the presence of mouse anti-IFNAR1 (64G12), resulting in normalised MHC class I, CD123, and CD38 levels comparable to those of unstimulated monocytes. Isotype control has negligible effect on monocyte differentiation in the presence of SLE plasma.
DISCUSSION
As far as we know, this study is the largest to date confirming the association between type I IFN and multiple clinical and serological features of SLE. We observed that type I IFN levels were positively associated with skin disease, but not with neurological disease. There was a trend towards a positive association with renal disease. Although our study did not observe an association between type I IFN levels and neurological disease, the small number of patients with this manifestation might have limited our ability to detect any difference.
Because of the broad range of ethnicities in our population, we were also able to examine the association between type I IFN and ethnicity. We found that IFN levels were significantly higher in African Americans than in white patients or Hispanics.
Addition of SLE plasma to healthy donor monocytes induced expression of three key markers of DC maturation; MHC class I, CD123, and CD38. This appears to be IFN dependent as demonstrated by reversal of the marker induction with antibody to IFNAR1. The selection of MHC class I, CD123, and CD38 as markers was based upon several factors: (a) numerous studies have shown that type I IFN induces expression of MHC class I; (b) CD123 is highly expressed on plasmacytoid DCs, which represent a unique population of DCs that are the major source of type I IFNs in peripheral blood; and (c) CD38 is raised on B cells and plasma cells in patients with SLE. In addition, we have shown previously that monocyte maturation by IFN and GM-CSF induces functional DCs which express high levels of MHC class I, CD123, and CD38.19 The level of type I IFN in these patients ranged from undetectable (<1 U/ml) to 76 U/ml. Clearly, the 18–35 U/ml levels which were used in this study are sufficient to induce expression of these three markers.
Our data, as well as published data, indicate that 10–100 U/ml of IFNα2b as well as other IFN subtypes can induce expression of MHC class I, CD123, and CD38 on monocytes.19 Previous studies reported that SLE plasma induces monocyte differentiation, which can be reversed with IFNα-specific antibodies.12 In contrast, our studies used an antibody to IFNAR1. This antibody not only blocks multiple IFNα subtypes but also inhibits IFNβ and IFNω.18 Currently, the repertoire of IFN subtypes in SLE plasma which are responsible for induction of DC maturation or other immunomodulatory activity remains unknown. Indeed, IFNω is found in the serum of patients with SLE, the gene is differentially expressed in peripheral blood cells taken from patients with SLE, and autoantibodies specific to IFNω were identified in a cohort of patients with SLE.20,21 It is also unknown whether a more broadly active antibody blocking multiple type I IFNs may be advantageous as a potential therapeutic agent than an antibody specific for IFNα. Both approaches are valid and worth pursuing.
The potential role of type I IFNs in the pathogenesis of SLE is slowly being elucidated, and this study demonstrates a clear association between IFN levels and various clinical and serological manifestations of SLE. The pathogenic role of IFN is suggested by the finding that SLE plasma induced the expression of cell surface molecules on monocytes, and that this action was blocked when a monoclonal antibody to IFNAR1 was added to the system.
REFERENCES
Footnotes
Published Online First 20 April 2005