Article Text

Statistics from Altmetric.com
- ERA, early rheumatoid arthritis
- MHC, major histocompatibility complex
- PBMC, peripheral blood mononuclear cell
- PCR, polymerase chain reaction
- RA, rheumatoid arthritis
- SLE, systemic lupus erythematosus
- TGFβ, transforming growth factor β
We and others have shown that patterns of gene expression by peripheral blood mononuclear cells (PBMCs) identify signatures in patients with autoimmune diseases, including rheumatoid arthritis (RA), systemic lupus erythematosus (SLE), multiple sclerosis, and type I diabetes mellitus.1–5 In our previous report, the autoimmune signature was shown to be distinct from the normal immune response to vaccination.1 In view of these findings, we hypothesised that other groups of genes might be identified that would be specific for disease subsets. We were especially interested in the possibility of identifying a gene expression pattern specific for patients in the early stages of RA because there is a great clinical need for identification of these subjects to facilitate starting definitive treatment. Furthermore, patients in earlier stages of disease are more likely to reflect inciting or aetiological factors of the disorder. As in previous studies, we approached this problem by examining samples of peripheral blood rather than a target tissue like synovium, because screening could be carried out on any subject, not just those who already had joint abnormalities, making it feasible to identify patients with early disease.
For these studies patients with RA with early disease were defined as those who had a diagnosis for <2 years and this group was compared with a group of patients with RA with an average disease duration of 10 years. Clustering algorithms permitted separation of these two groups of patients with RA based on the PBMC gene expression data. There was some overlap with genes that are altered in normal subjects in response to a viral antigen, which suggests that some immune abnormalities at this relatively early stage of RA may represent a response to an as yet undetermined infectious agent. The gene expression pattern for RA was also shared, in part, by a subgroup of patients with SLE, suggesting the possibility of overlapping aetiological pathways in these clinically distinct autoimmune disorders.
PATIENTS AND METHODS
Patients
Patients with RA were from clinics at Vanderbilt University and from a private rheumatology practice. All patients satisfied diagnostic criteria for RA.6 Disease duration, drugs, and demographic variables were determined from a chart review (table 1). Clinical profiles of the two groups of patients with RA indicated that they differed significantly only in the duration of disease (p = 0.0039; table 1). The use of prednisone was about twice as high in the group with early RA (ERA) as in the RA group (p = 0.09). Use of methotrexate and other disease modifying drugs was not significantly different between the groups. Additional blood samples were collected from 14 patients with SLE, all of whom satisfied American College of Rheumatology criteria for this disease.7 None of the patients with SLE had been diagnosed for <2 years and their average disease duration was 12.5 years. Blood samples were also obtained from 11 subjects with a clinical diagnosis of allergic disease or asthma. Data from nine control subjects studied before and after influenza vaccination were also analysed; these subjects have been described previously.1 These studies were approved by the Vanderbilt University Institutional Review Board.
Clinical features of patients with early or established RA
Sample preparation
PBMCs were isolated from 20 ml of heparinised blood on Ficoll gradients. Phenotypic profiles of cells separated by this method have been described previously.1 Total RNA was isolated with Tri-Reagent (Molecular Research Center, Cincinnati, OH), reverse transcribed with [33P]dCTP and hybridised to Human “Named Genes” GeneFilters microarrays release 1, containing 4329 clones (Research Genetics/Invitrogen Corporation, Carlsbad, CA). Filters were exposed for 24 hours and then scanned with a phosphorimager (Molecular Dynamics/Amersham Biosciences, Piscataway NJ). The data were normalised so that the average intensity for each clone was equal to 1. The high reproducibility of the hybridisation method has been described previously.1
Real time PCR
Confirmatory testing was done by real time polymerase chain reaction (PCR) using a spectrofluorimetric thermal cycler (ABI PRISM 7700; Applied Biosystems, Foster City, CA). Each 50 μl reaction mixture contained 1 μl cDNA and 2X SYBR-Green PCR master mix buffer. Primers were used at 200 nmol and primer sequences were as follows: for CHI3L1 F: GCC GGA CTT TCA TCA AGT CAG T, R: CAA GGT CCA GCC CAT CAA A; for CHES1 F: CCC CGA GAG CGA TGA TGA, R: GAC CGG ATC CCT GCT AAG TG; for JUND F: TCA CAG TTC CTC TAC CCC AAG GT, R: TAA ATC CTC CAG GGC CTT GA. The gene array data indicated that ERA and RA samples had equal levels of expression of JUND, whereas other conventional control genes, including glyceraldehyde-3-phosphate dehydrogenase and β actin, were differentially expressed. Therefore the genes of interest were compared with JUND as a control. In each case, the threshold cycle number was determined as the mean of three replicates.
Data analysis
Gene expression data were analysed by the Cluster and Treeview software programs of Eisen (Stanford University, Palo Alto, CA).8 The gene expression data were filtered to include only genes that showed significant variability (3 SD) in the clustering analyses. Two different clustering algorithms were applied: self organising maps and hierarchical.9 The Research Genetics Pathways 3.0 program was used to identify genes that were different among patients with ERA and RA or controls. The Pathways program expresses results as the ratio of the natural logarithm (ln); other analyses were done using log2. Clinical variables and gene expression data in the two RA groups were compared using an unpaired Student’s t test or a χ2 test for discontinuous variables. Values of p<0.05 were considered significant.
RESULTS
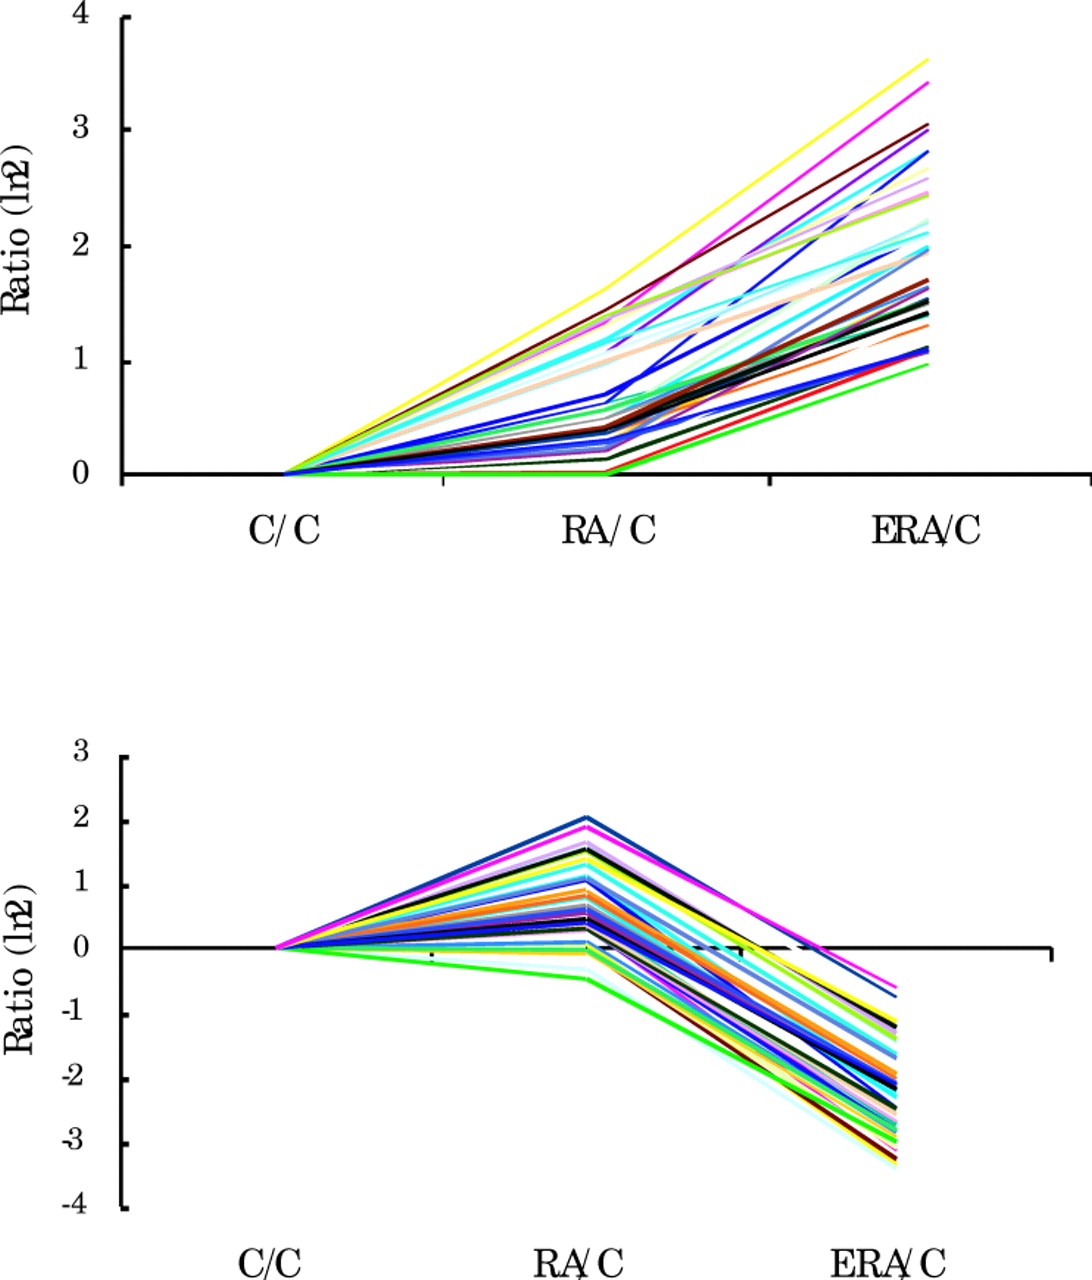
Gene expression levels in both RA groups were compared with those of normal control subjects after filtering out genes that did not show at least three standard deviations of variability for any of the conditions (fig 1). Using this approach, we identified two sets of genes that were similar for patients with established RA and normal control subjects but whose expression was either up regulated or down regulated in the patients with ERA. This finding suggested the existence of unique gene expression patterns in ERA.

Relative levels of expression of genes in PBMCs from 8 patients with RA, 11 patients with ERA, and 9 normal control subjects (C). Genes that did not vary for any of the conditions (3 SD) were removed from the analyses. Data are shown as the ratio, ln 2, for each group compared with controls. Individual lines show expression levels of individual genes.
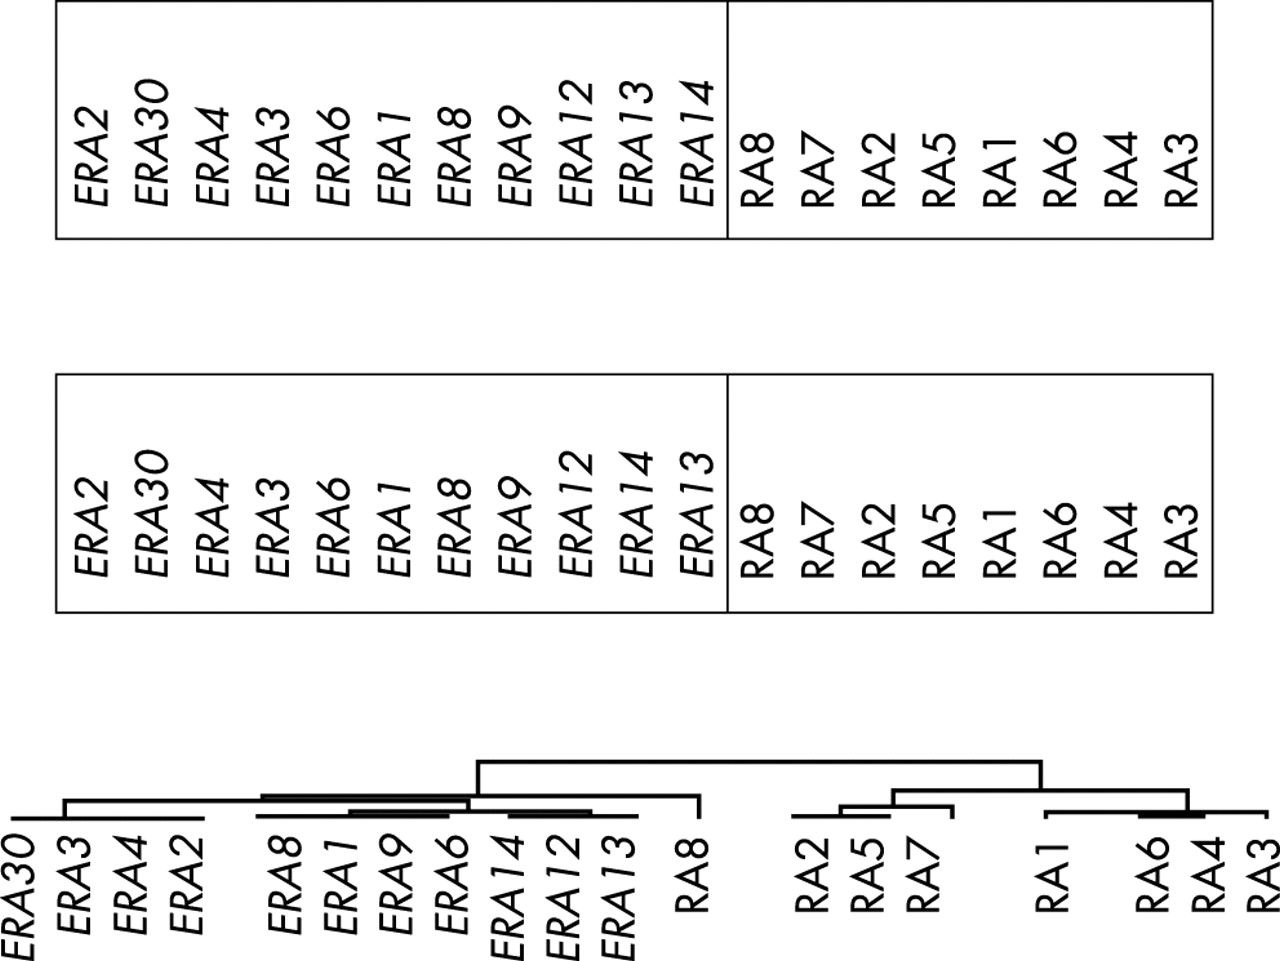
Further analyses were performed using clustering algorithms. The gene expression values were filtered and the self organising map algorithm was applied using two different sets of input vectors (fig 2, top). The SOM clustering was repeated 10 times and the only variability noted was the occasional appearance of patient RA8 inside one end of the ERA cluster. The hierarchical clustering algorithm was also applied to the same dataset (fig 2, bottom). Patients with ERA were again separated from the patients with RA. In this approach patient RA8 appears on a stem that is somewhat separated from the ERA group. Thus, these two clustering algorithms, which have distinctly different mathematical approaches9 yielded essentially the same results.

Clustering of patients with ERA and established RA using the self organising map algorithm with two different input vectors (top) and the hierarchical clustering algorithm with complete linkage clustering (bottom). Gene expression data were filtered to include only those that displayed at least three standard deviations of variability.
The ERA and RA groups showed some difference in the usage of prednisone (p = 0.19; table 1). To investigate the possibility that this might affect the observed differences, the gene expression data were reanalysed by grouping the patients with RA according to prednisone use rather than by disease duration. One group (n = 12) consisted of patients who were not taking prednisone and the second group (n = 7) included all patients who were taking prednisone (average daily dose 9 mg). Mean gene expression values were compared in the two groups by t test. Only one gene (ENC1) was differentially expressed by at least threefold, and the difference was not significant (p = 0.5); six genes showed at least a twofold difference, and none of these differences were significant (p>0.2). This result contrasts with the highly significant differences in many genes that were seen in groups defined by disease duration (p<10−3) and suggests that prednisone treatment does not explain the findings.
We next sought to identify the genes that showed significant differences between the groups with early and established RA by comparing mean gene expression values. Genes that showed greater than a threefold difference in their expression level, with a high level of significance (p<0.0005) between the two groups are shown (tables 2 and 3). Nine genes were up regulated in ERA compared with established RA (table 2), including three with immune system activities, TGFβ receptor II, CSF3 receptor, and cleavage stimulation factor,10 and two that influence levels or activity of glucocorticoids, cytochrome P450 subfamily IIIA and 11-β hydroxysteroid dehydrogenase 2.
Genes up regulated more than threefold in early RA
Genes down regulated more than threefold in early RA
The second group of genes included 44 that were down regulated by more than threefold in ERA compared with established RA. Some of these genes could be grouped into functional categories (table 3). The two largest categories, with 10 genes each, encode proteins that have known immune and inflammatory functions or are linked to cell proliferation and neoplasia. The first of these groups included three major histocompatibility complex (MHC) proteins, the class I molecule β2-microglobulin, and two class II molecules, DP α1 and DRα, as well as an interferon γ inducible protein (IFNγ inducible protein 30) involved in MHC restricted processing of antigen11 and nuclease sensitive element binding protein 1, a negative regulator of MHC class II genes.12 One gene, mannose binding lectin 1, is part of the innate immune response system and serum levels of this protein may be correlated with later joint damage in patients with early synovitis.13 Ten genes in the second category were associated with cancer, either as tumour markers or as proteins involved in processes of proliferation, differentiation or transformation (table 3).
A group of six genes encoded proteins involved in cellular proliferation or cell cycle progression, including transcription factors. Three genes were in the epidermal growth factor or transforming growth factor β (TGFβ) pathways that have activities in both neoplasia and in the immune system.12,14–16 Two proteins were in the cartilage and bone group. The first, bone morphogenetic protein 4, is a member of the TGFβ superfamily, so it also belongs to the growth factor group.17 This pluripotent molecule is involved in immune regulation and in neoplastic or metastatic processes as well as in bone remodelling.17 The second, cartilage glycoprotein-39 (or YKL-4), is a joint derived autoantigen that is increased in inflamed joints and serum of patients with active RA.18
Other down regulated genes include three involved in actin polymerisation, two translation factors, and two Golgi proteins, all consistent with a general state of cellular activation and proliferation.
The genes that were down regulated in ERA showed clusters on three separate chromosomes (table 3). Chromosome 1 included two clusters with a total of five genes, and chromosomes 12 and 14 each included one cluster of four genes. Although susceptibility candidate genes for RA have been located on chromosomes 1 and 12,19 no candidates have been identified on chromosome 14. Two dysregulated genes, both MHC class II proteins, were located on chromosome 6, which has been identified as having the strongest genetic contribution to RA susceptibility.
We were interested in further examining the ERA signature to see if it overlapped with the normal immune response. For this analysis, we used data from previously studied normal subjects who had received influenza vaccination.1 Of the 4133 array genes, 106 (2.6%) were up regulated in ERA by at least twofold and 400 (9.7%) were up regulated in the vaccine response. A total of 26 genes were up regulated in both responses. The predicted overlap if these two responses were independent, would be only 10 genes ((2.6%×9.7%) of 4133). A comparison of the observed overlap (26/4133) and the expected overlap (10/4133) shows a significant difference (χ2 = 7.4; p = 0.0075). This result suggests that the ERA signature might share features with the normal response to an infectious agent.
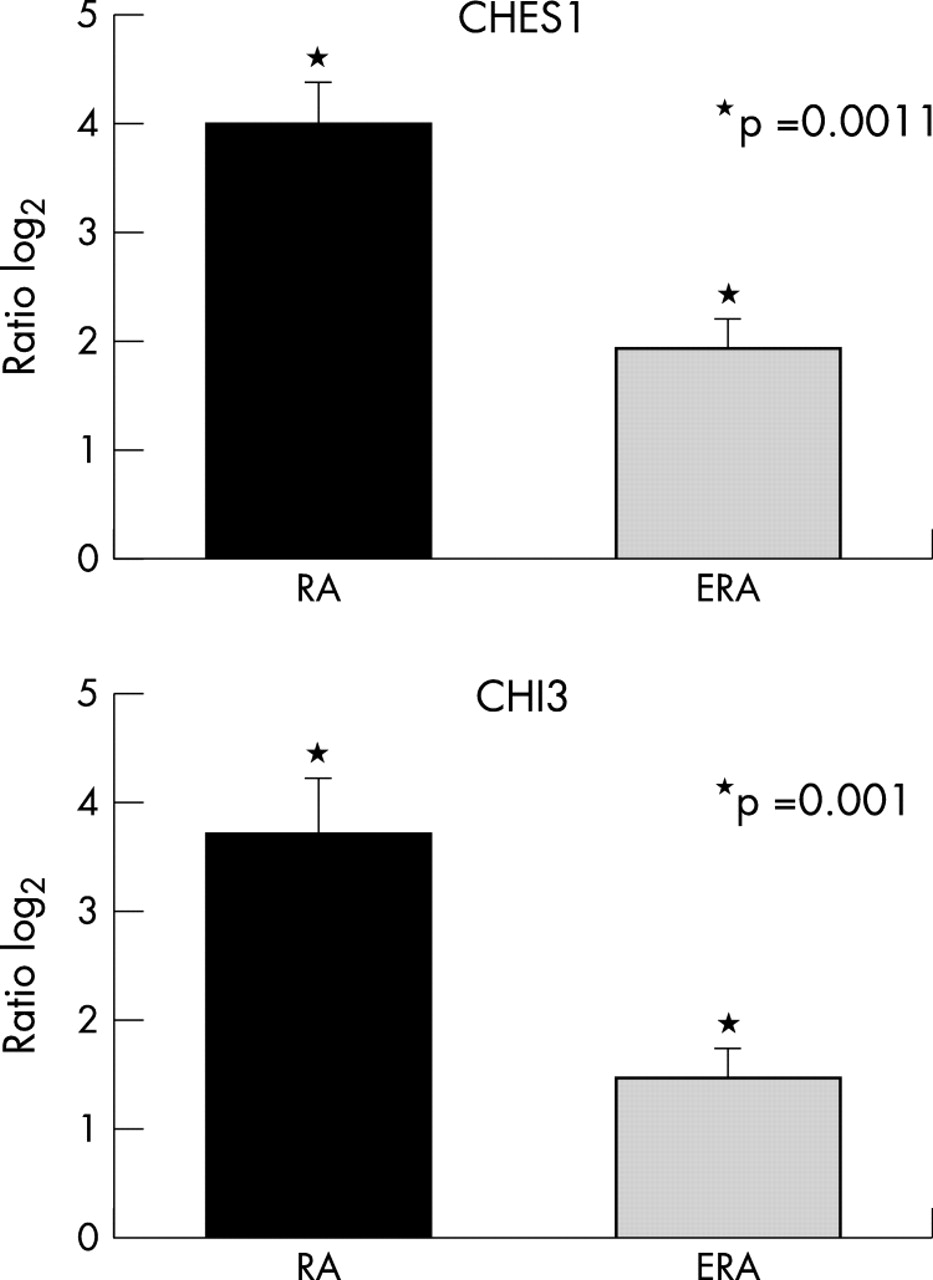
Two named genes showed differences between RA and ERA of eightfold or greater. Both of these genes, CHI3L1 (chitinase 3-like 1; cartilage glycoprotein-39) and CHES1 (checkpoint suppressor 1), were overexpressed in the RA group. Real time PCR analysis for these genes was carried out and levels were normalised to the proto-oncogene JUND (fig 3). Both CHI3 and CHES1 were significantly higher in RA than in ERA (p = 0.001 for CHI3 and p = 0.0011 for CHES1), confirming the array results.

Real time PCR confirmation of differential expression for the genes CHI3 and CHES1, both of which are up regulated on the gene arrays by eightfold or greater in RA compared with ERA. Values represent means from 5 subjects with RA and 11 with ERA. Normalisation to corresponding values for JUND were carried out for each subject. Relative increases are indicated as log2.
Genes responsible for differences between patients with early and established RA were then examined further to determine whether expression levels could be used to classify the patients with RA as having early or established disease. We first confirmed that both groups of patients with RA fit our previously described equation found in autoimmune subjects and unaffected first degree relatives.1 For both RA groups, each patient had a score of 0 in this 35 gene equation, confirming that the autoimmune signature was uniformly conserved in early RA.
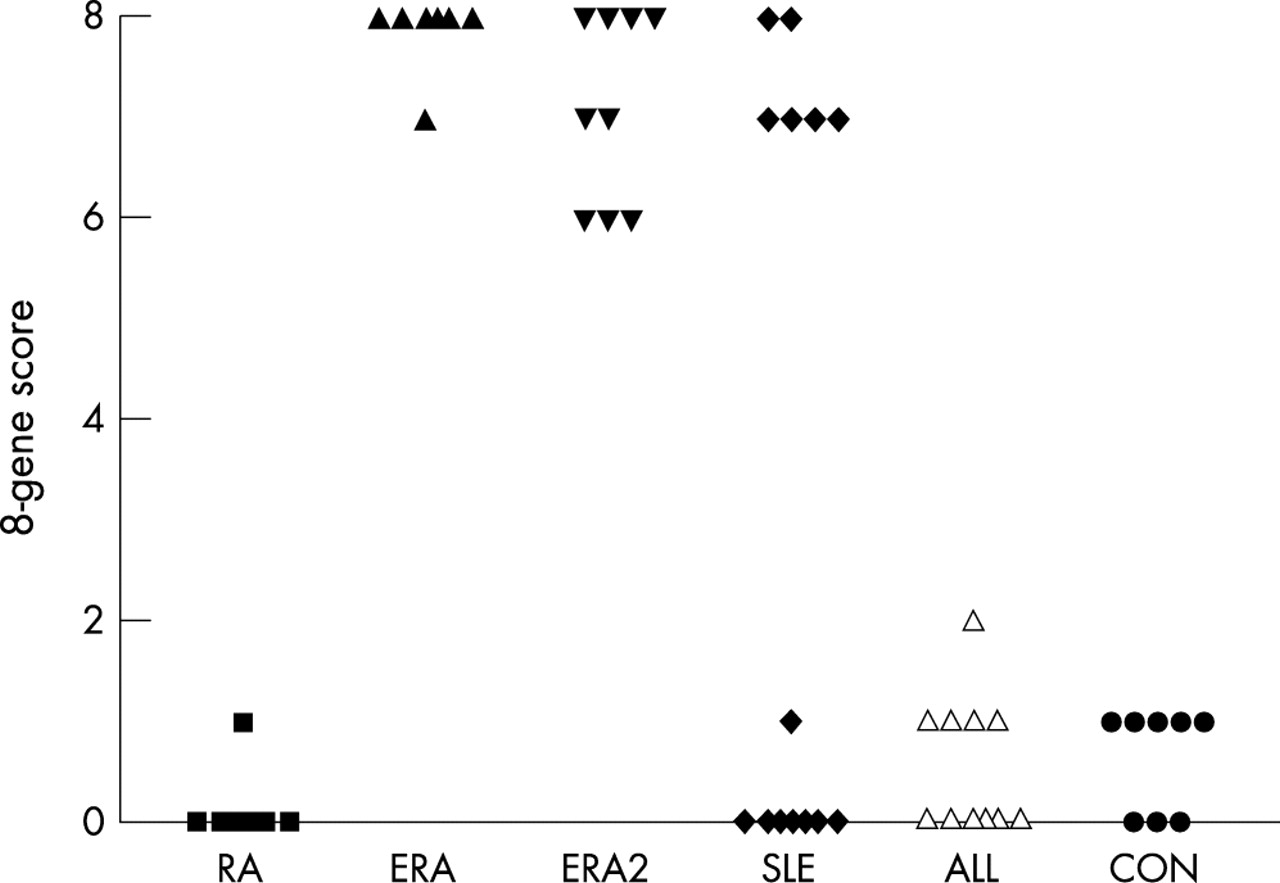
To look for equations specific for ERA, mean expression levels for each gene were compared for eight subjects in each group ERA and RA, and a ratio (ERA/RA) was calculated for each gene. These ratios were sorted to disclose a sets of eight genes that were significantly up regulated by at least threefold in ERA compared with RA. Inspection of the gene expression levels for subjects in each group confirms the differences (fig 4). A score was then derived using a value of 1 for gene expression levels that were above the overall mean and a value of 0 for those below the mean. This approach is similar to that used to derive our equation for autoimmune disease1 and is based on the principle of linear discriminant analysis.20 The mean (SEM) score derived from these eight genes was 0.13 (0.13) in the RA group and 7.88 (0.13) in the ERA group, a difference that was highly significant (p = 2.17×10⁻¹⁶) (fig 5). This equation was then tested with nine additional patients with ERA who had not been included in the original gene equation calculations. The mean score for this group (ERA2) was 7.11 (0.31), which was also significantly different from the established RA group (p = 1.39×10⁻¹¹). The equation was also tested in 14 patients with SLE. These subjects showed two subsets, one with values of 7–8 and other with values of 0 or 1. Inspection of the clinical records of these subjects indicated that 30% of the patients with SLE with high scores had a history of renal disease compared with 62% of those with low scores. However, this difference was not significant (p = 0.17). Furthermore, these two groups of patients with SLE had similar disease duration (approximately 11 years; p = 0.97), and none of the patients with SLE studied had disease duration of <2 years. Patients with allergic disease and normal control subjects did not express the ERA signature.

Gene expression levels for eight genes significantly up regulated in ERA. Results from individual patients are shown for eight patients with established RA (dark grey bars) and eight patients with ERA (light grey bars).
Score derived from eight genes that distinguish ERA from RA. The eight genes that were up regulated in ERA used to generate the equation were: TGFBR2, CYP3A4, TNNI2, HSD11B2, SNTA1, TNNT2, CSF3R, ZNF74. The ERA and RA groups with eight subjects each were used to generate the score. The equation was retested in a second group of patients with ERA (ERA2) who were not used to derive the score and in patients with SLE, and allergic disease (ALL) as well as in normal control subjects (CON).
DISCUSSION
Results of this study suggest that an early stage of RA is associated with a distinct gene expression profile in PBMCs. This gene pattern might be considered a marker for ERA and may reflect aetiological or pathogenetic factors. The possibility that the ERA signature reflects, in part, an immune response to an unidentified infectious agent is suggested by some of the analyses here; further study of this association would be of interest. The gene expression signature does not appear to be related to treatment with prednisone, as there were no significant differences when patients were sorted according to use of this drug. However, whether this profile is correlated with measures of disease activity has not been established. Discrimination between the effects of disease and drugs on the gene expression profile could be determined in longitudinal studies. We plan to follow up the patients with ERA who are being enrolled in a long term outcome study to determine correlates of the ERA signature and the loss of this signature over time.
We have previously reported that patients with autoimmune disease share a common gene expression signature that is independent of the clinical diagnosis.1 The present study demonstrates that other sets of genes can be used to distinguish between subsets of autoimmune patients. However, the ERA equation was not unique, because a subset of patients with SLE shared the ERA signature. These patients with SLE did not have early disease, and other potential explanations for the separation into two groups are not immediately apparent. This finding reinforces our previous view that distinct autoimmune syndromes share many similarities, and RA and SLE appear to be especially difficult to separate completely. Further studies in a larger, well characterised SLE population are planned to probe the basis for the SLE subsets.
The gene expression pattern offers a possible approach to early diagnosis of RA. Although new treatments for RA have greatly improved outcomes in this disease, early and accurate diagnosis remains of primary importance to avoid long term disability.21 However, it is currently not easy to identify these patients, in part because the nature of the initial insult remains unidentified. Patients who seek medical attention for treatment of undifferentiated synovitis may include some with RA as well as others who have syndromes that would require different forms of treatment.22,23 Recently developed tests based on the presence of antibodies to cyclic citrullinated peptide have been advocated as a way to find early, patients at risk for development of significant disease. Although anti-cyclic citrullinated peptide antibodies are very specific for RA, sensitivity may be <70%.24 Furthermore, it may be most prognostic for patients with mild disease.25 Rheumatoid factor and DRB1*04 genes correlate with erosive disease, but are not necessarily predictive in the individual patient.26,27 Non-invasive approaches using magnetic resonance imaging or ultrasound are sensitive to the presence of early synovitis,28,29 but are not useful screening tools owing to their expense and limited availability. Furthermore, because synovitis may precede clinical symptoms, with changes appearing as early as 2 months, even these approaches may miss patients with potentially destructive abnormalities.30
Our patients with ERA had all been referred to a rheumatologist for evaluation, a process that in the United States probably takes more than 3–6 months, and the patients with ERA in this study in fact had a history of symptoms for an average of 1 year before diagnosis. Whether this same approach and the equations generated (fig 5) or combinations of other genes could identify subjects with undifferentiated synovitis or early stages of other autoimmune disorders like lupus or multiple sclerosis is under active investigation.
In addition to disease categorisation, analysis of gene expression in peripheral blood offers the possibility of discovering new pathogenic pathways or molecules. In ERA, gene expression patterns may reflect responses to factors that have triggered the autoimmune response in a susceptible host. The genes that showed differential regulation in these patients include several that might be viewed as candidate genes—namely, three, CSTF2, CSF3R, and TGFBR2, which affect the function of B cells. Pathogenic autoantibodies are probably produced very early in the course of RA, and may reflect changes in B lymphocytes.31 Emerging techniques that permit study of small tissue samples from the synovium will be of interest to see if some of these same genes or pathways are also dysregulated in the targeted joint.32
Acknowledgments
We appreciate the technical assistance of Annette Oeser, Robert Yelverton, and Xuan Li and support from Dr C Michael Stein. Special thanks are extended to Drs Joseph Huston, Howard Fuchs, Theodore Pincus, S Bobo Tanner, and the other Vanderbilt physicians who allowed us to study their patients.
Support was from NIH (AI44924, AR41943, DK58765, AI053984, HL 67964), a Vanderbilt University Medical Center Discovery Grant and the Morgan Family Foundation. B Kraft was supported, in part, by NIH training grant HL69765.