Article Text

Abstract
Despite the advent of sophisticated imaging systems, plain radiography continues to be a valuable outcome variable in clinical trials of inflammatory disorders for a number of reasons. This paper discusses the pros and cons of the different ways in which radiographic data in trials is presented; the minimum time needed to demonstrate radiographic progression in the context of a clinical trial; and the best ways to statistically analyse radiographic data.
- radiography
- rheumatoid arthritis
- progression
- probability plot
- statistical analysis
Statistics from Altmetric.com
Radiographic progression has become a major outcome variable in clinical trials and observational studies for several reasons: radiographs of hands and feet can be taken in every clinic and are relatively cheap (feasibility), the methodology is standardised and valid scoring methods are available, radiographic damage correlates with physical function, and—perhaps most importantly—inflammatory activity in the joints is leading to radiographic progression. Inflammation of the joints may fluctuate over time, and radiographic damage reflects, at least in part, the accumulation of inflammation in the joints.
Although radiography seems somewhat old fashioned in comparison with newer imaging modalities, such as magnetic resonance imaging and power Doppler ultrasound, the methodology of measuring radiographic progression so as to use it as an endpoint in clinical trials is still developing. Relevant study questions include:
-
How to present radiographic data?
-
What is the minimum time needed to demonstrate radiographic progression in the context of a clinical trial?
-
How could radiographic data best be analysed statistically?
This paper focuses on recent developments in the field of measuring and analysing radiographic progression that might provide answers to these questions.
HOW TO PRESENT RADIOGRAPHIC DATA?
A set of radiographic data does usually not have a normal, bell shaped distribution. Often, most of the patients show minor or zero progression, and only a relatively small proportion show significant progression. We call such a distribution skewed. Such types of distribution are difficult to describe in a comprehensible manner. Means and standard deviations as descriptive statistics might give a spurious reflection of what is really going on in the group of patients, because these statistics are importantly determined by the small proportion of high scores. Table 1 shows that leaving out the 10% highest scores from a distribution of radiographic progression data decreases the mean by 30–40%, and the standard deviation by 40–50% (sensitivity to extremes). Medians and percentiles are often not an appropriate alternative, since they may not properly visualise treatment contrasts, especially if radiographic progression is limited to less than 50% of the patients per treatment group (median = 0).
Sensitivity of means and standard deviations for extreme radiographic progression scores: an example from the COBRA* trial
To improve comprehensibility of radiographic progression data, we recently proposed probability plots as a means to show important aspects of a set of radiographic progression data.1 A probability plot is a cumulative frequency distribution that orders radiographic data from the lowest through the highest value, and plots every individual value. An example of a probability plot is given in fig 1. It compares the one year radiographic progression scores of the two treatment groups of the COmbinatietherapie bij Reumatoide Artritis (COBRA) trial.2 Drop lines reflect the median and 25/75 centiles. The mean value is by definition reflected by the area under the cumulative probability curve, and cannot be read from the plot. It is easy to see that the curve of the monotherapy group lies left to the curve of the combination therapy group, indicating that radiographic progression was worse (higher scores) in the monotherapy group. A probability plot is a means of exploratory analysis. It does not statistically test a between group contrast, but it can serve as an adjunct to statistical testing, in that it visualises directly what actually has happened in the treatment groups.

Probability plots representing one year radiographic progression in both groups of the COBRA study (see table 1 footnote for details). Every symbol represents the score of an individual, and all scores are plotted against their cumulative probability.
Probability plots can also show negative radiographic progression scores, which are often found in clinical trials but disguised in summary descriptives such as means and medians. Negative scores are the consequence of either measurement error inherent to scoring with unknown time order (paired reading), or so-called repair, or both.3 So, the occurrence of negative scores in probability plots of clinical trials does not immediately indicate that repair of damage has occurred. Figure 2 shows a theoretical representation of how individual negative scores may be comprised. It can be every combination of true signal and measurement error, and it is impossible to differentiate in the individual patient. The probability of repair in relation to measurement error is a matter of within group statistical testing, in which the null hypothesis of “no change over time” is challenged.

Probability plot of an imaginary progression scenario. Negative progression scores do not necessarily imply repair. Every individual score represents a combination of true change and measurement error. It is impossible to distinguish both at the individual patient level.
HOW SENSITIVE IS RADIOGRAPHIC PROGRESSION?
There is a general feeling that radiographic progression in rheumatoid arthritis (RA) is a relatively slow process that does not occur in every patient with RA, and that it takes approximately one year for a group of RA patients before sufficient progression has occurred in order to be statistically useful in the context of clinical trials. We refer to this phenomenon as sensitivity to change. However, the sensitivity to change of radiographic progression has never been seriously investigated in the past, and we had the impression that even after a period of three to six months a significant proportion of patients would show radiographic progression. Several aspects are relevant to appropriately interpret radiographic progression. Firstly, the chosen scoring method should be sensitive enough to “create” a signal. Secondly, measurement error should be limited so that the signal of progression exceeds the noise of the measurement error. Measurement error is extremely relevant in measuring radiographic progression. Differences in positioning (angle), quality of films and/or exposure and observer error are examples of sources of measurement error that can negatively influence the signal to noise ratio and affect sensitivity to change.
The reading order should also be mentioned here. From a methodological point of view, it has not really been established whether reading with unknown time order (paired reading) is better than reading with known time order (chronological reading).4 Chronological reading may suffer from “anticipation bias” and may therefore exaggerate the signal of progression. And indeed, we always see that chronological reading yields higher progression scores than paired reading. However, in a clinical trial with blinded scoring of the treatment arms, this should not be relevant since the magnitude of anticipation bias is similar in both groups. Paired reading does not suffer from anticipation bias and will yield a signal that is more conservative: it may suffer from underestimation of the true progression rate due to uncertainty of the reader. With paired reading, it is also possible to get an impression about the magnitude of measurement error since paired reading always yields negative scores. Under the assumption that true negative scores do not exist, negative scores in a trial reflect measurement error. The situation has become complicated, however, since we have found that treatment, including tumour necrosis factor (TNF) blocking drugs, may induce repair of existing damage, a situation that is compatible with true negative scores.5 Historically, paired reading has been the method of choice for scoring clinical trials, thus creating a “trial within a trial” (blinding of reading order and blinding of treatment), probably because it is most conservative and robust against biases. Undoubtedly, this comes at the cost of sensitivity to change, and it is still open to debate whether chronological reading with the allowance of negative scores in an otherwise blinded trial environment will not yield a more sensitive progression signal.
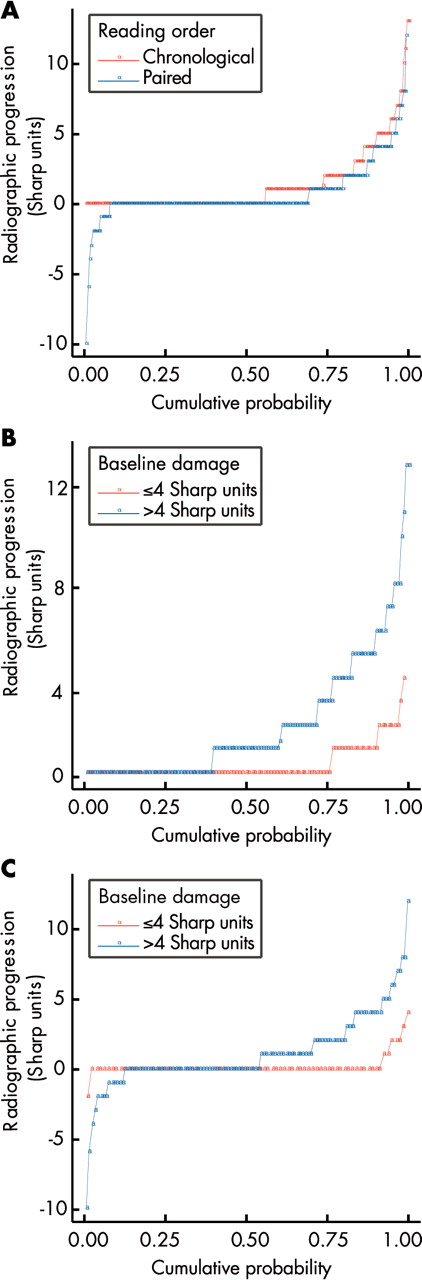
We recently investigated whether it is possible to pick up an appropriate progression signal in a three month follow up of patients with RA who are not treated with disease modifying antirheumatic drugs (DMARDs).6 This may be relevant for rapidly investigating new drugs that may inhibit structural damage in comparison with placebo before releasing them in a phase 3 trial. We chose a population of RA patients, early and advanced, with and without a DMARD history, who were treated with an inert experimental drug for a period of three months. “Inert” here refers to the fact that we could not demonstrate any clinical benefit of this particular drug. Baseline and three month radiographs of the RA patients participating in this trial were scored both by chronological time order and by unknown time order, and the main results are presented here in the form of probability plots (fig 3). Figure 3A confirms that chronological scoring yields a higher signal compared with paired scoring, but the most important finding in this study was that more than 30% of the patients already showed measurable progression after a three month period. Figure 3B shows that the signal obtained by chronological and paired readings can be improved by stratifying for baseline damage. The consequences of these findings for clinical trials are far reaching. Classic sample size calculation with figures obtained from this experiment clarifies that a three month placebo controlled trial with an experimental drug, and radiographic progression scored by paired reading as a primary outcome, is feasible (n = 75–100 per study arm), with a statistical power of 80% to detect a true reduction of progression of 50–75%. A three month placebo arm seems more feasible from an ethical point of view, in contrast with a one year placebo arm, and a 50–75% reduction of radiographic progression is reasonable in view of the recent experiences with TNF blocking drugs in clinical trials with a radiographic endpoint.

(A) Probability plots of progression scores obtained from a three month clinical trial, in which sets of radiographs were scored with known time order (chronological; red) and with unknown time order (paired; blue). (B, C) Probability plots of progression scores obtained from a three month clinical trial in which sets of radiographs were scored with known time order (chronological; B) and with unknown time order (paired; C), stratified for the presence (blue) or absence (red) of radiographic damage at baseline.
We therefore believe that it is possible to design relatively small placebo controlled proof-of-concept trials for investigating the potential of new drugs to arrest radiographic progression, especially if one selects on the presence of some baseline damage.
HOW TO ANALYSE RADIOGRAPHIC PROGRESSION DATA?
A problem inherent to assessing radiographic progression is missing radiographs. The intention to treat principle proclaims that all patients who have been randomised once should be taken into account in the analysis, irrespective of discontinuation and/or missing observations. This principle implies that missing data in a clinical trial should be handled by some means of imputation, to retain the patient, and the available data of that patient, in the analysis. Clinical data that are missing are usually handled by the last observation carried forward (LOCF) approach, or by imputation of group values. LOCF of clinical data is conservative, if one realises that the most important reason for missing data is discontinuation from the trial, mostly due to a bad clinical status at that moment. LOCF works as if the patient who has dropped out has not changed anymore after discontinuation.
Imputation by group means embarks on the assumption that individuals with missing values behave as well as—or as bad as—the entire group to which they belong, and is rarely conservative. This approach spuriously increases statistical power by increasing the number of patients, while leaving the group means unaffected. Therefore, often it is decided to perform a worst case scenario—for example, by imputing the 95% centile of a treatment group.
Radiographic data may behave differently with respect to imputation as compared with the situation described above for clinical data. LOCF is not rational since it would imply arrest of damage in that patient whereas the natural tendency is progression. Imputation of group characteristics such as mean or 95% centile may easily exaggerate true progression because of the sensitivity to extremes of the mean value, and the often extreme value of the 95% centile. Extrapolation of radiographic data seems more appropriate because of the naturally progressive course of radiographic damage, but one needs at least two assessments to be able to describe the trend before extrapolation can take place; moreover this assumes a linear progression rate for the individual patient, which may be true for short periods of follow up but not for longer periods (see below).
There is no clear-cut solution to this problem, and it is not known whether various means of imputation really jeopardise the trial results as much as theoretically can be expected. We therefore investigated the sensitivity of the results of the TEMPO trial by challenging it with different means of imputation.7 The conclusion of this sensitivity analysis was that the main trial result remained intact irrespective of the means of imputation. However, group means of radiographic progression were sensitive to some extent for different means of imputation. So in the absence of a widely accepted means of imputing missing radiographic data, we recommend carrying out a set of sensitivity analyses that challenge the results of the predefined primary analysis, and that include different kinds of imputation. A main trial result that proves to be robust against sensitivity analyses by different imputation techniques gains validity in comparison with a trial result that is vulnerable in this respect.
Another aspect of analysis of radiographic data involves the statistical analysis per se. The classic statistical analysis of a clinical trial with respect to radiographic progression is a between group comparison of change scores or progression scores. Although the terms “change” and “progression” suggest a longitudinal (time) component, the analysis is cross-sectional, or pseudo-longitudinal, implying that everything that may have occurred during the trial and may have influenced radiographic progression is not taken into account. This is of less importance in the context of clinical trials, since the focus of analysis is on groups of patients that were created by randomisation, and are considered equal in everything except trial medication. Radiographic progression on the group level is supposed to be a linear process, and can be appropriately estimated by one damage score before and one after the trial. However, to some extent, this linear representation is a simplification of the truth. Firstly, radiographic progression is not a linear process at all on the individual patient level. A linear group result can be split up in individual progression curves with steep and flat regression coefficients, and with periods of acceleration and deceleration over time, indicating that individual radiographic progression rate over time is subjected to external influences, presumably disease activity.8 The longer a clinical trial lasts, the higher is the chance that external influences other than trial treatment will influence the rate of radiographic progression, and jeopardise the before–after “cross-sectional” estimate of the progression rate. The same principle holds for long term observational studies, and a simple before–after analysis may be a spurious substitute of true radiographic progression rate.
Longitudinal data analysis may fill in this shortcoming to some extent. Longitudinal data analysis takes the variable time into consideration, and allows progression rates to fluctuate over time. Prerequisite is that radiographs are taken more frequently than only twice, so that interval progression can be analysed. Simultaneously, longitudinal data analysis adjusts for the within-patient dependency, the phenomenon that radiographic damage scores in an individual patient are closely correlated (tracking). Several types of longitudinal data analysis are available, among which marginal modelling by generalised estimating equations (GEE),9 and mixed effects models are most popular. GEE can provide estimations of radiographic progression over time that are based on repetitive radiographs, and are therefore more precise, as we have shown in the five year analysis of the COBRA trial.10 Mixed models, that can incorporate fixed effects, such as treatment, and random effects, such as individual patient, that gives justice to the phenomenon that every individual patient has a certain inborn propensity of progression, may provide adjusted estimates of radiographic damage scores that are also more precise than crude values. We recalculated the progression scores of the TEMPO trial using generalised mixed model analysis that included three time points of radiographic scores, and found that the statistically significant negative progression score in the combination therapy group (mean −0.54 Sharp units/year; 95% CI −1.00 to −0.07), suggesting repair, enlarged after longitudinal data analysis (−0.98 Sharp units/year; 95% CI −1.60 to −0.36).7
Longitudinal data analysis allowed us to investigate important associations, such as disease activity or inflammation and radiographic progression,11 radiographic damage and physical function,12 and inflammation and markers of cartilage degradation.13 Often, the statistical power to detect associations is increased, because all patients and all data points are retained in the analysis. A potential drawback in the interpretation of the results of longitudinal data analysis is that weak and clinically irrelevant associations become statistically significant. Therefore, it never replaces simple, exploratory analysis (such as probability plots), but it should be seen as an adjunct to better understand complicated associations.
In conclusion, new developments in the exploration, interpretation and analysis of radiographic progression have refurbished the already old fashioned technique of plain radiography in such a manner that it meets all the requirements for a key outcome measure in clinical trials of patients with inflammatory musculoskeletal diseases.
REFERENCES
Footnotes
-
Competing interests: none declared