Article Text

Abstract
Objective: Results of randomised clinical trials (RCTs) appear to differ from results of observational studies. This paper explores differences in methodology, interpretation and presentation of results that elucidate these differences.
Method: We identified patients who completed a survey questionnaire during the period January 1998 through December 1998 and also completed one between July 2003 and June 2004, an average span of 4.7 years. The mean time from study initiation to anti-TNF administration was 2.1 years, and the mean treatment time was 2.1 (SD 1.3) years at study closure. During this period 38.3% of patients received anti-TNF therapy. We compared the results of patients in this group with results from RCTs.
Results: RCTs utilise flare design, patient selection, control groups and regression to the mean. Observational studies, on the other hand, confound additional prior therapy and anti-TNF effect, do not employ control groups, and may have less regression to the mean.
Conclusions: RCTs and observational studies assess and report efficacy and effectiveness in ways that are so different that they are often incommensurable. A key difference is whether results should represent changes from flare states or should, instead, consider chronic status prior to initiation of therapy. There is little evidence that the clinical state at the start of most anti-TNF RCTs represents a chronic state. Economic analyses that utilise the RCT starting point overestimate the cost effectiveness of anti-TNF therapy. The solution for these problems and a guide to understanding the real results of anti-TNF therapy lies in collecting preclinical trial data in all patients who will enter clinical trials. In addition, RCT results would more approximate those of observational studies if all reporting was done after subtracting the effect of the comparator group.
- HAQ, Health Assessment Questionnaire
- NDB, National Data Bank
- RA, rheumatoid arthritis
- RCT, randomised controlled trial
- TNF, tumour necrosis factor
- rheumatoid arthritis
- anti-TNF therapy
- randomised trials
- observational studies
Statistics from Altmetric.com
- HAQ, Health Assessment Questionnaire
- NDB, National Data Bank
- RA, rheumatoid arthritis
- RCT, randomised controlled trial
- TNF, tumour necrosis factor
Based on the results of large series of randomised controlled trials (RCTs), antitumour necrosis factor (anti-TNF) therapy appears to be highly effective in the treatment of rheumatoid arthritis (RA) and other rheumatic diseases.1–12 In addition to important improvements seen with the American College of Rheumatology (ACR) improvement criteria13 and Disease Activity Score,14,15 individual patient based, self-report components also improve substantially.
There is a perception that anti-TNF therapy may differ in its efficacy according to whether it is administered as a part of an RCT or administered in practice and quantified in observational studies. In this report we explore the extent of improvement in clinical practice following anti-TNF therapy, and whether such improvement is greater or less than seen in clinical trials.
With regard to efficacy/effectiveness, RCTs and observational studies differ in a number of important aspects. First, RCTs are principally concerned with change. Observational studies are a mirror of clinical practice and are more concerned with status than change. For example, a patient with a 2.5 Health Assessment Questionnaire (HAQ) score who improves by 20% ends up with a HAQ score of 2, a score which is still very bad. The same could be said when 20 swollen or tender joints decrease to 16, a 20% improvement but still very poor disease status. In addition, change does not have a clear meaning in observational studies and clinical care, as the starting point is forgotten by patients and physicians as months and years pass and other clinical issues arise. The clinician’s common question, “How are you doing today?” is concerned about current status and only to a lesser extent with change in status.
Interpretation of change in clinical care and observational studies almost always relies only on the patients in the group treated. In RCTs, results may be displayed and interpreted with and without the result of the comparison group(s). For example, it may be said that 60% patients treated with therapy A achieved an ACR 20 response; alternatively the ACR response could be phrased in terms of response above the comparison group’s response, as in 30% more patients achieved an ACR 20 response compared with those in the comparison group. In terms of the HAQ, is an improvement of 0.5 units real improvement or are we required to subtract the improvement of the comparison group? If RCTs should subtract the comparator score (as we believe), is it possible to compare the results of RCTs and observational studies? If we were not to subtract the comparator results, would it be possible to compare the results of RCTs and observational studies?
In contrast to RCTs, observational studies tend to be more interested in patient measures, particularly functional measures, than in physician and laboratory measures. One reason for this preference is that it is very difficult and expensive to collect reliable physician data (for example swollen and tender joint counts) on a broad range of patients. In addition, functional measures are more predictive of RA outcomes than are physician measures.16 In the data that follow we will use the HAQ,17 a functional status measure, to compare results of RCTs with observational studies, although results for pain and global scale analyses would yield similar results. The HAQ is a central measurement in RA and is included in all RCTs.
METHODS
The National Data Bank (NDB) is a large, longitudinal data bank concerned with short and long term outcomes in rheumatic diseases. Details of the NDB have been reported previously.18–22 We identified 3900 patients who completed an NDB survey questionnaire during the period January 1998 through December 1998 and one between July 2003 and June 2004, an average span of 4.7 years (range 4.0–5.0). The time from study initiation to anti-TNF administration was 2.1 (SD 1.2) years (range 0.5–4.5), and the mean treatment time was 2.1 (1.3) years at study closure. During this period 38.3% of patients received anti-TNF therapy. Distribution curves of HAQ scores for all anti-TNF treated patients (n = 5421) and non-anti-TNF treated patients (n = 11 578) were described in separate analyses.
HAQ SCORES OF PATIENTS TREATED AND NOT TREATED WITH ANTI-TNF THERAPY IN THE NATIONAL DATA BANK FOR RHEUMATIC DISEASES
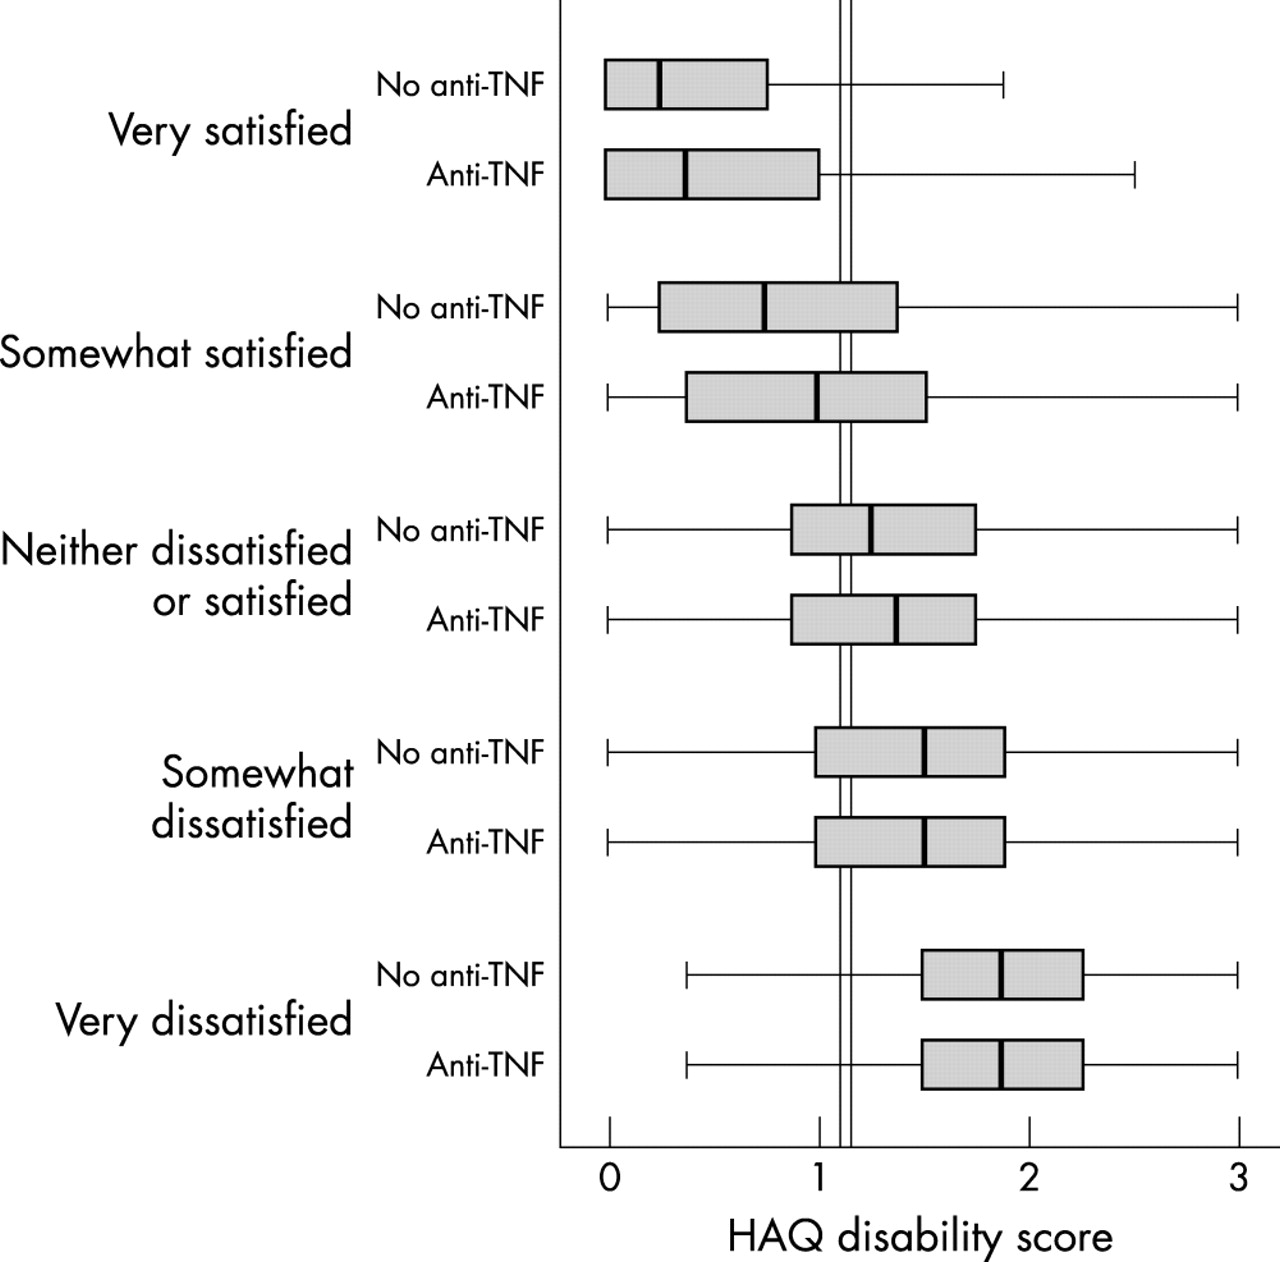
To put HAQ scores into perspective for anti-TNF therapy versus no anti-TNF therapy, we examined the distribution of scores in 5421 patients receiving anti-TNF therapies for at least six months and compared their scores with 11 578 patients who had not received such therapy (fig 1). The mean HAQ scores were 1.16 (SD 0.73) and 1.10 (0.76) for anti-TNF and no anti-TNF therapy, respectively. There is a wide distribution of HAQ response in both groups. The main difference between the graphs appears to be a slight shifting to the right (higher levels) within the anti-TNF group. Further insight into the meaning of the HAQ scores and the general equivalence of the groups come from fig 2. In this figure patients are categorised as to their satisfaction with their health as well as by their treatment group. Satisfaction with health helps to put the HAQ scores into a clinically meaningful perspective. The two vertical lines show the mean HAQ score of non-anti-TNF treated patients (left) and anti-TNF treated patients (right). There is a minimal HAQ score difference between the groups following treatment, except that in the “satisfied” groups patients treated with anti-TNF therapy appear to be satisfied at slightly higher levels of functional disability.

Distribution of Health Assessment Questionnaire (HAQ) scores among 5421 patients receiving anti-TNF therapy for at least six months and 11 578 patients who had not received such therapy. The HAQ scores were 1.16 (SD 0.73) and 1.10 (0.76) for anti-TNF and no anti-TNF therapy, respectively.

Patients categorised as to their satisfaction with their health and by treatment group. The vertical lines show the mean Health Assessment Questionnaire (HAQ) score in non-anti-TNF treated patients (left; 1.10 (SD 0.76)) and anti-TNF treated patients (right; 1.16 (0.73)). There is minimal HAQ score difference between the groups, except that in the “satisfied” groups patients treated with anti-TNF therapy appeared to be satisfied at slightly higher levels of functional disability.
We will now compare results of RCTs with those of observational studies, using the NDB data for observational study results, in a model of HAQ score change as a function of treatment with anti-TNF therapy (fig 3). For comparison within observational studies, the lower solid line indicates the HAQ score of patients who would never receive anti-TNF therapy. The upper solid line is the HAQ score of patients who would receive anti-TNF therapy at an average time of 24 months after entry into the NDB. At the time of entry, anti-TNF therapy was not commercially available.
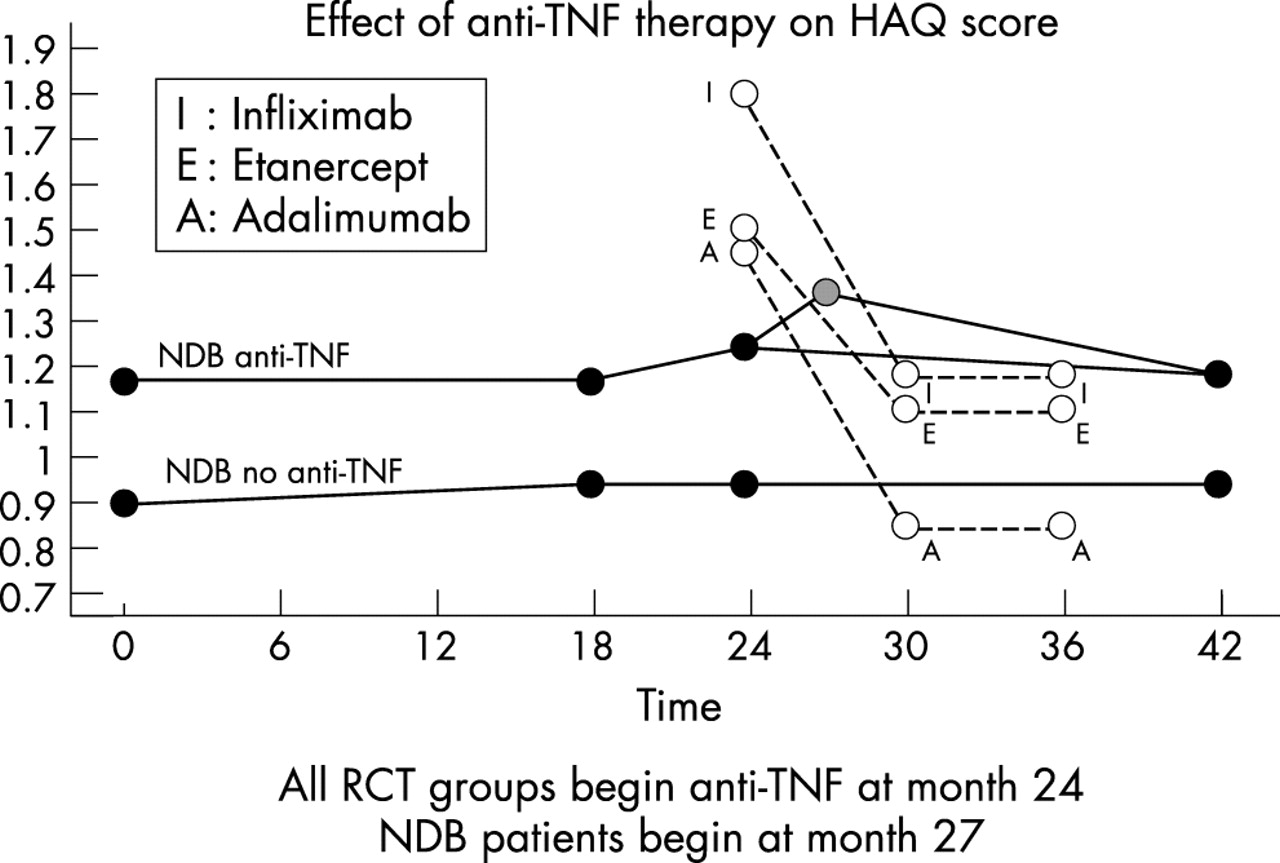
Anti-TNF therapy in randomised controlled trials (RCTs) and observational data from the National Data Bank for Rheumatic Diseases (NDB). The lower solid line represents the HAQ course of NDB patients (n = 2406) who did not receive anti-TNF therapy. The upper solid line represents the course of NDB patients (n = 1494) who received anti-TNF therapy. Open circles represent results from anti-TNF clinical trials. Note the absence of pre RCT data on clinical trial patients. The HAQ level at 27 months represents the estimated level of HAQ at the moment of starting anti-TNF therapy among NDB patients.
HAQ scores from the RCTs are as follows: for infliximab8 the starting HAQ was 1.7–1.8 and the final HAQ was approximately 1.2, a difference of around 0.6 and a difference compared with non-infliximab treated patients of 0.3. For etanercept the starting HAQ score was lower (1.5), the final HAQ score was 1.1, a difference of 0.4; the final HAQ score comparator difference was 0.3.12 For adalimumab the starting score was 1.45, the final score was 0.85, a difference of 0.6; the final score comparator difference was 0.43.2
From 0 to 18 months of follow up, the HAQ scores of patients in the NDB cohort who would receive anti-TNF therapy was 1.16 (these patients are surveyed biannually). At 24 months these patients were still not receiving anti-TNF treatment. However, at 30 months all of these patients were on anti-TNF therapy. The 24 month point, therefore, reflects the HAQ score in the cohort at an average of three months before starting anti-TNF therapy. Using data from the NDB that was acquired in rheumatologists’ offices at the time anti-TNF therapy was prescribed, we know that the mean HAQ score was 1.36 at the exact time anti-TNF therapy was prescribed (month 27 in fig 3). These data indicate that the observed reduction in HAQ score associated with anti-TNF therapy was 0.26 units from 24 to 48 months, and 0.38 units from (unobserved) month 27 through month 42.
The reduction in HAQ scores in the NDB following anti-TNF therapy can be conceptualised in a number of ways. First, we can assume that the 27–42 month reduction is correct. In that case, we appear to be capitalising on the three month flare that occurred between 24 and 27 months. As we are able to see the entire 42 month course of illness in fig 3, it does not seem that the 27–42 month difference is a fair representation of the course of the patients. Instead, it simply looks like a flare rather than a reduction from a constant state. Secondly, we could stick with the last pre anti-TNF HAQ score (month 24) and compare it with the final HAQ score. That method would “smooth” out the flare, but the apparent improvement would be less. Finally, we could take a “long” view and compare the 0–18 month HAQ level with the 30 through 42 month data. These data would indicate a lesser role for anti-TNF therapy in the course of RA in this cohort. Although we show the line from 27 months to 42 months for the purposes of illustration, the final value is achieved prior to the 42 month measurement.
When we examine the RCT data, we first note that there are no pre anti-TNF data. Therefore we are unable to tell if the HAQ level at the 24 month start represents a chronic state that was then substantially ameliorated by anti TNF-therapy or instead represented, at least in part, a flare condition. The RCT HAQ starting points are greater than the NDB observational study starting points and most likely so, at least in part, because of RCT selection criteria.
For the purposes of an RCT it may not matter whether the starting HAQ is elevated because of chronic active disease or by virtue of a flare. However, it does matter if we want to draw long term inferences from the data. We suggest that the starting point for measurement is valid only if we believe that it is more than just a flare; that it is a semipermanent state that would not improve without this treatment.
Why are the starting points and results different for RCTs and observational studies? The observational study (or clinic) HAQ score will ordinarily be lower than the RCT HAQ score because the anti-TNF effect is added on to other prior treatments, such as increases in steroids, joint injections, non-steroidal anti-inflammatory drugs, and analgesics. In contrast, RCTs represent, in effect, a flare design in which added prior therapies are prohibited and in which patients must be on stable disease modifying antirheumatic drugs and corticosteroids for one to two months prior to the start of the anti-TNF therapy.
There is a second reason that the effect of anti-TNF therapy observed in RCTs (not subtracting treatment comparator) may be greater than that observed in observational studies: regression to the mean. Clinical trials often report the percentage of patients who are responders at the 20%, 50%, and 70% levels. However, responsiveness depends not only on drug efficacy but also strongly on the level of disease activity at the start of the trial—a measure of regression to the mean. To describe the extent of this effect, we plotted HAQ scores and amount of change in HAQ scores at the next clinic visit as a function of the previous HAQ score (fig 4). Data for this figure are from 726 clinic patients evaluated at the time of actual clinic visits. Data were collected prior to the introduction of anti-TNF therapy. Time between visits was less than six months (0.26 years (95% confidence interval 0.25 to 0.27). Positive values for the change in HAQ represents the extent or reduction in HAQ score that occurs at the next clinic visit while negative scores indicate the amount of HAQ increase between visits. Beginning at levels of 1.0, higher HAQ scores are associated with a straight line increase in next HAQ score change. HAQ scores less than 1.0 were associated with a negative improvement (worsening) in HAQ score in next clinic visit. Using linear regression, the increase in HAQ score difference was 0.24 (0.18 to 0.28) per unit of HAQ score. To place this in the context of anti-TNF RCTs, at a mean duration of RA of 10 years the initial values and increase in HAQ scores difference were 2.0 (0.20), 1.8 (0.15), 1.6 (0.10), 1.4 (0.05), 1.2 (0.0), and 1.0 (0.0). In an RCT these observations apply to active treatment and placebo, so the net effect of regression to the mean is nullified. However, the per cent improvement increases with the level of HAQ at onset, with the result that treatment arms in RCTs with more “severe” patients will show greater improvement (as long as comparison patient scores are not subtracted).

Graph of Health Assessment Questionnaire (HAQ) scores and amount of change in HAQ scores at the next clinic visit as function of the previous HAQ score. Data for this figure are from 726 clinic patients evaluated at the time of actual clinic visits. The mean time between visits was approximately three months. Positive values for the change in HAQ represents the extent or reduction in HAQ score that occurs at the next clinic visit while negative scores indicate the amount of HAQ increase between visits.
In contrast with RCTs, observational data banks do not have concomitant controls. Therefore the observed effect of treatment includes the treatment effect plus regression to the mean. However, regression to the mean is less in observational studies. Table 1 shows the transition matrix of HAQ scores for patients in the NDB. Initial and current scores are at six month intervals. For simplicity, HAQ scores are rounded to 0.5. In addition, we performed regression analyses on the non-rounded data. The increase in HAQ score difference per unit of HAQ was 0.13 (0.12 to 0.14). Adjusted to a mean RA duration of 10 years and duration difference between observation of three months, the initial values and increase in HAQ scores were 2.0 (0.13), 1.8 (0.11), 1.6 (0.08), 1.4 (0.06), 1.2 (0.03) and 1.0 (0.01). The difference between clinical trials and observational studies at an initial HAQ of 1.8 and 1.6 is 0.04 and 0.02.
Transition matrix of Health Assessment Questionnaire (HAQ) scores from 13 279 patients with rheumatoid arthritis and 56 256 questionnaires
From these data it can be seen that there is a small but real difference in the effect of regression to the mean, assuming that patients in RCTs and observational studies start at the same HAQ value. However, that assumption is not likely to be true (see fig 3). Among 556 patients assessed in their rheumatologist’s clinic at the time of starting infliximab, the initial HAQ score was 1.36. Using the regression to the mean data from the clinic (see fig 4), it can be expected that the effect of regression to the mean will be as much as 0.1 unit less than in RCTs. Using NDB HAQ data obtained at 24 months, three months before the start of anti-TNF therapy (see fig 3) the differential effect would increase further.
The above analyses indicate that, given the level of HAQ in practice at the start of anti-TNF therapy, non-RCT data will have improvement that is less than the improvement in RCTs by 0.1 units or greater. As the minimally clinically significant difference is said to be around 0.22–0.23,23–25 the reduction in apparent efficacy is important. Although the above analyses were performed on the HAQ, similar results are obtained when pain and global scores are evaluated.
The data in this report suggest that RCTs and observational studies assess efficacy and effectiveness in ways that are so different that results are often incommensurable. RCTs utilise flare design, patient selection, a control group, and regression to the mean. These aspects of RCTs work well within the RCT framework, but are problematical in clinical practice and observational studies. Observational studies, on the other hand, confound additional prior therapy and anti-TNF effect, do not employ control groups, and may have less regression to the mean.
The results of our analyses lead us to caution against using RCT results for cost effectiveness analyses,26–29 as the flare design and patient selection process are biased towards greater responsiveness. In addition, and even more important, there is little evidence that the clinical state at the start of most anti-TNF RCTs represents a chronic state. Economic analyses that utilise this starting point overestimate the cost effectiveness of these therapies. One potential solution for these problems and a guide to understanding the real results of anti-TNF therapy lies in collecting pre clinical trial data in all patients who will enter clinical trials. Although this may at first seem burdensome, the requirement that physicians who wish to participate in RCTs administer questionnaires to their patients on an ongoing basis actually represents little extra effort; it can add enormously to the interpretability of RCT results. Finally, it would seem more appropriate when speaking of anti-TNF therapy to report results after subtracting the results of the comparison (control) group.
REFERENCES
Footnotes
-
The National Data Bank for Rheumatic Diseases has received grant support from Amgen, Aventis, Bristol Myers Squibb, Centocor, Pharmacia, and Pfizer pharmaceutical companies.