Article Text

Abstract
This paper presents the metacarpophalangeal (MCP) joint magnetic resonance images of the EULAR–OMERACT rheumatoid arthritis MRI reference image atlas. The illustrations include synovitis in the MCP joints (OMERACT RA magnetic resonance imaging scoring system (RAMRIS), grades 0–3), bone oedema in the metacarpal head and the phalangeal base (grades 0–3), and bone erosion in the metacarpal head and the phalangeal base (grades 0–3, and examples of higher grades). The presented reference images can be used to guide scoring of MCP joints according to the OMERACT RA MRI scoring system.
- EULAR, European League Against Rheumatism
- Gd, gadolinium containing contrast agent
- MCP, metacarpophalangeal
- MRI, magnetic resonance imaging
- OMERACT, Outcome Measures in Rheumatology Clinical Trials
- RA, rheumatoid arthritis
- magnetic resonance imaging
- erosion
- metacarpophalangeal joint
- rheumatoid arthritis
- synovitis
Statistics from Altmetric.com
- EULAR, European League Against Rheumatism
- Gd, gadolinium containing contrast agent
- MCP, metacarpophalangeal
- MRI, magnetic resonance imaging
- OMERACT, Outcome Measures in Rheumatology Clinical Trials
- RA, rheumatoid arthritis
The metacarpophalangeal (MCP) joints are among the most frequently involved joints in rheumatoid arthritis (RA), including early RA, and assessment of MCP joints is included in conventional radiological and clinical scoring systems.1–4 Accordingly, studies using magnetic resonance imaging (MRI) in RA have often focused on the MCP joints. MCP joints are also favoured because they are easier to image with sufficient image quality and resolution than the smaller interphalangeal joints and are somewhat easier to interpret than the more complex wrist joints.
MRI of MCP joints is better validated than any other small joint in RA. A close correlation between MRI and miniarthroscopy assessments of synovitis and bone damage has been demonstrated in RA MCP joints.5 The majority of the validation studies of MRI in RA performed by members of the Outcome Measures in Rheumatology Clinical Trials (OMERACT) and European League Against Rheumatism (EULAR) groups have included MCP joints,6–9 and MCP joint scoring is part of the OMERACT 2002 RA MRI scoring system (RAMRIS).10
The aim of this part of the EULAR–OMERACT RA magnetic resonance imaging reference image atlas is to provide MCP joint reference images for scoring according to the RAMRIS (described in detail by Østergaard et al in this supplement11).
THE MCP JOINT REFERENCE IMAGES
Example images are provided for semiquantitative scoring of bone erosions and bone oedema in the metacarpal head and the phalangeal base, and for a global MCP joint synovitis assessment. The MCP joints were considered sufficiently uniform for one series of illustrations to give adequate guidance for scoring all the MCP joints.
Representative examples of each grade of synovitis and a selection of grades for bone abnormalities are presented. In order to provide a “user friendly” atlas, the images of the individual abnormality are presented on opposing pages in vertical rather than horizontal format. Each set of images has a scout image that will enable the reader to locate the joint site imaged.
For most of the images presented here, MRI scans of the dominant hand’s second to fifth MCP joints were taken using a commercially available 1.5 T Gyroscan ACS NT (Philips Medical Systems, Best, the Netherlands) whole body MRI system. The examples for this atlas were selected by consensus. Details of the selection process and applied MRI sequences can be found in the paper by Bird et al in this supplement.12
A description of the reference image sheets presented on the following pages, and how to use them, is provided in figs 1–3 (see page 20).
We hope the presented reference images will be useful to guide scoring of MCP joints according to the OMERACT RA MRI scoring system.

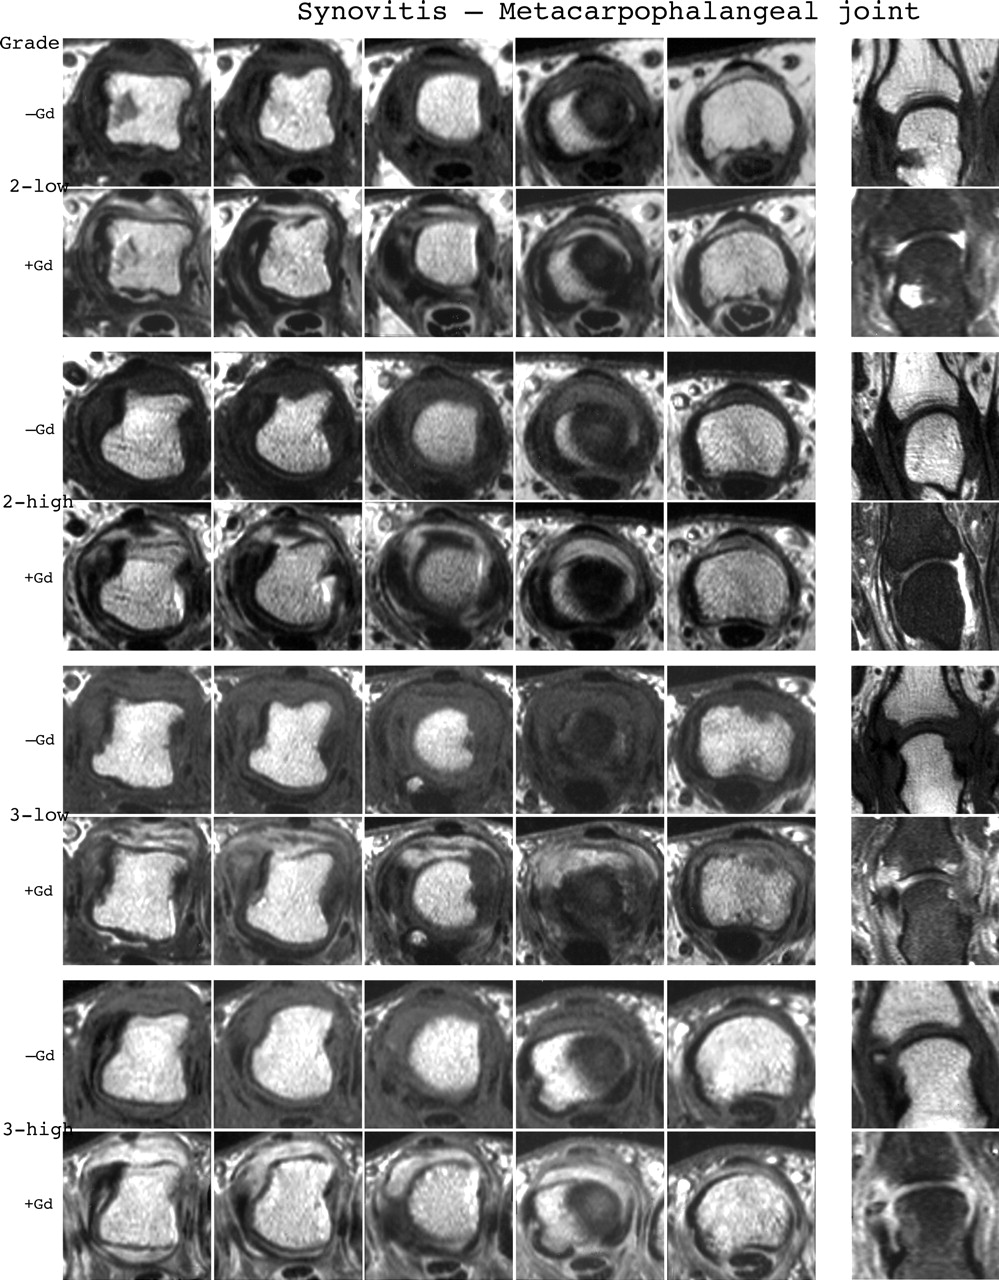

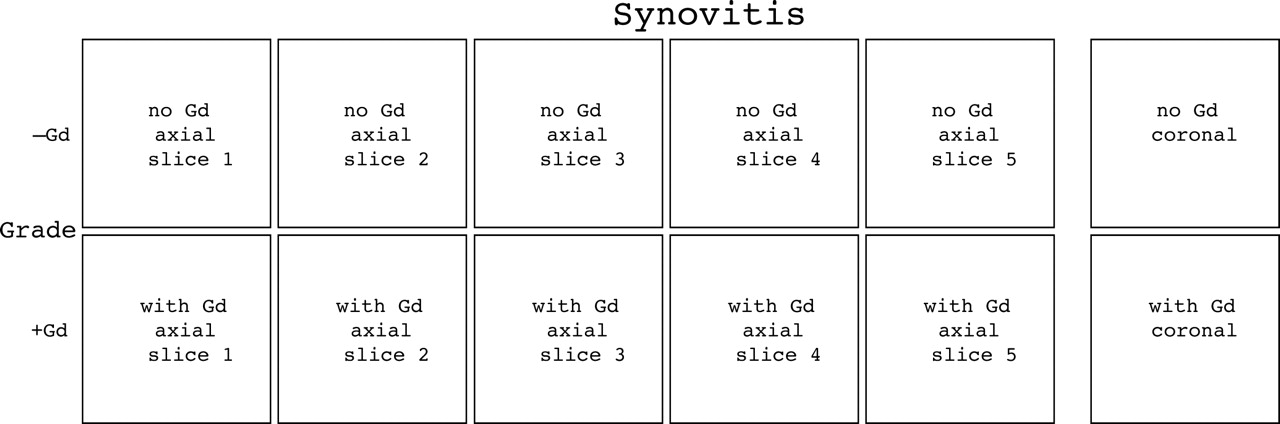
Synovitis reference image sheets (pages i12–i13, total 2). Reference images for MCP joint synovitis grades 0–3 are presented on two opposing pages. Examples are provided from the low end and high end of each grade. Synovitis is graded 0–3 (normal, mild, moderate, severe) as estimated by thirds of the presumed maximum volume of enhancing tissue as described in the OMERACT RAMRIS (see table 1, reference 17). The MRI set to be assessed should be compared with the axial precontrast and postcontrast T1 weighted reference images and the joint assigned the score of the best possible match. The first MCP joint should not be scored. All axial slices covering the joint should be taken into account. Each of the second to fifth MCP joint should be scored separately. A total score (range 0–12) can be calculated. The diagram above describes the positions and types of images included.


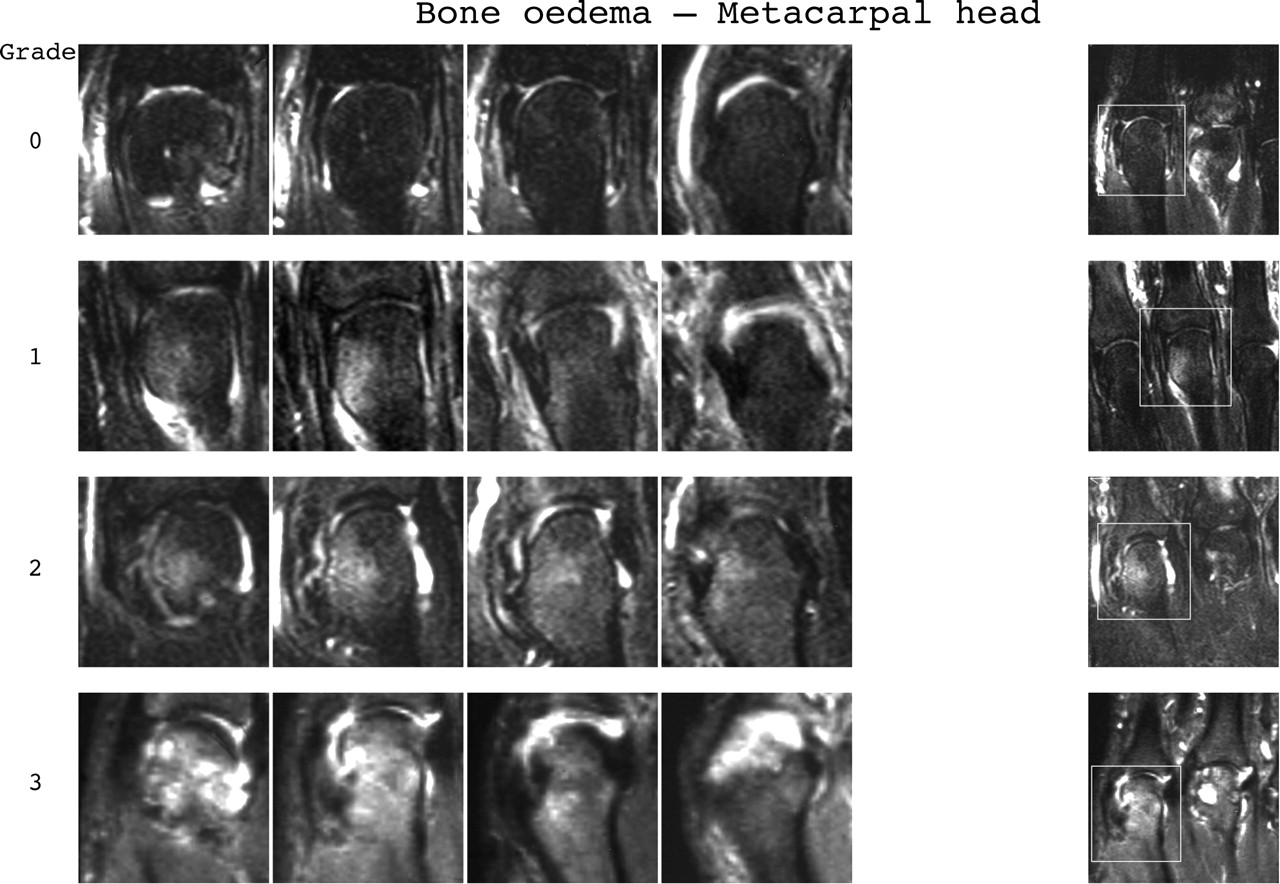
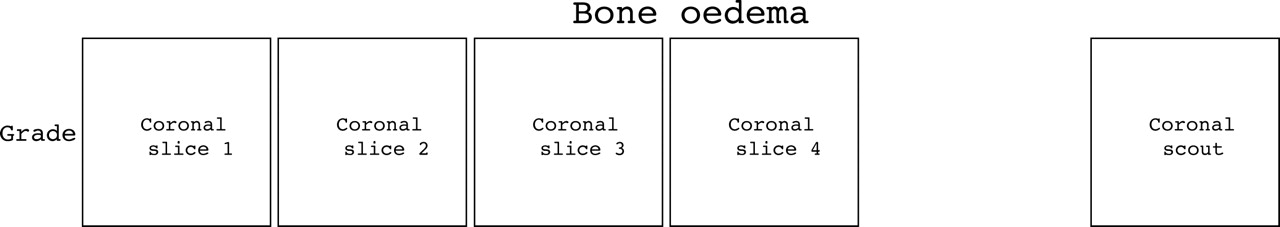
Bone oedema reference image sheets (pages i14–i15, total 2). Bone oedema in the metacarpal head and phalangeal base is illustrated on one single-page sheet each. All grades (0–3) are presented. Bone oedema grading is by percentage volume (0–3, by 33% volume increments) of the assessed bone as described in the OMERACT RAMRIS (see table 1, reference 11). The “assessed bone volume” is from the articular surface (or its best estimated position if absent) to a depth of 1 cm. All coronal slices covering the bone need to be assessed to estimate the percentage of the total volume occupied by the oedema. If erosion and oedema are concurrently present, oedema is scored as the proportion of the original bone. The T2 weighted fat saturated reference images of this atlas can be used for guidance and calibration. Each bone of the second to fifth MCP joint should be scored separately. A total score (range 0–24) can be calculated. The diagram above describes the types and positions of images presented.


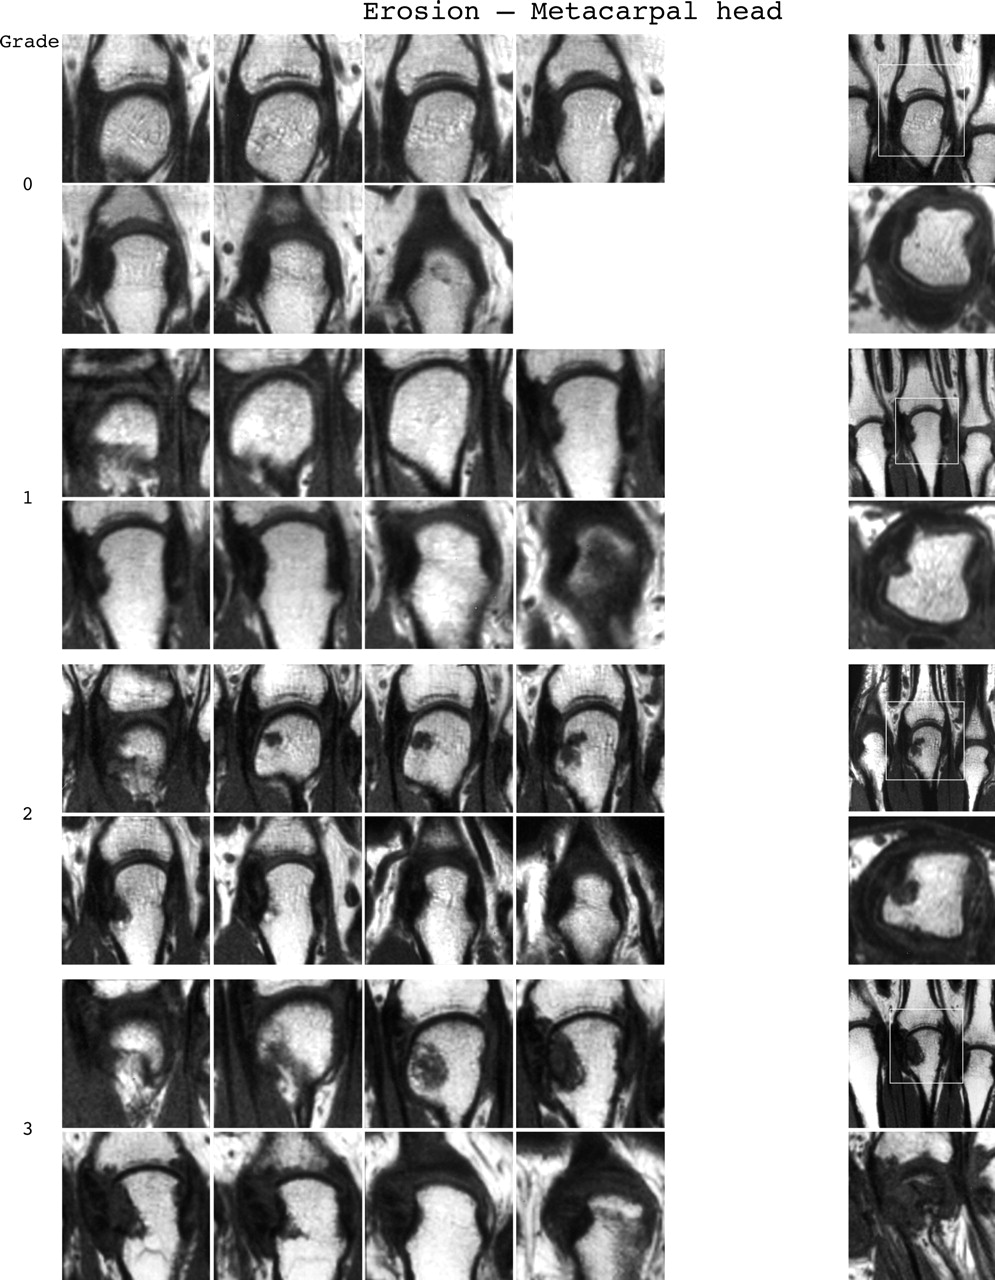
Bone erosion reference image sheets (pages i16–i19, total 4). Bone erosion in the metacarpal head and phalangeal base is illustrated on two single-page sheets each. Grades 0–3 supplemented with examples of three higher grades are presented. Bone erosion grading is by percentage volume (0–10, by 10% volume increments) of the assessed bone volume as described in the OMERACT RAMRIS (see table 1, reference 11). The “assessed bone volume” is defined as described above. The atlas reference images can be used for guidance and calibration. All coronal slices covering the bone should be assessed to estimate the percentage of the total volume occupied by the erosion. The varying number of coronal slices needed to cover the bone reflects varying bone sizes and varying slice thickness (1.5–3 mm). A total score (range 0–80) can be calculated. The diagram above describes the types and positions of images presented.
Acknowledgments
Photographer S Østergaard is acknowledged for skilful assistance with image preparation and set-up.
The European League Against Rheumatism (EULAR) is acknowledged for financial support of the publication of this atlas.