


Abstract
Context: Little is known of associations between hip geometry and skeletal regulators. This is important because geometry is a determinant of both hip function and resistance to fracture.
Objective: We aimed to determine the effects of sex hormone status and other candidate regulators on hip geometry and strength.
Subjects and Methods: A random sample of 351 women aged 67–79 had two to four hip dual-energy x-ray absorptiometry scans performed over 8 yr of follow-up. Hip structural analysis software was used to measure subperiosteal diameter (PD) and the distance from the center of mass to the lateral cortical margin (d-lat) on three 5-mm-thick cross-sectional regions: narrow neck, intertrochanter, and shaft. Section modulus (Z), bone mineral density (grams per centimeter squared), and an index of bone mineral content (cross-sectional area) were calculated as estimators of bone strength. Serum analytes measured at baseline included SHBG, estradiol, PTH, creatinine, albumin, vitamin D metabolites, and glutamate- and γ-carboxyglutamate-osteocalcin (OC). A linear mixed model was used to model associations with predictor variables, including testing whether the predictors significantly modified the effect of aging.
Results: Aging was associated with increasing PD and d-lat, and higher baseline SHBG significantly modified this effect, in the case of PD, increasing the rates of change at the narrow neck region by 19% for SHBG level 2 sd higher than population mean (P = 0.026). Higher baseline creatinine was independently associated with faster increases in PD and d-lat with aging (P < 0.041). Z declined faster with aging if baseline PTH was higher, and higher albumin had a contrary effect. Z was positively associated with free estradiol and inversely associated with SHBG and glutamate-OC.
Conclusion: These results show large effects of SHBG on the regulation of proximal femur expansion and bending resistance, probably acting as a surrogate for low bioavailable estrogen. Potentially important effects for fracture resistance in old age were also revealed for PTH, markers related to renal function and the nutritional markers albumin and undercarboxylated OC.
REDUCED LEVELS OF estrogens may promote postmenopausal osteoporosis through increasing bone turnover (1) and osteocyte death (2). Uncertainty remains concerning other skeletal responses (3–6). Very low circulating levels of estrogens predict fractures (7–9). Loss of bone mineral density (BMD; grams per centimeter squared) is significantly associated with lower sex hormone levels (10–13). However, there is increasing interest in those determinants of fracture risk not expressed by BMD, collectively referred to as bone quality, of which one is bone geometry (14, 15). BMD as calculated clinically includes one aspect of geometry: a bone’s projected area appears in the denominator, and at the femoral neck, the denominator is effectively the bone’s width. Other aspects of bone geometry may be important in determining fracture resistance, although this remains controversial (16, 17). The association between geometry and estrogen levels has been studied only at peripheral measurement sites (18, 19), but the proximal femur is the most appropriate site for assessing hip fracture risk (20).
Mechanical principles suggest that the femur gains structural rigidity as its subperiosteal diameter (PD) increases (21). Paradoxically, increasing its diameter can increase risk of the femoral neck’s elastic stability being exceeded leading to its collapse under compression (e.g. in a sideways fall), while at the same time increasing its bending resistance (22). If bone mass remains constant, cortical thickness may reduce as the diameter of the bone increases. In the proximal femur, cortical thickness is least for the superolateral (SL) cortex (22). Other factors determining the local elastic stability of the SL cortex are its local curvature and the support received from subcortical trabeculae (22). Thus, there are two contrasting mechanical models for hip fracture, involving failure in bending and failure in compression.
To investigate the extent to which sex hormone status determines the rates of expansion in PD of the proximal femur, we modeled data from female participants in the longitudinal population-based European Prospective Investigation of Cancer (EPIC)-Norfolk study who had multiple measurements of hip BMD. Our aim was to see whether estrogen-related analytes measured at recruitment and also those related to dietary adequacy in protein and vitamin K were independent determinants of continued bone health in old age, after adjusting for other known statistical determinants.
Subjects and Methods
Subjects
A random sample of Caucasian women (n = 781) aged 65–74 was recruited within the EPIC study in Norfolk, United Kingdom (23). An information sheet detailing the purpose of the study was sent to eligible subjects, and their informed consent to participate in the study obtained. The study was approved by the Norwich district ethics committee. A response rate of 90% was achieved. Each subject answered an entry questionnaire, had anthropometric and BMD measurements, and gave a fasting morning blood sample. Serum was separated and stored at −70 C. The flow chart in Fig. 1 shows follow-up details. The results presented in this paper are based on data from the 414 women who had sex hormone measurements and hip structural analysis (HSA). Data from subjects who were ever treated with bone active medication or had a different hip scanned on follow-up scans (usually due to hip surgery) were excluded from the dates these events occurred.
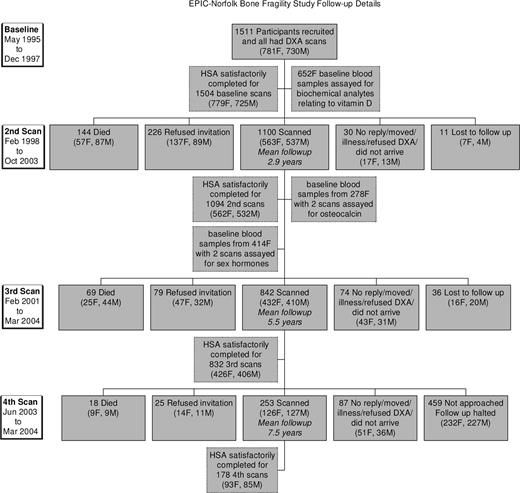
Flow chart showing follow-up details in the EPIC-Norfolk bone fragility study.
Bone measurements
Bone mineral density (BMD) was measured at the hip using dual-energy x-ray absorptiometry (DXA; Hologic QDR 1000W) on up to four occasions spaced over 8 yr of follow-up (Fig. 1). To minimize possible effects of seasonal variations, each measurement was scheduled within 6 weeks of the anniversary of the first measurement.
HSA software by Beck et al. (24, 25) was used to estimate the dimensions of bone cross-sections at specific locations (Fig. 2) and also bending resistance. Bone cross-sectional area (CSA), cross-sectional moment of inertia, and the outer periosteal diameter of the bone (PD) were derived from the DXA mass profile. BMD is the average pixel value, whereas CSA is analogous to bone mineral content (BMC). Section modulus (Z) is computed as cross-sectional moment of inertia/dmax, where dmax or lateral distance is the maximum distance from center of mass of the cross-section to the lateral cortical margin (because it was always greater than the medial).
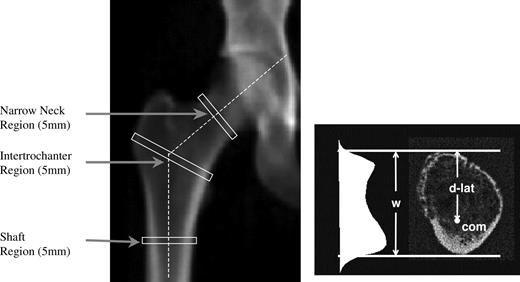
DXA image showing location of HSA regions and an example of a cross-section through the NN region to show the bone mass profile, center of mass (com), bone width (w) and the distance from the center of mass to the lateral cortical margin (d-lat).
Three thin cross-sectional regions approximately 5 mm thick were analyzed (Fig. 2). These were obtained by averaging the geometries from five parallel lines of pixels traversing the bone. The regions were the narrow neck (NN), centered on the femoral neck’s narrowest diameter; intertrochanter (IT); and the shaft (S). The IT cross-section traverses the femur along the bisector of the neck-S angle, whereas the S region crosses at a point 1.5 times the neck width distal to the intersection of the neck and S axes. Endosteal diameters were also estimated using crude assumptions concerning shape and uniformity of cortical thickness. A template saved from the baseline scan helped ensure congruence of analysis regions in follow-up scans (26).
Biochemical measurements
The following biochemical analytes were measured in 652 randomly selected women as part of a study of vitamin D status contrasting Caucasians and south Asians: PTH, creatinine, albumin, calcium, phosphate, potassium, sodium, iron, 25 hydroxyvitamin D [25(OH)vitD], and 1,25 dihydroxyvitamin D [1,25(OH)2vitD]. As part of a subsequent study of sex hormones and cancer, we next preselected for assay serum samples from 414 women who already had two repeat bone density scans (Fig. 1). The additional analytes measured were: SHBG, estradiol (E2), dehydroepiandrosterone sulfate (DHEAS), and FSH. Finally, as part of a study on vitamin K status and diet, 278 serum samples were randomly selected from among the 414 and assayed for undercarboxylated and carboxylated [glutamate (Glu) and γ-carboxyglutamate (Gla)] osteocalcin (OC). In each case, limitations on numbers analyzed were imposed solely by financial constraints.
Biochemical methods
E2 was measured by RIA after prior extraction with diethyl ether (27). The within- and between-batch coefficients of variation were 7.6 and 17%, respectively, at a concentration of 27 pmol/liter. The sensitivity of the assay was 3.0 pmol/liter. Two methods were used for the SHBG determinations. For the first 72 subjects, SHBG was measured using a liquid-phase immunoradiometric kit (no. 68563; Orion Diagnostica Espoo, Espoo, Finland). The within- and between-batch coefficients of variation were 2.1 and 7.4%, respectively, at a concentration of 11 nmol/liter, and the sensitivity limit was 1.3 nmol/liter. Subsequently, a chemiluminescent immunoassay using an Immulite autoanalyzer from Diagnostic Products Corporation (Los Angeles, CA) was used. The analytical sensitivity was 0.2 nmol/liter, and at a concentration of 49 nmol/liter, the within-batch sensitivity was 4.6%. The between-batch variation was 5.7% at a concentration of 84 nmol/liter. Good concordance was demonstrated between SHBG values assayed by the two methods with an intraclass correlation coefficient of 0.99 and a between-assay coefficient of variation of 3%. Free E2 index was calculated as E2/(2.7211 × SHBG). DHEAS and FSH were measured by chemiluminescent immunoassay using an Immulite autoanalyzer from Diagnostic Products Corporation. For DHEAS, the sensitivity was 0.05 μmol/liter. The within-batch variation was 11% at a concentration of 2.3 μmol/liter, and the between-batch variation was 11% at a concentration of 2.5 μmol/liter. For FSH, the sensitivity was 0.1 mIU/ml, the within-batch variation was 5.4% at a concentration of 62 mIU/ml, and the between-batch variation was 7.0% at a concentration of 45 mIU/ml.
Vitamin D metabolites were measured by in-house assays as described previously (28, 29). Serum 25(OH)vitD was quantified by UV absorption after application to a second straight phase HPLC column (30). 1,25(OH)2vitD was quantified by in-house RIA using a monoclonal antibody (MAb) (29). Serum intact PTH was measured using an immunoradiometric assay (Nichols Institute Diagnostics, San Clemente, CA). Serum biochemistries (albumin, sodium, potassium, calcium, phosphate, iron, creatinine) were analyzed on a multichannel autoanalyzer (American Monitor Co., Indianapolis, IN).
Undercarboxylated and carboxylated (Glu and Gla) OC were determined by separate immunoassays in an ELISA sandwich format using the respective Glu-OC and Gla-OC kits from Takara Shuzo Co. (Otsu, Shiga, Japan). The immobilized, primary MAb of the Glu-OC kit specifically recognizes OC with Glu residues at sequence positions 21 and 24 (i.e. OC species in which two of the three Gla residues at positions 17, 21, and 24 are not carboxylated), whereas the enzyme-labeled MAb recognizes the 21–31 sequence of OC regardless of Glu-Gla status. The cross-reactivity with human bone OC (mainly carboxylated) is about 5%. The primary MAb of the Gla-OC kit detects OC forms having a 17-position Gla residue, whereas the enzyme-labeled MAb recognizes the 4–9 sequence of Gla-OC. There is no detectable cross-reactivity of the Gla-OC assay with completely decarboxylated OC.
Statistical analysis
Linear mixed regression modeling (see supplemental appendix published on The Endocrine Society’s Journals Online web site at http://jcem.endojournals.org) was used to fit a repeated measures ANOVA model to assess the association between sex hormones and PD or lateral distance in the three HSA regions of interest. Age at measurement (centered at age 74 yr, mean) was modeled as a random effect. Components of variance due to random variation in the mean PD or lateral distance were modeled by specifying a random intercept term. Longitudinal and cross-sectional effects were estimated using the model described in the supplemental appendix. Potentially explanatory variables were entered into the model if the type III Wald test indicated an effect that was significantly different from 0 (P < 0.05). Region of interest (NN, IT, and S) was included as a fixed effect, and any differences in the effect of the explanatory variables by region of interest were evaluated by testing whether the two-way interaction with region was significant. Physical activity (PA) variables associated with the hip structural variables in our previous analysis (31) were evaluated as potential confounders. To test whether any analyte significantly modified the effect of aging, continuous interactions with age were calculated. Whenever these were significant, the age-modifying effect of the analyte was studied by estimating the age coefficient with the analyte level fixed at three values: low, 2 sd below the mean; mid, mean; and high, 2 sd above the mean. Analysis was done using Stata version 9 statistical software (Stata Corporation, College Station, TX).
Results
Subject characteristics
Table 1 shows summary statistics for age, weight, height, and HSA analysis variables measured on up to four scan occasions in 351 women who had sex hormone measurements included in the current analysis. Among the 351 women, 343 (98%) had a second DXA scan at an average of 2.9 yr since baseline, 319 (91%) had a third scan at an average of 5.4 yr since baseline, and 76 (21%) had a fourth scan an average of 7.4 yr since baseline. The reason for fewer fourth round scans was due to follow-up of subjects being halted due to resource constraints (Fig. 1). There were no significant differences at baseline between those women in the sex hormone sample vs. women in the rest of the cohort in terms of mean weight (67.9 vs. 69.0 kg, P = 0.215), height (160 vs. 159 cm, P = 0.360), time spent on recreational PA (5.3 vs. 4.8 h/wk, P = 0.403), or lifetime PA score (6.6 vs. 6.6, P = 0.990), but those in the sex hormone sample were slightly younger (71.8 vs. 72.7 yr, P < 0.0001).
Descriptive statistics for anthropometry and hip structural analysis variables measured in the three hip regions shown in Fig. 2 in women: NN, IT, and S
| Variable | n | Scan 1 (mean ± sd) | n | Scan 2 (mean ± sd) | n | Scan 3 (mean ± sd) | n | Scan 4 (mean ± sd) |
|---|---|---|---|---|---|---|---|---|
| Time since baseline (yr) | 351 | 0 | 343 | 2.9 ± 0.9 | 319 | 5.4 ± 0.7 | 76 | 7.4 ± 0.5 |
| Age (yr) | 351 | 71.8 ± 2.9 | 343 | 74.7 ± 3.0 | 319 | 77.3 ± 3.0 | 76 | 79 ± 2.8 |
| Weight (kg) | 351 | 67.9 ± 10.8 | 342 | 67.9 ± 10.7 | 313 | 67.3 ± 11.1 | 76 | 66.9 ± 11.3 |
| Height (cm) | 351 | 159.6 ± 5.8 | 343 | 159.1 ± 5.9 | 318 | 158.7 ± 5.8 | 76 | 158.7 ± 5.4 |
| PD (cm) | ||||||||
| NN | 351 | 3.26 ± 0.27 | 343 | 3.34 ± 0.29 | 319 | 3.38 ± 0.31 | 76 | 3.38 ± 0.31 |
| IT | 349 | 5.53 ± 0.34 | 341 | 5.57 ± 0.33 | 317 | 5.59 ± 0.32 | 74 | 5.60 ± 0.32 |
| S | 348 | 3.14 ± 0.22 | 342 | 3.16 ± 0.23 | 319 | 3.17 ± 0.22 | 76 | 3.18 ± 0.22 |
| Lateral distance (cm) | ||||||||
| NN | 351 | 1.74 ± 0.16 | 343 | 1.77 ± 0.16 | 319 | 1.79 ± 0.17 | 76 | 1.80 ± 0.19 |
| IT | 349 | 3.04 ± 0.22 | 341 | 3.07 ± 0.22 | 317 | 3.09 ± 0.22 | 74 | 3.10 ± 0.24 |
| S | 348 | 1.57 ± 0.13 | 342 | 1.58 ± 0.14 | 319 | 1.58 ± 0.14 | 76 | 1.59 ± 0.13 |
| Endosteal diameter (cm) | ||||||||
| NN | 351 | 2.97 ± 0.29 | 343 | 3.04 ± 0.31 | 319 | 3.08 ± 0.33 | 76 | 3.06 ± 0.33 |
| IT | 346 | 4.91 ± 0.38 | 340 | 4.96 ± 0.37 | 317 | 4.97 ± 0.37 | 74 | 4.95 ± 0.40 |
| S | 348 | 2.30 ± 0.34 | 342 | 2.32 ± 0.35 | 319 | 2.32 ± 0.35 | 76 | 2.30 ± 0.35 |
| Z (cm3) | ||||||||
| NN | 351 | 1.20 ± 0.25 | 343 | 1.23 ± 0.26 | 319 | 1.29 ± 0.29 | 76 | 1.35 ± 0.34 |
| IT | 349 | 3.80 ± 0.79 | 341 | 3.78 ± 0.80 | 317 | 3.87 ± 0.83 | 74 | 4.04 ± 0.88 |
| S | 348 | 2.12 ± 0.38 | 342 | 2.13 ± 0.39 | 319 | 2.20 ± 0.38 | 76 | 2.27 ± 0.37 |
| CSA (cm2) | ||||||||
| NN | 351 | 2.38 ± 0.40 | 343 | 2.41 ± 0.42 | 319 | 2.51 ± 0.45 | 76 | 2.62 ± 0.55 |
| IT | 349 | 4.09 ± 0.74 | 341 | 4.06 ± 0.76 | 317 | 4.13 ± 0.78 | 74 | 4.32 ± 0.88 |
| S | 348 | 3.55 ± 0.59 | 342 | 3.53 ± 0.62 | 319 | 3.60 ± 0.60 | 76 | 3.69 ± 0.58 |
| BMD (g/cm2) | ||||||||
| NN | 351 | 0.768 ± 0.130 | 343 | 0.762 ± 0.136 | 319 | 0.781 ± 0.138 | 76 | 0.816 ± 0.172 |
| IT | 349 | 0.779 ± 0.144 | 341 | 0.767 ± 0.145 | 317 | 0.778 ± 0.150 | 74 | 0.814 ± 0.179 |
| S | 348 | 1.192 ± 0.213 | 342 | 1.181 ± 0.222 | 319 | 1.200 ± 0.215 | 76 | 1.226 ± 0.211 |
Because of the technical difficulty in detecting the bone edges, a small minority of scans were rejected for HSA. Table 2 shows descriptive statistics for the sex hormone variables and other biochemical analytes measured. Total OC was the sum of Glu- and Gla-OC fractions. In line with previous recommendations (32), the percentage of total OC as Glu-OC (%Glu-OC) was taken as a measure of vitamin K status (33).
Descriptive statistics for biochemical analytes measured in the women
| n | Mean ± sd | Median (5th and 95th) percentiles | |
|---|---|---|---|
| SHBG (nmol/liter) | 347 | 63.56 ± 28.16 | 60 (27, 118) |
| E2 (pmol/liter) | 337 | 26.61 ± 30.57 | 19 (7, 81) |
| Free E2 indexa | 333 | 0.18 ± 0.21 | 0.12 (0.03, 0.55) |
| FSH (mIU/ml) | 158 | 80.47 ± 28.48 | 79 (36, 132) |
| DHEAS (μmol/liter) | 158 | 1.66 ± 0.97 | 1.5 (0.4, 3.5) |
| Sodium (mmol/liter) | 285 | 136.79 ± 8.06 | 137 (125, 146) |
| Potassium (mmol/liter) | 277 | 4.28 ± 0.40 | 4.3 (3.6, 4.9) |
| Creatinine (μmol/liter) | 285 | 94.29 ± 14.14 | 93 (74, 119) |
| Calcium (mmol/liter) | 285 | 2.29 ± 0.31 | 2.35 (1.73, 2.60) |
| Corrected calcium (mmol/liter) | 285 | 2.29 ± 0.29 | 2.34 (1.85, 2.55) |
| Phosphate (mmol/liter) | 285 | 1.15 ± 0.16 | 1.15 (0.91, 1.43) |
| Albumin (g/liter) | 285 | 39.96 ± 3.12 | 40 (34, 44) |
| Iron (μmol/liter) | 285 | 17.15 ± 4.81 | 17 (10.5, 25.7) |
| PTH (pg/ml) | 298 | 32.53 ± 16.67 | 28.9 (13.8, 64.3) |
| 25(OH)VitD (ng/ml) | 290 | 23.48 ± 8.1 | 22.8 (11.5, 37.4) |
| 1,25(OH)2VitD (pg/ml) | 288 | 35.31 ± 11 | 35 (20, 55) |
| Glu-OC (ng/ml) | 204 | 6.96 ± 4.52 | 6.1 (2.2, 13.4) |
| Gla-OC (ng/ml) | 204 | 12.84 ± 6.52 | 12.4 (5.4, 21.4) |
| Total OC (ng/ml) | 204 | 19.8 ± 8.9 | 19 (10.2, 30.4) |
| % Glu-OC (%) | 204 | 35.22 ± 14.55 | 34.94 (13.87, 60.34) |
Calculated as: E2/(2.7211 × SHBG).
Determinants of bone mass and density
In a multivariable model for determinants of CSA, the analog of bone mineral content, aging was associated with significant longitudinal increases in the three regions [NN, 0.033; 95% confidence interval (CI) (0.025, 0.041) cm2/yr; IT, 0.021 (0.013, 0.029) cm2/yr; and S, 0.023 (0.014, 0.031) cm2/yr, all P < 0.0001]. Baseline albumin levels 2 population sd values above the mean augmented the longitudinal effect of aging on CSA by 0.020 cm2/yr (P < 0.0001), whereas PTH values 2 sd above the mean diminished this effect by 0.009 cm2/yr (P = 0.020). The cross-sectional effect of age on CSA was significant only at the S region, decreasing by −0.039 (−0.065, − 0.012) cm2/yr, whereas height and weight were both positively associated with CSA longitudinally and cross-sectionally in all regions (P < 0.079). Higher values for SHBG, Glu-OC, and 1,25(OH)vitD were independently associated with having lower CSA at baseline (P < 0.036), whereas higher free E2 index and lifetime PA were independently associated with having a higher CSA at baseline (P = 0.016).
Aging was associated with increasing BMD longitudinally [NN, 0.006; 95% CI (0.004, 0.008) g/cm2·yr, P < 0.0001; IT, 0.002 (0.000, 0.004) g/cm2·yr, P = 0.089; and S, 0.006 (0.004, 0.008) g/cm2·yr, P < 0.0001]. In contrast, despite not attaining statistical significance, there was a trend toward the cross-sectional effect of age on BMD to be negative, but the estimates were imprecise [NN, −0.006; 95% CI (−0.014, 0.001) g/cm2·yr, P = 0.111; IT, −0.005 (−0.013, 0.002) g/cm2·yr, P = 0.185; and S, −0.017 (−0.025, − 0.009) g/cm2·yr, P < 0.0001]. Weight and height were positively associated with BMD, and the longitudinal estimates were more precise than the cross-sectional estimates. Baseline albumin and PTH levels significantly modified the longitudinal effect of aging. An albumin level 2 sd above the mean augmented the longitudinal effect of aging by 0.005 g/cm2·yr (P < 0.0001), whereas PTH values 2 sd above the mean diminished the effect by 0.002 g/cm2·yr (P = 0.042). Higher values for SHBG, Glu-OC, and 1,25(OH)vitD were independently associated with lower BMD (P ≤ 0.043) at baseline, whereas a higher free E2 index was borderline associated with higher baseline BMD (P = 0.071).
Determinants of PD and lateral distance
Table 3 summarizes the longitudinal and cross-sectional associations with PD and lateral distance. Aging was associated with increasing PD and lateral distance, and the rates of increase significantly differed by region of interest (Table 3 and Fig. 3). As evident from the width of the 95% CI and P values (Table 3), the longitudinal estimates were more precise than the cross-sectional estimates, as expected. Weight and height were each positively associated with PD and lateral distance, and the magnitude of these effects differed less by region of interest (P > 0.05 for interactions with region). Higher scores for lifetime PA were associated with having larger PD at baseline.
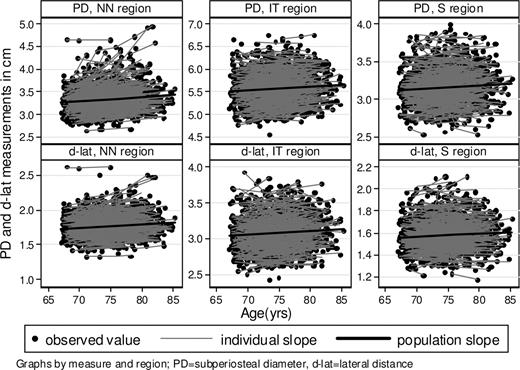
Graphs showing individual and population average longitudinal rates of change with age in PD and the d-lat in three HSA regions.
Multivariate regression coefficients for the effect of aging, sex hormones, and biochemical analytes on PD and lateral distance adjusted for body size and PA variables
| Effecta | PD | Lateral distance | ||||||||||
|---|---|---|---|---|---|---|---|---|---|---|---|---|
| Cross-sectional effects | Longitudinal effects | Cross-sectional effects | Longitudinal effects | |||||||||
| β | 95% CI | P | β | 95% CI | P | β | 95% CI | P | β | 95% CI | P | |
| Region | <0.0001 | <0.0001 | ||||||||||
| IT vs. NN | 2.347 | (2.283, 2.412) | <0.0001 | 1.341 | (1.300, 1.383) | <0.0001 | ||||||
| S vs. NN | −0.112 | (−0.176, −0.048) | 0.001 | −0.168 | (−0.209, −0.126) | <0.0001 | ||||||
| Age × region (per year) | 0.741 | <0.0001 | 0.838 | <0.0001 | ||||||||
| Region=NN | 0.008 | (−0.001, 0.018) | 0.090 | 0.016 | (0.012, 0.019) | 0.000 | 0.006 | (0.000, 0.012) | 0.055 | 0.007 | (0.005, 0.009) | <0.0001 |
| Region=IT | 0.013 | (0.003, 0.023) | 0.009 | 0.012 | (0.008, 0.015) | 0.000 | 0.008 | (0.002, 0.015) | 0.010 | 0.009 | (0.007, 0.011) | <0.0001 |
| Region=S | 0.008 | (−0.001, 0.018) | 0.095 | 0.003 | (−0.001, 0.007) | 0.095 | 0.006 | (0.000, 0.012) | 0.071 | 0.001 | (−0.001, 0.003) | 0.258 |
| Weight × region (per kg) | 0.146 | 0.080 | 0.350 | 0.337 | ||||||||
| Region=NN | 0.004 | (0.002, 0.007) | 0.002 | 0.004 | (0.001, 0.007) | 0.003 | 0.003 | (0.001, 0.004) | 0.005 | 0.001 | (0.000, 0.003) | 0.163 |
| Region=IT | 0.008 | (0.005, 0.011) | <0.0001 | 0.004 | (0.001, 0.007) | 0.003 | 0.004 | (0.002, 0.006) | <0.0001 | 0.002 | (0.000, 0.003) | 0.048 |
| Region=S | 0.005 | (0.002, 0.008) | 0.001 | 0.000 | (−0.002, 0.003) | 0.817 | 0.002 | (0.000, 0.004) | 0.041 | 0.000 | (−0.002, 0.002) | 0.960 |
| Height × region (per cm) | 0.047 | 0.051 | 0.306 | 0.214 | ||||||||
| Region=NN | 0.015 | (0.010, 0.020) | <0.0001 | −0.022 | (−0.034, −0.010) | 0.000 | 0.009 | (0.005, 0.012) | <0.0001 | −0.010 | (−0.018, −0.003) | 0.005 |
| Region=IT | 0.022 | (0.016, 0.027) | <0.0001 | −0.005 | (−0.017, 0.008) | 0.466 | 0.012 | (0.008, 0.015) | <0.0001 | −0.004 | (−0.011, 0.003) | 0.285 |
| Region=S | 0.013 | (0.008, 0.018) | <0.0001 | −0.003 | (−0.015, 0.010) | 0.679 | 0.009 | (0.005, 0.012) | 0.000 | −0.001 | (−0.009, 0.006) | 0.701 |
| Lifetime activity (per 1 U) | 0.014 | (0.002, 0.026) | 0.021 | 0.005 | (−0.003, 0.013) | 0.196 | ||||||
| SHBG (per 10 nmol/liter) | 0.019 | (0.011, 0.026) | <0.0001 | 0.011 | (0.006, 0.016) | <0.0001 | ||||||
| SHBG × age (per 10 nmol/liter) | 0.0038 | (0.0019, 0.0056) | <0.0001 | 0.0006 | (0.0001, 0.0012) | 0.026 | 0.0022 | (0.001, 0.0034) | <0.0001 | 0.0002 | (−0.0001, 0.0006) | 0.143 |
| Phosphate (per 1 nmol/liter) | 0.120 | (0.015, 0.225) | 0.025 | 0.072 | (0.003, 0.140) | 0.040 | ||||||
| Creatinine (per 10 μmol/liter) | −0.006 | (−0.020, 0.008) | 0.419 | −0.005 | (−0.014, 0.004) | 0.247 | ||||||
| Creatinine × age (per 10 μmol/liter) | 0.0017 | (−0.0023, 0.0056) | 0.413 | 0.0012 | (0.0000, 0.0024) | 0.041 | 0.0005 | (−0.0021, 0.0031) | 0.706 | 0.0010 | (0.0003, 0.0016) | 0.006 |
A × B, Interaction between variables A and B; the P value is shown on the same row. If B is a categorical variable (e.g. region), and A is a continuous variable (e.g. age), the coefficient of A was estimated for each level of B when the interaction was significant; otherwise, if no interaction between A and B was significant, the coefficient of A estimated to be common to all levels of B is shown. When both A and B are continuous variables, the coefficient of the A × B interaction is interpreted as the change in the effect of variable B when variable A is increased by the units shown in parentheses. The P values on the same row as the coefficients are for testing the null hypothesis that the coefficient is zero. Note that all continuous variables in the models were centered at their means to facilitate easy interpretation of coefficients. Details on estimation of longitudinal and cross-sectional effects are provided in the supplemental appendix.
SHBG and creatinine levels significantly modified the effect of aging on both PD and lateral distance, with higher values being associated with faster rates of increase. Figure 4 shows details of the further effects of SHBG and creatinine to modify the effects of age on PD and lateral distance. Baseline SHBG values 2 sd above the mean increased the longitudinal growth rate by 0.003 cm/yr for PD and 0.001 cm/yr for lateral distance in all three regions. Baseline creatinine values 2 sd above the mean increased the longitudinal rates of change with age by 0.003 cm/yr for PD and 0.003 cm/yr for lateral distance. In these models, neither E2 nor the calculated free E2 index had a significant additional effect. However, when SHBG was left out of the models, higher free E2 index was significantly associated with a slower rate of increase in PD with age (P = 0.023). Higher phosphate and SHBG levels were both associated with having larger PD and lateral distance at baseline (Table 3).
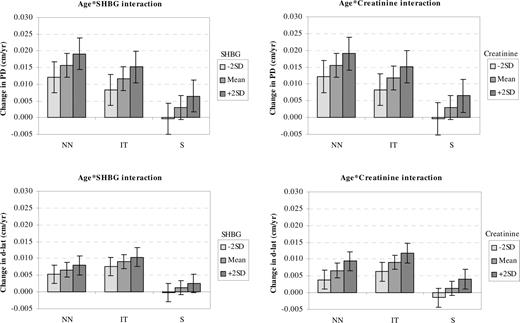
The estimated longitudinal mean rates of change with age for PD and d-lat at different values of baseline SHBG and creatinine to illustrate the significant interaction effect in Table 3. Error bars in the graphs, 95% CI for the rates of change.
Determinants of estimated bending resistance (Z) and other strength-related indices
For Z, our index of bending resistance, there were significant regional differences evident (Z greatest at IT and smallest at NN, P < 0.0001). Z was positively associated with weight, height, lifetime PA (borderline, P < 0.094), and age. Baseline albumin and PTH levels significantly modified the longitudinal effect of aging on the rate of Z increase. Albumin levels 2 sd above the mean increased the positive effect of aging by 0.014 cm3/yr (P < 0.0001), whereas PTH values 2 sd above the mean lowered the rate of Z increase with age by 0.010 cm3/yr (P = 0.004). Higher SHBG and Glu-OC were each independently associated with having lower Z (P < 0.011), whereas higher free E2 index was independently associated with having a higher Z (P = 0.014).
Determinants of endosteal diameter
This diameter, which is calculated from PD and an approximation to mean cortical thickness, significantly increased with age, and the rates of longitudinal increase differed by region of interest [NN, 0.019; 95% CI (0.014, 0.023) cm/yr; IT, 0.011 (0.006, 0.016) cm/yr; and S, 0.000 (−0.005, 0.005) cm/yr]. Higher baseline body weight was positively associated with NN and IT endosteal diameters (P < 0.041), and higher baseline height was positively associated with endosteal diameter in all regions (P < 0.003). Baseline SHBG significantly modified the effect of aging, increasing the rate of endosteal expansion by 0.005 cm/yr for a 2 sd difference in baseline SHBG (P = 0.015). Higher total OC was associated with having a larger endosteal diameter (P = 0.019).
Discussion
This analysis has shown independent effects of sex hormones and PTH, together with indices of renal function as well as of two nutrition-related indices, on the evolution of hip strength and structure with aging. There were contrasts evident between the effects of key determinants on variable measuring bone size and those estimating femur strength. SHBG and serum creatinine both increased the effect of aging, so as to accelerate the enlargement of bone diameter. PD was also increased at baseline by weight, height, lifetime PA (31), and plasma phosphate. In contrast, the strength parameters Z, BMD, and CSA (in HSA, this is the analog of bone mineral content because it measures the amount of bone surface area excluding soft tissue voids) shared a partly different set of determinants. Serum albumin was associated with their conservation, whereas PTH concentration had the opposite effect. All three strength indices were increased at baseline by a higher free E2 index, whereas all three were reduced at baseline by SHBG and undercarboxylated OC (Glu-OC). 1,25(OH)2vitD levels had an adverse statistical effect only on baseline BMD and CSA, suggesting caution in accepting this as of biological significance. As a parameter that reflects bone size, CSA was also influenced in the same direction as PD by height, weight, and lifetime PA. The results for endosteal diameter should be treated with some caution because of the assumptions that are required for its calculation.
These results suggest the following interpretation, which takes account of hormonal effects on bone growth at younger ages. Dimensional expansion of the proximal femur from the seventh decade might (as in puberty) be regulated by bioavailable estrogen, with this hormone suppressing both periosteal bone formation and endosteal bone resorption. For example, in the current study, the average postmenopausal woman increased femoral neck PD at an average rate of 0.016 cm/yr, whereas a woman with SHBG level 2 sd values higher than the population mean had a 19% higher rate of expansion (i.e. 0.019 cm/yr). The free E2 index was also a positive determinant of all three strength indices at baseline. SHBG as a protein that reduces bioavailable estrogen had an adverse statistical effect at baseline but did not increase the rate of decline in any strength index. The contrast with the data on bone size can be reconciled if low bioavailable E2 potentially encourages faster endosteal bone loss with eventual compensation by increased subperiosteal apposition of bone after some net loss of bone tissue. Power et al. (34) suggested that this could be triggered by increased mechanical strain and might occur in osteoporosis hip fracture. Thus, after a first, transient phase of postmenopausal bone loss, those who become more E2 deficient might, according to Frost’s mechanostat theory (35), have achieved a new equilibrium in their hip strength at a lower level of bone mineral content (22). This can in fact be achieved with little adverse effect on Z (36) through a more rapid rate of expansion of peri- and endosteal femoral diameters because bending resistance increases as PD increases, assuming CSA is held constant.
The most consistent effect among the sex hormone variables was that of SHBG; higher values significantly increased the rates of increase with age for PD, lateral distance, and endosteal diameter without decreasing BMD, CSA, or Z. Because SHBG is the main storage and transporter protein for sex hormones (37), it is likely that the associations with SHBG may be ascribed to SHBG reducing the bioavailability of E2. Alternatively it might be mediated through the SHBG receptor. A possible alternative is that SHBG, acting as a surrogate for insulin sensitivity, might be associated with the sensitivity of the skeleton to stimulation by insulin and the insulin-like growth factors. These results also suggest the need for a partial reinterpretation of older data. A number of studies have found similar effects on other bones to those we show above for BMD or BMD loss (10–13). The effect of E2 deficiency appears to reduce BMD proportionately more than BMC because it increases measured bone area at the same time as it reduces BMC and BMD is the quotient of BMC and bone area.
Previous reported associations with bone geometry variables include those of Ahlborg et al. (18), who found a significant negative correlation between E2 and change in PD at the distal radius over 19 postmenopausal years. In the study of osteoporotic fractures (38), current and past users of hormone replacement therapy had significantly higher values at the femoral neck for CSA than nonusers and more rapid gains in PD and endosteal diameter. However, past users behaved differently from current users in their relatively more rapid loss of CSA, Z, and cortical thickness. These results were not adjusted for lower physical activity and weight loss in nonusers. Heaney et al. (39) reported significantly slower rate of expansion of S PD in women who were more estrogen replete over a 21-yr study period.
Long bones increase their resistance to bending (but not compression) as their diameter expands even without apparent increases in bone mass (14, 15). However, recent work has shown that increases in bone diameter alone may increase bending resistance while potentially reducing elastic stability (or resistance to local buckling) in the thin SL cortex that is loaded maximally in a sideways fall (22). There is a threshold beyond which mechanical failure is likely to occur in compression loading during a fall if the loaded cortices had previously become too thin (26, 36). In our cross-sectional study of female femurs scanned by peripheral quantitative computed tomography (pQCT) ex vivo (22), cortical sectors in the SL region, which suffers compression loading in a sideways fall, lost 40–70% of cortical thickness over the adult life-span, whereas thickness was preserved in the inferomedial sectors (22).
Independent of the effects of SHBG and E2, higher creatinine increased the rate of increase in PD and lateral distance with age, whereas higher phosphate was associated with having larger PD and lateral distance. Both creatinine and phosphate concentrations are partly dependent on protein intake and related inversely to renal function. Higher albumin increased the rate of increase with age for Z, CSA, and BMD, whereas higher PTH had the reverse effect, inhibiting the rate of increase with age in these three outcomes as well as reducing plasma phosphate through increasing renal clearance. Albumin is widely interpreted as a clinical marker of nutrition, and low plasma albumin is associated with hip fracture (40). However, if raised PTH reflects principally secondary hyperparathyroidism, it might indicate that a supply of adequate vitamin D is necessary for optimizing hip structure. Vitamin D insufficiency [defined as 25(OH)vitD < 20 ng/ml] was evident in 36% of these women, who were reasonably representative of their peers.
Higher Glu-OC was associated with lower Z, CSA, and BMD. This is compatible with previous data indicating negative associations of Glu-OC with hip BMD (41, 42) or os calcis ultrasonic-transmitted velocity (43). Higher Glu-OC expressed either as absolute levels or as %Glu-OC has been related to increased fracture risk (44–48). In the current study, the associations of %Glu-OC with Z, CSA, and BMD were weaker when the former was substituted in place of Glu-OC and was not significant in the presence of Glu-OC in the model. Whether these associations with Glu-OC reflect vitamin K insufficiency or some other metabolic abnormality is unclear. Bioavailability of vitamin K to the osteoblast is probably best represented by %Glu-OC (32), but Szluc et al. (41) also found that the negative correlations with BMD were stronger for absolute concentrations of Glu-OC than for %Glu-OC. It is known that the Glu-OC assay detects, and may overestimate, certain undercarboxylated OC fragments and that fragment levels may be increased in high turnover states (32). It seems possible that the associations of Z, CSA, and BMD with Glu-OC might reflect in part an increased production of OC fragments, which may derive from several sources including bone resorption (49).
Our study has the strengths that it was longitudinal, population-based, and employed the most sensitive and accurate biochemical methodologies currently available. However, due to resource constraints, we could not measure every planned sample available; for example, testosterone, which can substantially vary in postmenopausal women and have an effect on bone width, was measured only in 64 of the women in this analysis, making it difficult to usefully model in these data. Also overall, our cohort might have been generally healthier than the rest of the population (a healthy volunteer effect). The longitudinal assessment of hip geometry and anthropometric variables in a relatively large number of subjects made it possible to account statistically for within- and between-subject random variations in the variables of interest. There are the limitations associated with the conceptual three-dimensional model of the proximal femur embodied in the hip strength analysis software. DXA technology, being two-dimensional, was not designed for the purpose of strength calculation, and problems with bone edge detection particularly in osteoporotic bones could contribute to greater measurement imprecision, but problematic scans were excluded from our analysis. The HSA program also makes broad assumptions as to the distribution of bone mineral between the bone cortices and the femur’s cancellous core, which affect the calculations of endosteal diameter. Another limitation was that we only assessed the biochemical analytes once at baseline and so the magnitudes of the regression coefficients for the analytes may be attenuated due to regression dilution over time. A possible explanation for the small increases rather than decreases in BMD with aging is that we were studying a comparatively healthy cohort.
In conclusion, we have demonstrated that the regulation of femoral neck geometry is complex and that other factors besides PA (31) and estrogen concentrations participate in its regulation. In particular, the complex effects of SHBG and E2 support the concept (34) that subperiosteal expansion might in part be a response to endocortical erosion regulated by feedback from the sensing of mechanical loading because in clinical observation, young paralyzed limbs have a markedly impaired ability to grow in diameter. Other important effects of albumin, creatinine, phosphate, and PTH on bone geometry were documented that require further elucidation. Additional studies are needed to clarify the respective roles of mechanical loading as imposed by PA, nutrition, sex hormone status, and renal function in determining the geometry, strength, and fracture resistance of the elderly female proximal femur. These are likely to include three-dimensional imaging to allow the partially separate and contrasting roles of the cortical and trabecular bone in the proximal femur to be studied more precisely.
E.B.M. is deceased.
Acknowledgments
We are grateful to Julia Harvey of the Vitamin K Research Unit, St. Thomas Hospital, for carrying out the OC measurements.
This work was supported by the Medical Research Council (Grant GG9321536) and by the United Kingdom Food Standards Agency (Grants N05046, AN0523, and N05036).
Results from this work were presented in part at the 2004 meeting of the American Society for Bone and Mineral Research, for which S.K. was a recipient of an American Society for Bone and Mineral Research Young Investigator award.
S.K., N.D., E.F., D.D., K.-T.K., N.L., and J.L.B. have nothing to disclose. T.J.B. consults with Hologic and developed the Hip Structure Analysis program licensed to Hologic Inc. M.J.S. received consulting and lecture fees from Fonterra Food (New Zealand). M.D. received consulting and lecture fees from AstraZeneca, Roche, Novartis, and Eli Lilly. J.R. consults with Proctor and Gamble and Eli Lilly.
Abbreviations:
- BMD
Bone mineral density;
- CI
confidence interval;
- CSA
cross-sectional area;
- DHEAS
dehydroepiandrosterone sulfate;
- d-lat
distance from the center of mass to the lateral cortical margin;
- DXA
dual-energy x-ray absorptiometry;
- E2
estradiol;
- EPIC
European Prospective Investigation of Cancer;
- Gla
γ-carboxyglutamate;
- Glu
glutamate;
- %Glu-OC
percentage of total OC as Glu-OC;
- HSA
hip structural analysis;
- MAb
monoclonal antibody;
- NN
narrow neck;
- IT
intertrochanter;
- OC
osteocalcin;
- 1
25(OH)2vitD, 1,25 dihydroxyvitamin D;
- 25(OH)vitD
25 hydroxyvitamin D;
- PA
physical activity;
- PD
subperiosteal diameter;
- S
shaft;
- SL
superolateral;
- Z
section modulus.
