Article Text

Abstract
Objectives In patients with gout, treating to target serum uric acid levels (sUA) of ≤6.0 mg/dL is universally recommended to prevent gout flare. However, there is no consensus on asymptomatic hyperuricaemia. Using Japanese health insurance claims data, we explored potential benefits of sUA control for preventing gout flare in subjects with asymptomatic hyperuricaemia.
Methods This retrospective cohort study analysed the JMDC Claims Database from April 2012 through June 2019. Subjects with sUA ≥8.0 mg/dL were identified, and disease status (prescriptions for urate-lowering therapy (ULT), occurrence of gout flare, sUA) was investigated for 1 year. Time to first onset and incidence rate of gout flare were determined by disease status subgroups for 2 years or more. The relationship between gout flare and sUA control was assessed using multivariable analysis.
Results The analysis population was 19 261 subjects who met eligibility criteria. We found fewer occurrences of gout flare, for both gout and asymptomatic hyperuricaemia, in patients who achieved sUA ≤6.0 mg/dL with ULT than in patients whose sUA remained >6.0 mg/dL or who were not receiving ULT. In particular, analysis by a Cox proportional-hazard model for time to first gout flare indicated that the HR was lowest, at 0.45 (95% CI 0.27 to 0.76), in subjects with asymptomatic hyperuricaemia on ULT (5.0<sUA ≤ 6.0 mg/dL), compared with untreated subjects (sUA ≥8.0 mg/dL).
Conclusions Occurrences of gout flare were reduced by controlling sUA at ≤6.0 mg/dL in subjects with asymptomatic hyperuricaemia as well as in those with gout.
Trial registration number UMIN000039985.
- gout
- epidemiology
- arthritis
Data availability statement
No data are available.
This is an open access article distributed in accordance with the Creative Commons Attribution Non Commercial (CC BY-NC 4.0) license, which permits others to distribute, remix, adapt, build upon this work non-commercially, and license their derivative works on different terms, provided the original work is properly cited, appropriate credit is given, any changes made indicated, and the use is non-commercial. See: http://creativecommons.org/licenses/by-nc/4.0/.
Statistics from Altmetric.com
Key messages
What is already known about this subject?
For adequate management of gout, guidelines around the world consistently recommend the use of urate-lowering therapy (ULT) to maintain serum uric acid levels (sUA) of ≤ 6.0 mg/dL.
What does this study add?
In both patients population with asymptomatic hyperuricaemia and those with gout, our study indicates that the occurrence of gout flare can be lowered by using ULT to maintain sUA≤6.0 mg/dL.
How might this impact clinical practice or future developments?
This study suggests that, in subjects with asymptomatic hyperuricaemia, control of sUA may provide long-term benefits by reducing or eliminating future occurrences of gout flare.
Introduction
In gout, hyperuricaemia causes abnormal urate deposition throughout the body.1 2 The disease manifests as painful gout flares, which occur episodically in many patients with gout and constitute a significant clinical burden.3 For adequate management of gout, guidelines around the world consistently recommend the use of urate-lowering therapy (ULT) in a treat-to-target approach to maintain serum uric acid levels (sUA) of ≤6.0 mg/dL.1 2 4–6
The risk of gout flare can be reduced by introducing ULT early in the clinical course of the disease,7 8 and European and US guidelines now generally recommend initiation of ULT at the first gout flare under specific conditions.4 5 However, there is no consensus on whether ULT should be prescribed prophylactically for patients with asymptomatic hyperuricaemia before the first gout flare. European and US guidelines do not recommend ULT for asymptomatic hyperuricaemia. This may be because there is insufficient accumulated data from patients with asymptomatic hyperuricaemia in those countries to provide appropriate guidance. In contrast, Japanese guidelines for gout and hyperuricaemia recommend the introduction of ULT under specific conditions to prevent gout flare in patients having asymptomatic hyperuricaemia with sUA of ≥8.0 mg/dL.2 6 As a result, real-world treatment outcome data from patients with asymptomatic hyperuricaemia have been collected in Japan in the course of daily clinical practice. Previously, we found that most patients with gout or asymptomatic hyperuricaemia failed to meet their sUA targets in Japan.9 Meanwhile, questions remain on whether ULT-induced reduction of sUA truly improves the patient’s subsequent clinical course or reduces disease burden. In addition, although randomised controlled trials (RCTs) of patients with asymptomatic hyperuricaemia have shown that the ULT febuxostat suppresses gout flares compared with placebo10 or control,11 12 real-world evidence is not yet available on the relationship between gout flare and sUA in such patients.
We used data from health insurance claims and medical check-ups in a real-world setting to explore the research question, ‘In patients with asymptomatic hyperuricaemia, is control of sUA (measured by whether or not sUA is maintained at ≤6.0 mg/dL or exceeds that amount) associated with subsequent risk of gout flare?’
Methods
Study design and setting
This retrospective cohort study incorporated data from the JMDC Claims Database, including records of Japanese health insurance claims and medical check-ups from April 2012 through June 2019. JMDC collects information from multiple in-country organisations that provide health insurance coverage to Japanese employees and their dependents.13 Data include diagnostic codes, drug prescriptions and information from annual medical check-ups for each person.
Subjects with sUA ≥8.0 mg/dL at one or more medical check-ups from 1 April 2013 to 31 March 2016 were identified. The study consisted of three distinct periods: the index period, period 1 and period 2. The index date was defined as the time of the earliest medical check-up showing sUA ≥8.0 mg/dL, and the month of that medical check-up was termed the index month. The index period was the year prior to (and excluding) the index date. Period 1 started on the index date and ended on the date of the subject’s next annual medical check-up (follow-up date). Period 2 started on the day after the follow-up date (figure 1).
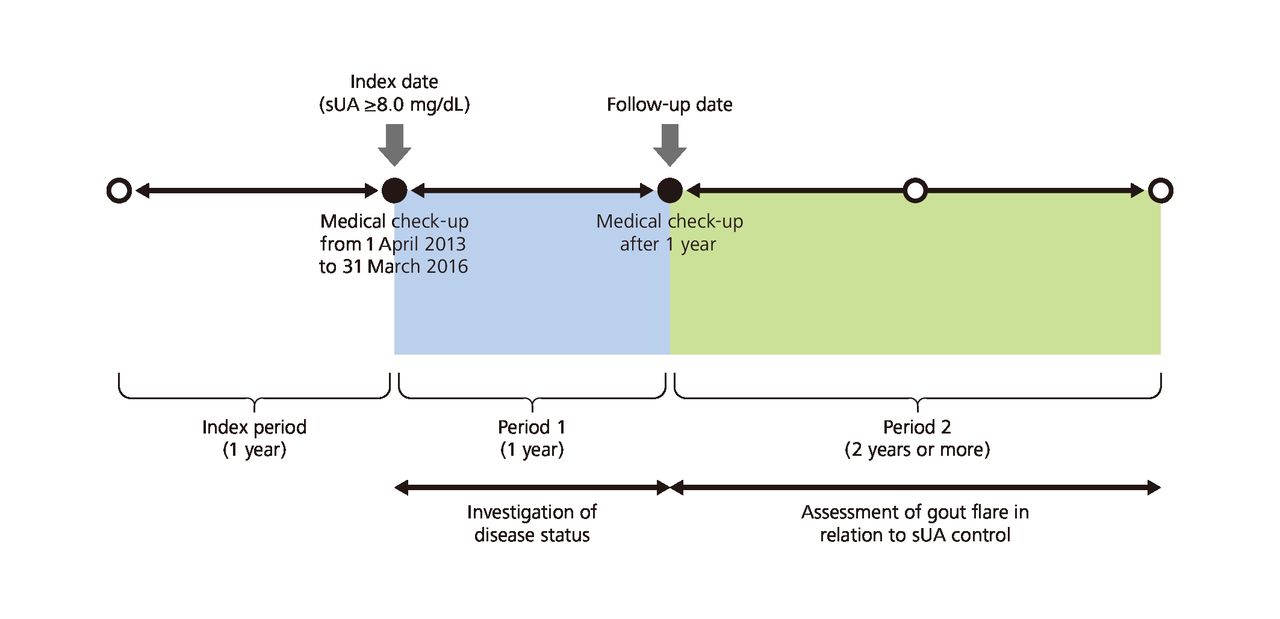
Study design. sUA, serum uric acid levels.
Participants
Subjects were included in the study if they had sUA≥8.0 mg/dL at one or more medical check-ups from 1 April 2013 to 31 March 2016, estimated glomerular filtration rate (eGFR) data available at the index date, and sUA data available 1 year after the index date, were at least 18 years of age on the index date, and were continuously registered in the JMDC Claims Database from 12 months before the index month to 24 months after the follow-up date.
To focus on patients who had asymptomatic hyperuricaemia (sUA ≥8.0 mg/dL) that was newly detected at a medical check-up after the index period, subjects were excluded from the study if at least once during the index period they were diagnosed with gout (ICD10 code M10) or asymptomatic hyperuricaemia (ICD10 code E790). Subjects were also excluded if they were prescribed ULT or if they were diagnosed with malignant tumours (ICD10 code C00-C97, D00-D09) during that period.
ULT was defined as any drug designated with ATC code M04 (antigout preparations), except for colchicine. Definitions of patient characteristics and drugs are presented in online supplemental table S1.
Supplemental material
Study measures
During period 1, disease status was investigated for each individual subject, including the presence or absence of a ULT prescription, the presence or absence of gout flare and sUA at the follow-up date.
During period 2, the relationship between gout flare and sUA control was assessed, including time to first onset and incidence rate of gout flare. These data were calculated for each disease status subgroup as determined in period 1.
In this study, we used the term ‘gout flare’ when two parameters were satisfied. The first was a diagnosis of gout (ICD10 code M10) and prescriptions for antirheumatics, non-steroidal plain (ATC code M01A1) or oral corticosteroids, plain (ATC code H02A2) or colchicine (generic name), shown on the same insurance claim form. For the second, we confirmed the intervals between prescriptions for the above-mentioned drugs. We interpreted an interval of ≥14 days between the end of prescription for one drug and start of prescription for another drug as evidence of newly occurring gout flare. We used the term ‘subject with gout’ to indicate a subject who experienced gout flare, as defined above, during period 1, excluding subjects for whom treatment was not required (no prescription for ULT, and sUA <8.0 mg/dL at the follow-up date) under Japanese treatment guidelines.2 Likewise, we used the term ‘subject with asymptomatic hyperuricaemia’ to indicate a subject who did not meet the definition of ‘subject with gout’ during period 1, excluding subjects for whom treatment was not required (no prescription for ULT, and sUA <8.0 mg/dL at the follow-up date).
Statistical methods
Our analysis included all subjects meeting the eligibility criteria. For period 1, an event tree was created using the presence or absence of a ULT prescription, the occurrence or non-occurrence of gout flare and sUA at the 1 year follow-up as the bifurcation points. Based on this event tree, subjects were classified into seven subgroups, including a group with sUA <8.0 mg/dL for whom treatment was not required.
The Kaplan-Meier method was used to estimate time to first gout flare in period 2 for each of the six disease status subgroups determined in period 1 (excluding subjects for whom no treatment was required). The median values and 95% CI were calculated. The time origin was the day after the follow-up date. For no events, the cut-off date was the first day of the month in which the subject terminated health insurance association membership. Univariable and multivariable analyses were performed using a Cox proportional-hazards model for subjects with asymptomatic hyperuricaemia and subjects with gout to calculate the HR. Explanatory variables were gender, age at follow-up date, eGFR at follow-up date, number of comorbidities and a combination of sUA range at follow-up date (sUA ≤5.0, 5.0<sUA ≤6.0, sUA ≤6.0, 6.0<sUA ≤7.0 and 7.0<sUA) and ULT usage (ULT (−) and ULT (+)) in period 1.
Among subjects with asymptomatic hyperuricaemia who were prescribed ULT during period 1, propensity score analyses compared the subject subgroups with sUA ≤6.0 mg/dL and sUA >6.0 mg/dL at the follow-up date. Details are provided in the online supplemental methods.
The incidence rate for gout flare during period 2 was calculated for each disease status subgroup as determined in period 1. Univariable and multivariable analyses, using a negative binomial regression model, were performed for each asymptomatic hyperuricaemia group and gout group to calculate the relative incidence rate. The explanatory variables were the same as used for Cox proportional-hazards model analysis. The log value of the follow-up period during period 2 was used as an offset variable.
All reported p values were two sided and were not adjusted for multiple testing. All analyses were performed using SAS V.9.4.
Results
Study population
The population of 811 587 subjects had at least one sUA measurement at one or more medical check-ups from 1 April 2013 to 31 March 2016, with records showing that 48 244 of them had sUA≥8.0 mg/dL. Of those, 19 261 subjects met the inclusion criteria and did not meet the exclusion criteria (figure 2).

Subject disposition. eGFR, estimated glomerular filtration rate; sUA, serum uric acid levels; ULT, urate-lowering therapy.
Subject characteristics
The overall study population (n=19 261) was predominantly man (98.3%), with a mean age ±SD of 43.2±9.4 years and mean sUA±SD of 8.47±0.53 mg/dL. The most frequent comorbidity was hypertension (13.5%), followed by hyperlipidaemia (11.5%) and renal dysfunction (eGFR <60 mL/min/1.73 m2; 11.3%). A large portion of subjects (71.6%) had no comorbidities (table 1).
Subject characteristics
Disease status during period 1
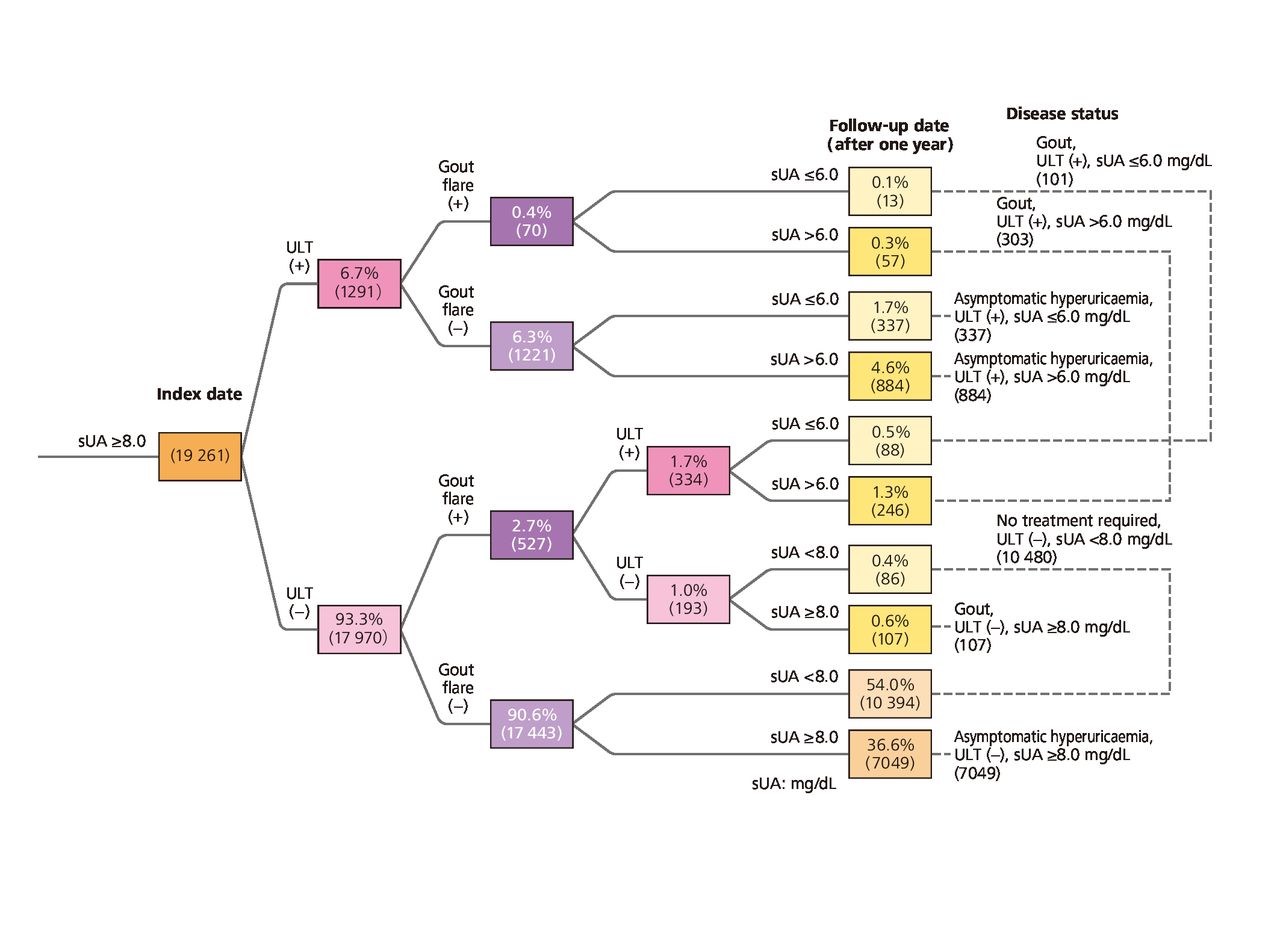
We developed an event tree and summarised our study findings in 10 final nodes on that event tree. We then established seven subgroups of disease status, based on the findings shown in those 10 final nodes. The largest group of participants (n=10 480) showed sUA <8.0 mg/dL at their next check-up and were classified as ‘no treatment required’. The next largest group consisted of patients who were not receiving ULT, had not experienced gout flare and continued to have sUA ≥8.0 mg/dL (n=7049). A total of 337 subjects with asymptomatic hyperuricaemia and 101 with gout had received ULT and reached sUA of ≤6.0 mg/dL by the follow-up date (figure 3).

Event tree analysis of disease status from index date to follow-up date (period 1). Parentheses indicate the number of subjects. For percentages, the denominator was 19 261 subjects. sUA, serum uric acid levels; ULT, urate-lowering therapy.
Subject characteristics, organised by disease status, are shown in online supplemental table S2. In subjects with gout and those with asymptomatic hyperuricaemia, the subgroup of subjects on ULT with sUA ≤6.0 mg/dL tended to be older and to have more comorbidities, including hypertension and hyperlipidaemia, compared with the other subgroups. The subgroup on ULT with sUA >6.0 mg/dL had a higher percentage of subjects with renal dysfunction than the other subgroups.
Occurrence of gout flare in subjects with asymptomatic hyperuricaemia during period 2
In subjects with asymptomatic hyperuricaemia, the time to first gout flare was longest (median not reached) in the subgroup of subjects with sUA ≤6.0 mg/dL. The time to first gout flare was comparable between the subgroup with sUA >6.0 mg/dL and the untreated subgroup (median not reached for either group) (figure 4).

Kaplan-Meier curve for time to first gout flare in period 2. sUA, serum uric acid levels; ULT, urate-lowering therapy.
The incidence rate of gout flare was 0.033 (95% CI 0.023 to 0.043) flares/person-year for the subgroup of subjects with asymptomatic hyperuricaemia prescribed ULT and having sUA ≤6.0 mg/dL, 0.083 (95% CI 0.074 to 0.093) flares/person-year for the subgroup prescribed ULT and having sUA >6.0 mg/dL and 0.081 (95% CI 0.078 to 0.084) flares/person-year for those without ULT (figure 5).

Incidence rate of gout flare during period 2. Numbers on top indicate the incidence rate, and numbers below them indicate the 95% CI. Brackets indicate the number of flares/person-year. Parentheses indicate the number of subjects. sUA, serum uric acid levels; ULT, urate-lowering therapy.
From the results of Cox proportional-hazards model for time to first gout flare among the subjects on ULT, the HR was the lowest of 0.45 (95% CI 0.27 to 0.76) in subjects on ULT (5.0<sUA ≤ 6.0 mg/dL) compared with non-ULT subjects (sUA ≥8.0 mg/dL). From the results of a negative binomial regression model, the relative incidence rate was the lowest, at 0.40 (95% CI 0.24 to 0.68), in subjects on ULT (5.0<sUA ≤ 6.0 mg/dL) compared with non-ULT subjects (table 2). Findings were also recorded for multivariable and univariable analyses of time to first gout flare (online supplemental table S3) and the incidence rate for gout flare (online supplemental table S4).
Covariate-adjusted analysis for time to first onset and incidence rate of gout flare in period 2
Propensity score analyses were performed on subjects with asymptomatic hyperuricaemia who were receiving ULT. The C statistic was 0.689, and the p value for the Hosmer-Lemeshow test was 0.381. The intergroup distributions of baseline characteristics for the inverse probability weighting and propensity score-matched cohorts were better balanced than for the original cohort (online supplemental table S5).
Findings from the Kaplan-Meier curve and Cox proportional-hazard model are shown in online supplemental figure S1 and table S6). The HR for sUA ≤6.0 mg/dL compared with sUA >6.0 mg/dL for average treatment effect in the inverse probability of weighting (IPW) cohort was 0.48 (95% CI 0.30 to 0.79). Subjects who received ULT during period 1 and who showed sUA ≤6.0 mg/dL tended to have fewer attacks of gout flare than subjects with sUA >6.0 mg/dL. The results were robust because all analyses of our data provided similar findings (online supplemental table S6).
Occurrence of gout flare in subjects with gout during period 2
Among subjects with gout, the Kaplan-Meier curve for the group with sUA ≤6.0 mg/dL crossed the curves for both the group with sUA >6.0 mg/dL and the untreated subgroup (figure 4). The median time to first gout flare was 158.3 (95% CI 120.6 to –) in the untreated group and 156.6 (95% CI 113.3 to 198.7) in the sUA >6.0 mg/dL group. The median value was not reached in the sUA ≤6.0 mg/dL group.
The gout flare incidence rate was 0.333 (95% CI 0.275 to 0.391) flares/person-year for those on ULT with sUA ≤6.0 mg/dL, 0.468 (95% CI 0.429 to 0.508) flares/person-year for those on ULT with sUA >6.0 mg/dL, and 0.491 (95% CI 0.423 to 0.560) flares/person-year for those who were not receiving ULT (figure 5). Based on results from a Cox proportional-hazards model, the HR was the lowest, at 0.65 (95% CI 0.40 to 1.05), in subjects on ULT (5.0<sUA ≤ 6.0 mg/dL) compared with non-ULT subjects (sUA ≥8.0 mg/dL). A negative binomial regression indicated that the relative incidence rate was the lowest, at 0.54 (95% CI 0.33 to 0.91), in subjects on ULT (5.0<sUA ≤ 6.0 mg/dL) compared with non-ULT subjects (table 2).
Discussion
In this study, we hypothesised that gout flare would be less common in patients whose sUA was decreased by ULT than in patients whose sUA remained elevated, not only in subjects with gout, but also in those with asymptomatic hyperuricaemia. Because Japanese guidelines recommend the use of ULT in certain patients with asymptomatic hyperuricaemia, data were available to support our hypothesis.
Multivariable analysis consistently suggested that the risk of gout flare was lowest when sUA was reduced to 5.0 mg/dL<sUA ≤6.0 mg/dL, both for asymptomatic hyperuricaemia and for gout. However, when we analysed time to first gout flare, we found that subjects with gout whose sUA was reduced to ≤5.0 mg/dL were at higher risk for gout flare. Based on the finding that the Kaplan-Meier curve for the sUA ≤6.0 mg/dL group crossed the curves for the sUA >6.0 mg/dL group and the untreated group, we deduced that excessively rapid reduction of sUA may induce gout flare in the early phase of ULT introduction. This agrees with results from multiple previous studies, which showed that a sharp reduction in sUA during the initial phase of ULT was associated with gout flare.14 15 Interestingly, our study showed this relationship only for gout, not for asymptomatic hyperuricaemia, possibly because of differences between the two groups in the amount of urate deposited in body tissues.
Propensity score analyses were applied to subjects with asymptomatic hyperuricaemia who were prescribed ULT, to compare findings between the group that reached the target sUA for patients with gout (sUA ≤6.0 mg/dL) and the group that did not. IPW analysis and propensity score matching analysis yielded consistent results, with lower levels of gout flare in subjects whose sUA was reduced by ULT to the gout target level. These results were robust and did not contradict the findings from our previous retrospective observational study, which also used the JMDC database and showed that subjects experienced less gout flare when they practiced closer adherence to ULT and when their sUA was monitored regularly.16
In patients with gout, the treat-to-target approach is widely accepted.1 4 There is currently no consensus on whether sUA should be lowered to the gout target level in patients with asymptomatic hyperuricaemia since limited evidence is available to support this treatment option. However, in a recent randomised controlled study of asymptomatic hyperuricaemia in chronic kidney disease (CKD), researchers confirmed that the incidence proportion of gout flare was significantly lower (0.91% vs 5.86%) in patients treated with ULT than in those treated with a placebo.10 Our study supports those findings, showing that the incidence rate of gout flare was lowered by using ULT to maintain sUA at the gout target level in subjects with asymptomatic hyperuricaemia as well as in those with gout. However, in patients with asymptomatic hyperuricaemia the incidence of gout over a 3 year period was 4.8% in subjects in the ULT group who reached sUA≤6.0 mg/dL and 11.1% in the untreated group. In other words, the number needed to treat (NNT) for 3 years to prevent 1 incident of gout flare was 16 patients. Similarly, previous RCTs in patients with asymptomatic hyperuricaemia indicated the NNT for 3 years to prevent a single gout flare was 24 patients.4 10 17 In addition, results from two recent randomised clinical trials showed that, among those with asymptomatic hyperuricaemia and CKD, allopurinol provided no renoprotective benefits and potentially doubled the risk of death.18–20 Clearly, the introduction of ULT for asymptomatic hyperuricaemia should be considered only after carefully assessing the clinical risks and benefits and the health economics of such treatment.
This study was significantly strengthened by using a large-scale medical information database that allowed us to follow approximately 20 000 subjects with asymptomatic hyperuricaemia for at least 2 years. Our study was feasible because Japan is one of the few countries where asymptomatic hyperuricaemia is treated, and records of that treatment are available. It would be much more challenging to observe asymptomatic hyperuricaemia treatment results in most other countries.
There are several limitations to this study. First, no validation study was conducted on the definitions of disease and outcome, so the applicability of those definitions is limited. Second, the JMDC database contains information from health insurance associations that include only limited data from subjects aged 65 and older and no data from those aged 75 and older, so our findings cannot be generalised to the entire Japanese population. Third, the study was limited to annual medical check-up data, so sUA were measured only once a year in most cases, and subjects might not have taken their ULT or other drugs on the day of the check-up. Fourth, there was a possibility of selection bias because the study was limited to subjects for whom sUA were available from medical check-ups for at least two consecutive years and who could be followed up for an additional 2 years. Fifth, to answer the research question, it was necessary to set the time origin for evaluation of gout flare during period 2 as the day after the next measurement of sUA (the follow-up date). This resulted in different dates for gout flare onset and uric acid measurement, and meant that variable risk levels were represented within the patient group with gout. The nature of this study placed limitations on our ability to adjust for these confounding factors. Finally, although multivariable analysis and propensity score analyses were adjusted for confounding factors, the study may have been limited by unrecognised or unmeasured confounding factors.
Our study used real-world data to demonstrate that the occurrence of gout flare in asymptomatic hyperuricaemia and gout tended to be lower for patients who were prescribed ULT and achieved sUA ≤6.0 mg/dL than for those who received ULT treatment but whose sUA remained >6.0 mg/dL and for those who were untreated. Further exploration is warranted regarding the benefits and drawbacks of introducing ULT as a treatment for asymptomatic hyperuricaemia, both clinically and from the perspective of health economics.
Supplemental material
Data availability statement
No data are available.
Ethics statements
Ethics approval
Since these data were thoroughly anonymised, ethics approval was not required.
Acknowledgments
Review of the statistical analysis plan, clinical study report and manuscript was provided by Hirotaka Mano, Pharmaceutical Development Administration Department, Teijin Pharma Limited. Medical writing support was provided by EDIT, Inc. (Tokyo, Japan) and was funded by Teijin Pharma Limited.
References
Supplementary materials
Supplementary Data
This web only file has been produced by the BMJ Publishing Group from an electronic file supplied by the author(s) and has not been edited for content.
Footnotes
Handling editor Josef S Smolen
Presented at Portions of these data were presented in abstract form at the ACR Convergence 2020 (5–9 November 2020).
Contributors RK drafted the manuscript, and AN performed the statistical analysis. All authors participated in the design of study and the analysis and/or interpretation of data. All authors have read and approved this final version of the manuscript for submission.
Funding This study was supported by Teijin Pharma Limited.
Competing interests RK, AN and HH are employees of Teijin Pharma Limited, and HY reports grants and personal fees from Teijin Pharma Limited.
Provenance and peer review Not commissioned; externally peer reviewed.
Supplemental material This content has been supplied by the author(s). It has not been vetted by BMJ Publishing Group Limited (BMJ) and may not have been peer-reviewed. Any opinions or recommendations discussed are solely those of the author(s) and are not endorsed by BMJ. BMJ disclaims all liability and responsibility arising from any reliance placed on the content. Where the content includes any translated material, BMJ does not warrant the accuracy and reliability of the translations (including but not limited to local regulations, clinical guidelines, terminology, drug names and drug dosages), and is not responsible for any error and/or omissions arising from translation and adaptation or otherwise.