Article Text

Abstract
Objective CD4+ T cells have been suggested as the most disease-relevant cell type in rheumatoid arthritis (RA) in which RA-risk non-coding variants exhibit allele-specific effects on regulation of RA-driving genes. This study aimed to understand RA-specific signatures in CD4+ T cells using multi-omics data, interpreting inter-omics relationships in shaping the RA transcriptomic landscape.
Methods We profiled genome-wide variants, gene expression and DNA methylation in CD4+ T cells from 82 patients with RA and 40 healthy controls using high-throughput technologies. We investigated differentially expressed genes (DEGs) and differential methylated regions (DMRs) in RA and localised quantitative trait loci (QTLs) for expression and methylation. We then integrated these based on individual-level correlations to inspect DEG-regulating sources and investigated the potential regulatory roles of RA-risk variants by a partitioned-heritability enrichment analysis with RA genome-wide association summary statistics.
Results A large number of RA-specific DEGs were identified (n=2575), highlighting T cell differentiation and activation pathways. RA-specific DMRs, preferentially located in T cell regulatory regions, were correlated with the expression levels of 548 DEGs mostly in the same topologically associating domains. In addition, expressional variances in 771 and 83 DEGs were partially explained by expression QTLs for DEGs and methylation QTLs (meQTLs) for DEG-correlated DMRs, respectively. A large number of RA variants were moderately to strongly correlated with meQTLs. DEG-correlated DMRs, enriched with meQTLs, had strongly enriched heritability of RA.
Conclusion Our findings revealed that the methylomic changes, driven by RA heritability-explaining variants, shape the differential expression of a substantial fraction of DEGs in CD4+ T cells in patients with RA, reinforcing the importance of a multidimensional approach in disease-relevant tissues.
- arthritis
- rheumatoid
- polymorphism
- genetic
- autoimmune diseases
Data availability statement
Data are available in a public, open access repository. All data relevant to the study are included in the article or uploaded as supplementary information. The summary statistics of DEGs, DMRs, eQTLs and meQTLs in this study are available at https://doi.org/10.5061/dryad.w0vt4b8pw.
Statistics from Altmetric.com
Key messages
What is already known about this subject?
Rheumatoid arthritis (RA) has a highly polygenic genetic architecture, with nearly 120 reported RA susceptibility loci and a large number of unidentified RA loci.
The majority of disease variants are located in non-coding elements, most of which significantly overlap with CD4+ T cell regulatory elements. In addition, many genes in RA loci are involved in CD4+ T cell pathways.
What does this study add?
This study provides the landscapes of transcriptomic and methylomic features in RA CD4+ T cells, with catalogues of quantitative trait loci for expression and methylation.
The integrative approaches using individual-level genetic, epigenetic and transcriptomic data with recent Korean genome-wide RA association statistics dissected the regulatory sources for differentially expressed genes in RA CD4+ T cells, newly suggesting that the RA-risk variant-driven methylation changes result in the differential expression of a large number of the genes in RA CD4+ T cells.
How might this impact on clinical practice or future developments?
Our findings contribute to a better understanding of the CD4+ T cell alterations underlying RA association of non-coding variants and identify disease-relevant gene candidates that may be used for novel therapeutic targets.
Introduction
Rheumatoid arthritis (RA) is an inflammatory autoimmune disease causing chronic symmetrical polyarthritis of large and small joints and mostly occurs in women between 30 and 50 years of age.1 The causes of RA are not yet fully understood but a family-based genetic approach estimated an overall genetic heritability of RA to be up to 65%.2 Genome-wide association studies (GWASs) revealed a highly polygenic genetic aetiology of RA, identifying RA-associated common variants in ~120 susceptibility loci.3–5 Most (~90%) of the RA-risk association signals in RA loci come from non-coding variants. The biological functions of most non-coding RA-risk variants have been largely unknown,6 but bioinformatic analyses using non-coding RA-risk variants and cell type-specific features (eg, regulatory annotations and cellular pathways) were highly fruitful in narrowing down disease-relevant cell types in RA pathogenesis.
Several studies reported that the non-coding variants, which were associated with autoimmune disorders, were significantly enriched within enhancers and around expression quantitative trait loci (eQTLs) in immune cell types,7–10 implying a possible allele-specific regulatory effect of non-coding variants in disease-relevant cell types in the pathogenesis of autoimmune disorders. Several studies on the RA-risk non-coding variants highlighted the importance of CD4+ T cells in RA. The RA-risk variants are strongly enriched in cell type-specific annotations including enhancers, histone modification marks and transcription factor-binding sites (TFBSs) in CD4+ T cells in RA pathogenesis.5 7 9–12 Indeed, a large number of the genes within RA susceptibility loci are involved in the activation and differentiation pathways of CD4+ T cells.3 13–15
Despite the significant enrichment of non-coding disease variants in cell-type specific annotations, only a minor fraction (10% to 20%) of the GWAS signals in autoimmune diseases including RA were directly explained by known eQTLs or TFBSs.6 16 Therefore, a new approach is needed to understand how the disease variants exert regulatory effects on disease effector genes. Indirect regulatory effects of disease variants through epigenetic changes are likely to be undetectable in limited sample sizes of most eQTL analyses.
Here, we generated genomic, transcriptomic and epigenomic (DNA methylation) data from purified CD4+ T cells in identical patients with RA and healthy controls. This study provides comprehensive landscapes of RA-specific transcriptomic and epigenomic signatures in CD4+ T cells, identifies the variants associated with expression or methylation levels and integrates them with recent Korean GWAS data4 to understand how RA heritability-explaining variants shape RA-specific differential expression in CD4+ T cells on a genome-wide scale.
Methods
Subjects and CD4+ T cell isolation
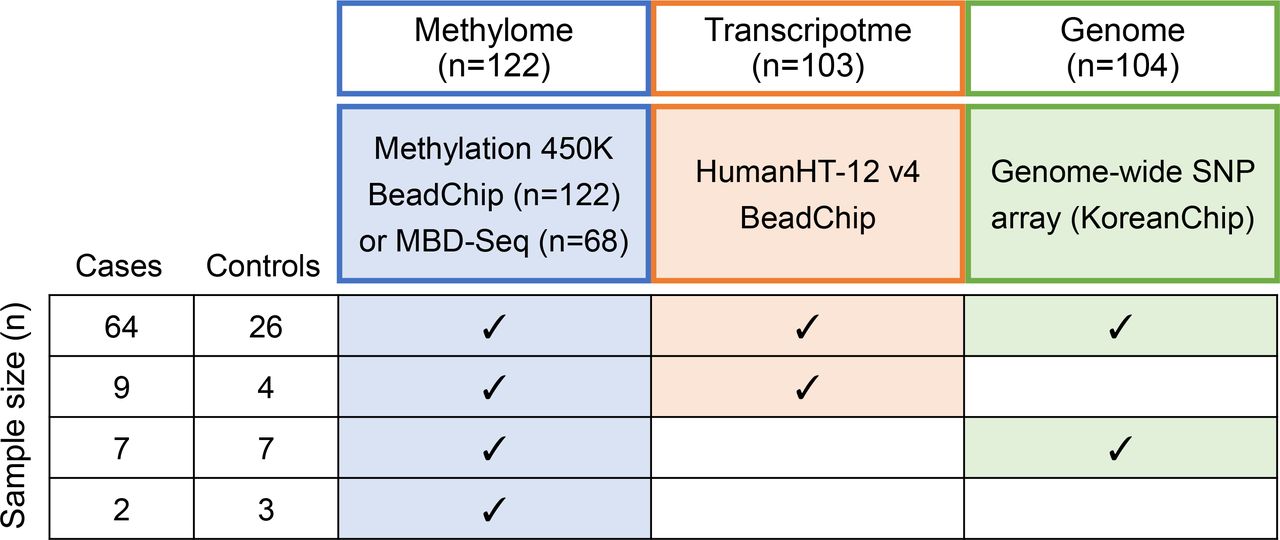
A total of 122 study subjects consisting of 82 patients with RA and 40 healthy controls were recruited at Hanyang University Hospital for Rheumatic Diseases (Seoul, South Korea). Sample sizes in each omics data set are summarised in figure 1. All the subjects provided written informed consent for participation. After collecting ~16 cc peripheral blood mononuclear cells using BD Vacutainer CPT, CD4+ T cells were purified within 3 hour (without freezing and thawing) using Invitrogen Dynabeads CD4+ Isolation Kit, and genomic DNA and messenger RNA were extracted. The CD4+ T cell purification method was internally verified to yield a high purity of CD4+ T cells by fluorescence-activated cell sorting and all samples showed >90% purity of CD4+ T cells in a methylation-based cell composition analysis (online supplemental figure S1). All patients with RA were diagnosed according to the American College of Rheumatology 1987 classification criteria for RA.17 The characteristics of the study subjects at the time of blood sampling are provided in online supplemental table S1.
Supplemental material

Summary of sample sizes and overlap in three omics data sets. The study subjects consisted of 82 patients with rheumatoid arthritis and 40 healthy controls. Methylome data were generated for all the subjects (n=122) using a methylation array; a subset of the same subjects was used to generate MBD-Seq methylome data. Transcriptome and genome data for subsets (n=103 and 104, respectively) were generated using array technologies. The sample sizes were additionally summarised according to the combination of available omics data sets. MBD-Seq, methyl-CpG-binding domain sequencing.
Gene expression analysis
The gene expression level in CD4+ T cells was measured using the Illumina HumanHT-12 v4 BeadChip. Normal exponential background correction and quantile normalisation were performed for each slide using limma.18 A total of 9414 expression probes were retained after a general quality control (QC) procedure (see the details in online supplemental table S2). A batch effect was removed by ComBat implemented in sva19 using batch variables (slide and array position; online supplemental figure S2). A multivariate linear model was applied using limma to identify differentially expressed genes (DEGs) in RA at a false discovery rate (FDR) threshold of 0.05, controlling for potential confounders (sex, age and T cell purity) and computing moderated statistics by empirical Bayes shrinkage.18
Gene set enrichment analysis
For each gene tested in the DEG analysis, π -value20 was calculated based on the log2-fold expression change ( K ) in patients with RA and its significance level ( p ), as follows:
If a gene was analysed by multiple probes, the probe with the lowest p value for the differential expression was used in π calculation. A π -based gene set enrichment analysis (GSEA) for immune-related biological process terms under GO:0002376 was performed using clusterProfiler.21
DNA methylation analysis
DNA methylation data were generated from genomic DNAs in CD4+ T cells using both methyl-CpG-binding domain sequencing (MBD-Seq) for profiling of DNA methylation on a whole-genome scale and the Illumina Infinium Human Methylation 450K BeadChip mostly for profiling of CpG sites around genic regions. In the MBD-Seq data analysis, reads were mapped to the human reference genome hg38 using bowtie222 and filtered out with <10 MAPQ values. Methylation peaks were called by MACS223 with default parameters and quantified by DiffBind24 in 304 301 regions found in >1/3 in each group. Differentially methylated peaks (DMPeaks) were examined by DESeq225 with the same confounding factors used in the DEG analysis.
In methylation array data analysis, 413 718 CpG-targeting probes passed general QC filters (see the details in online supplemental table S3) and were analysed to identify differentially methylated probes (DMProbes) in RA using ChAMP.26 Specifically, the fluorescence intensities of array probes were normalised by beta-mixture quantile normalisation27 and transformed into M value28 to avoid heteroscedasticity. We eliminated the batch effect using batch variables (data production time, slide and array position) by ComBat implemented in sva19 (online supplemental figure S3). DMProbes between patients with RA and controls were investigated under a multivariate linear model considering the same covariates used in the DEG analysis.
Differential methylation regions (DMRs; DMPeaks or DMProbes) with FDR-corrected p values (P FDR) <0.05 were considered as significant.
Profiling the genome-wide landscape of RA-specific DMPeaks
Genome-wide DNA methylation data from MBD-Seq were used to profile the overlap between genomic annotations and DMPeaks in RA. Genomic annotations for CD4+ T cell-specific ChromHMM chromatin states,29 gene-based positional annotations and TFBSs were retrieved from the Roadmap Epigenomics Project data30 and ChIPseeker31 and PAINTOR (https://github.com/gkichaev/PAINTOR_V3.0/wiki/2b.-Overlapping-annotations), respectively. The distribution of DMPeaks around transcription start sites (TSSs) was drawn using ChIPseeker.31 A Fisher’s exact test was performed to assess an enrichment of DMPeaks on a query annotation using LOLA32 with all methylation peaks as background.
Correlation analysis between expression level of DEGs and methylation level of DMR
The RA-specific DEGs and DMRs in the same topologically associating domain (TAD) of CD4+ T cells33 (available at https://osf.io/u8tzp) were tested for their individual-level correlation. In the region not characterised by any TADs, DMRs in a 2 kb region around the TSS of a DEG were used in the pairwise correlation analysis. Significant individual-level correlations between DMR and DEGs were identified in a linear regression controlling for the same covariates used in the DEG analysis, at a gene-level FDR of 5%.
Analysis of genetic associations with the level of expression and methylation
Linear regression was performed to identify cis-QTLs adjusting for sex, age, T cell composition, disease status and the top five genotypic principal components using FastQTL34 at peak-wise or probe-wise FDR of 5%. Cis-variants within 1 Mb of TSSs or methylated regions were used in the analyses. We employed QTLtools35 to identify trans-QTLs ≥5 Mb away from each target site using the same model in cis-QTL analyses (p value threshold=1×10⁻¹⁰). We retained a subset of independent QTLs by linkage disequilibrium (LD) clumping (r 2 >0.2) in each gene or methylated region.
The methylation-mediated effects of methylation QTLs (meQTLs) on regulation of DEGs were assessed by a mediation analysis with quasi-Bayesian CIs36 at a gene-wide FDR of 5%.
Estimating heritability of RA partitioned by RA-specific DEGs or DMRs
The enrichment of heritability (h 2) of all variants in the identified annotations was estimated using stratified LD score regression7 based on the 1KGP East Asian LD scores (https://data.broadinstitute.org/alkesgroup/LDSCORE/) and the RA association summary statistics of our recent Korean GWAS.4 According to the observed distribution of eQTLs and meQTLs in this study, the regulatory genomic region enriched with eQTLs for DEGs or non-DEGs was defined as a 5 kb region around the TSS of each gene. Similarly, the genomic region enriched with meQTLs for DEG-expression-correlated DMRs, expression-uncorrelated DMRs or non-DMRs was defined as a methylation region of interest with a 5 kb buffer region.
Detailed methods of MBD-Seq data analysis, genotyping and whole-genome imputation, validation of eQTLs with public eQTLs, enrichment of QTLs on TFBSs and colocalisation test for RA association and QTL signals are described in online supplemental note.
Results
Brief overview of the main analyses
This study consisted of four main analyses to understand RA-specific features in CD4+ T cells at the level of genomics, methylomics and transcriptomics in a single cohort and to scope out the inter-omics relationship in regulating RA-specific DEGs in CD4+ T cells. (1) An expression microarray analysis followed by a GSEA was carried out to identify DEGs and DEG-enriched pathways in CD4+ T cells in patients with RA. (2) DNA methylation analyses using both MBD-Seq and methylation arrays were conducted to determine genome-wide methylation profiles in CD4+ T cells and RA-specific DMRs. (3) QTL analyses were performed by integrating genome-wide variant data with expression and methylation data in CD4+ T cells. (4) An inter-omics analysis was performed to better understand plausible DEG-regulating mechanisms in RA CD4 +T cells and the potential contribution of RA heritability-explaining variants.
RA-specific DEGs in CD4+ T cells highlighting the differentiation and activation of CD4+ T cells
Expression analyses identified 2575 DEGs in RA CD4+ T cells, based on the differential fluorescence signal of 2785 expression probes. Among the identified DEGs, 1585 and 1200 DEGs were upregulated and downregulated in RA, respectively (figure 2A). In a GSEA, RA-specific DEGs were significantly enriched in 10 immune processes, most of which were T cell-related pathways including lymphocyte activation and CD4+ T cell differentiation (figure 2B–D and online supplemental table S5). The most significant DEGs included some known genes relevant to T-cell biology (eg, CD83,37 38 SMAD7 39 and IRF1 40; figure 2C, E and F). For example, the anti-inflammatory gene CD83 37 in an RA susceptibility locus showed an approximate twofold decrease in expression level in patients with RA compared with controls (log2 fold change=−0.89; P FDR=1.1x10⁻⁹; figure 2E) and belonged to most of the identified pathways including T-cell differentiation, contributing to the pathway enrichment with the largest size of π -value20 ( π =−11.0).

DEGs in RA CD4+ T cells and DEG-enriched gene sets. (A) The statistical significance level for differential expression (y-axis; a negative log10 scale) was plotted according to the log2-transformed fold change in expression in patients with RA compared with controls (x-axis). Significant data points above a significance threshold (depicted as a dashed line; FDR of 5%) are marked in red. (B) Dot plot represents the GO terms significantly enriching DEGs in a GSEA. The significance of enrichment is shown on the x-axis. The gene ratio indicates the ratio of the number of input genes to the total number of genes in the gene set (=set size). (C) Heat map shows the π values of the genes strongly contributing to the enrichment in T cell pathways. (D) Enrichment plot was created for the GO term, T cell differentiation with normalised enrichment score (NES)=−1.68 and enrichment p value=1.28×10⁻⁴. The x-axis represents query genes ordered by their π values (shown in the lower part of the plot). The upper part of the plot shows the running enrichment score (ES) that means the sum of ESs from the top ranked gene to a corresponding gene. Bars in the middle part indicate the location of gene members of the query GO term. (E and F) Box plots represent normalised expression levels of (E) CD83 and (F) SMAD7 on a log2 scale. The expressions of both genes were decreased in patients with RA compared with controls (fold change=−0.89 and P FDR=1.1×10⁻⁹ for CD83; fold change=−0.83 and P FDR=6.0×10⁻⁶ for SMAD7). DEGs, differentially expressed genes; FDR, false discovery rate; GSEA, gene set enrichment analysis; P FDR, FDR-corrected p values; RA, rheumatoid arthritis.
RA-specific DMRs preferentially within regulatory regions
We used MBD-Seq and methylation microarrays to capture the genome-wide methylation architecture in CD4+ T cells in RA, with a high resolution on genic CpG sites. We observed a high correlation between 300bp-bin MBD-Seq read counts and methylation probe intensities (Pearson’s r=0.75 for cases, 0.71 for controls, (online supplemental figure S4). A total of 94 898 DMPeaks (30.4%; out of 304 301 peaks) and 28 786 DMProbes (7.0%; out of 413 718 probes) in RA were identified in MBD-Seq and microarray data, respectively (figure 3A,B). There was a significant overlap between DMPeaks and DMProbes (p=9.9×10−94 in a Fisher’s exact test for the region tested in both analyses), showing the concordant direction of methylation changes in >90% of co-localising DMPeak-DMProbe pairs.
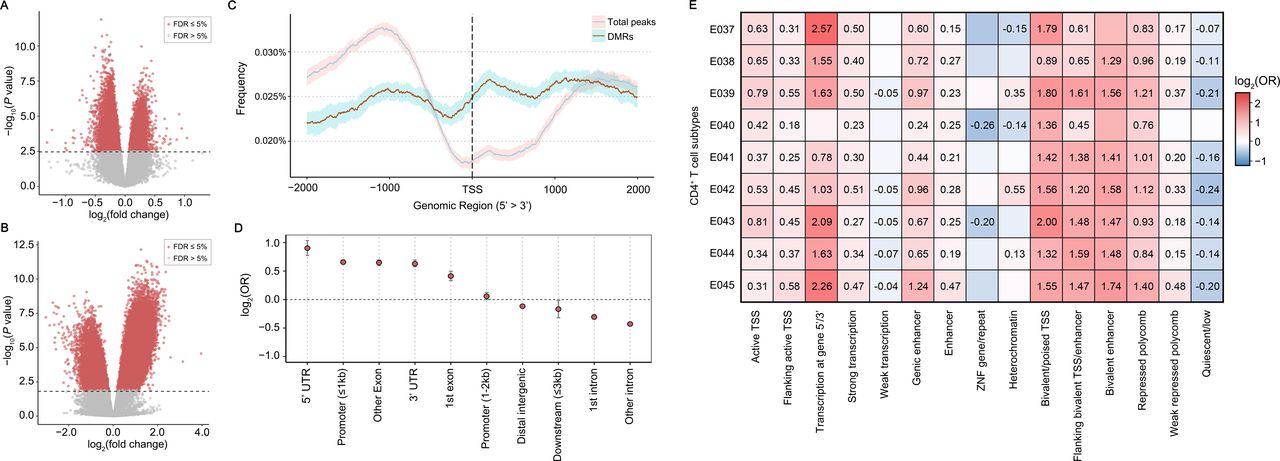
DMRs and DMR-enriched genomic annotations in RA CD4+ T cells. (A and B) Volcano plots were generated from the DMR analysis results using (A) methylation array and (B) MBD-Seq data. The negative log10-transformed statistical significance level for differential methylation (y-axis) was plotted according to log2-transformed fold change in methylation in patients with RA compared with controls (x-axis). Significant data points (DMProbes and DMPeaks) above a significance threshold (depicted as a dashed line; FDR of 5%) are marked in red. (C) Distribution of DMPeaks and total MBD-Seq peaks is shown based on the distance from TSSs. The 95% CIs estimated by bootstrapping are shown as shaded areas. (D) ORs for DMRs that are located in each genomic feature are shown with error bars indicating 95% CIs. (E) LOLA analysis results are summarised in the heat map highlighting T cell-specific ChromHMM chromatin states enriched with DMRs. Significant OR values (FDR ≤5%) are shown in the heat map. The Roadmap Epigenomics Project data was used in the analysis (E037, CD4+ memory T cells; E038, CD4+ naïve T cells; E039, CD4+CD25-CD45RA+ T cells; E040, CD4+CD25-CD45RO+ T cells; E041, stimulated CD4+CD25-IL17- T cells; E042, stimulated CD4+CD25-IL17+ T cells; E043, CD4+CD25- cells; E044, CD4+CD25-IL127- Treg cells; E045, CD4+CD25-IL127+ T cells). DMPeaks, differentially methylated peaks; DMProbes, differentially methylated probes; DMRs, differential methylated regions; FDR, false discovery rate; MBD-Seq, methyl-CpG-binding domain sequencing; RA, rheumatoid arthritis; TSSs, transcription start sites.
The unbiased genome-wide methylation landscape through MBD-Seq revealed how the DNA methylation sites are distributed based on genomic annotation and emphasised the strong enrichment of RA-specific DMRs in the likely regulatory region around TSSs (figure 3C), including the 5’ UTR (OR=1.87, p=1.34×10−39) and proximal promoters (OR=1.58, p=2.29×10−245; figure 3D and online supplemental table S6). Consistently, DMRs were significantly enriched in CD4+ T cell-specific ChromHMM chromatin states30 associated with transcription-activating, repressing or bivalent regions (figure 3E).
Identification of QTLs
We identified 2125 cis-eQTLs for 682 expression probes, 120 424 meQTLs for 43 526 methylation probes and 23 690 cis-meQTLs for 11 998 methylation peaks within 1 Mb of corresponding TSSs or methylated regions. The detected cis-eQTLs and cis-meQTLs were very closely located to corresponding TSSs and methylated regions, respectively (online supplemental figure S5). Although the sample size and data type41 might be insufficient to ensure statistical power to detect QTLs, we observed that the identified CD4+ T cell cis-eQTLs were highly consistent with publicly available cis-eQTLs from the CD4+ T cell RNA-Seq data (online supplemental figure S6). Similarly, by comparing with the publicly available lead meQTLs in whole blood,42 we found consistent effect sizes in our study (online supplemental figure S7).
We further identified trans-eQTLs for 17 expression probes, 233 trans-meQTLs for 234 methylation probes and 21 trans-meQTLs for 21 methylation peaks outside 5 Mb of the TSSs or methylated sites.
RA variants in many susceptibility loci are correlated moderately to strongly with eQTLs or meQTLs (online supplemental table S7-9). For example, the cis-eQTL signals (rs8046707) of FBRS downregulated in RA were statistically showed r2 =0.42 with a lead RA variant rs12918327 in the same locus (posterior probability of a shared causal signal >50% in a colocalisation analysis).
In addition, we observed that QTLs were significantly enriched on binding sites of 109 transcription factors. Most of the identified transcription factors also significantly bound within DMRs at FDR of 5% (online supplemental table S10 and figure S8). Some top-ranked transcription factors that preferentially bind to QTLs and DMRs are known to be relevant to RA or T cell functions (eg, MAZ, a Myc-associated protein.43)
Methylation-mediation effects of meQTLs on RA-specific DEGs
We integrated the individual-level data of DEGs, DMRs and genome-wide genetic variants to understand the regulatory factors underlying the differential expression of DEGs in RA CD4+ T cells.
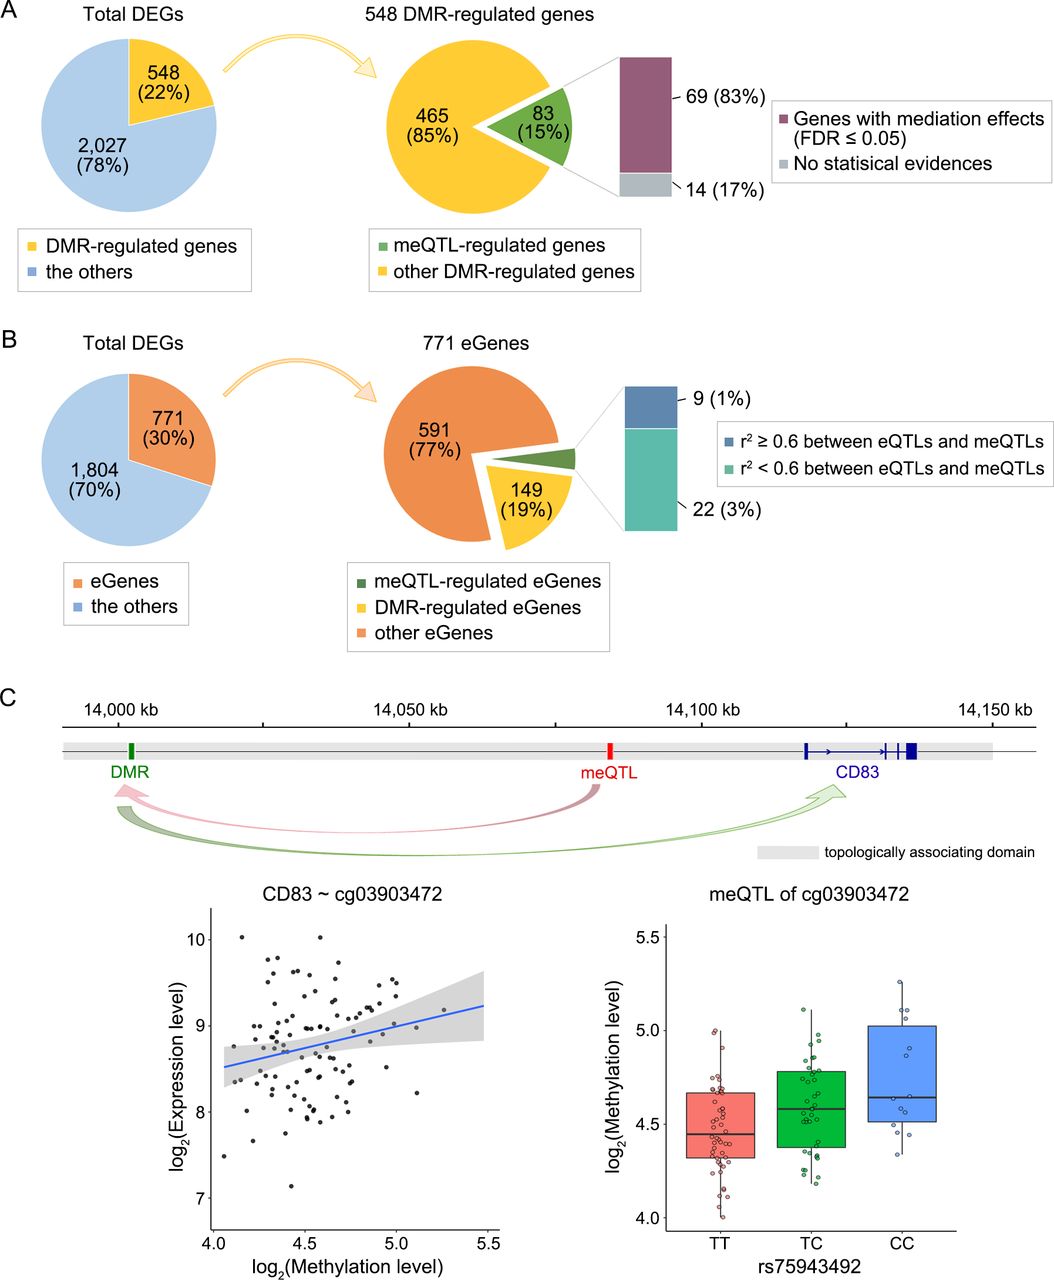
A total of 548 RA-specific DEGs (22%) were significantly correlated with RA-specific DMRs in the same TADs or 2 kb windows around their TSSs, at a gene-level FDR of 5%, and eQTLs in this study and other CD4+ T cell eQTL studies44 45 were detected in 771 DEGs (figure 4A,B). Half of the DMR-methylation-correlated DEGs showed significantly negative correlations with the DNA methylation levels in DMRs, suggesting bivalency of DNA methylation in transcriptional regulation. Indeed, we found that DMRs were significantly localised in bivalent chromatin states bound to both activating and repressing epigenetic regulators (figure 3E). Among DMR-methylation-correlated DEGs, 83 DEGs were regulated by meQTLs. We statistically confirmed the presence of methylation-mediation effects of meQTLs on 69 DEGs (83.1%; out of the 83 DEGs).

Summary of regulatory features associated with differential expression in RA CD4+ T cells. (A and B) The numbers of DEGs are shown according to potentially regulatory features; DMRs, cis-meQTLs or cis-eQTLs. (A) DMR-regulated genes refer to genes whose expression level was significantly correlated with the methylation level of nearby DMRs in the same topologically associating domain (TAD) or the promoter region. If cis-meQTLs were detected in the corresponding DMRs, the genes are referred as meQTL-regulated genes. The mediation effects of cis-meQTLs on DEGs were estimated using a mediation analysis with quasi-Bayesian CIs. (B) Genes that were regulated by cis-eQTLs in this study or other studies were defined as eGenes. The eGenes were stratified into meQTL-regulated and DMR-regulated eGenes according to methylation features associated with eGenes. (C) The expression level of CD83 was regulated by the meQTL rs75943492, mediated by the differential methylation on the DMProbe cg03903472 (mediation effect=−0.12, PFDR =0.01) in a TAD. The associations were significant between expression and methylation levels (beta=0.55, PFDR =0.03) and between rs75943492 and methylation level (beta=0.16, PFDR =0.02). DEGs, differentially expressed genes; DMProbe, differentially methylated probe; DMRs, differential methylated regions; eQTLs, expression quantitative trait loci; FDR, false discovery rate; meQTLs, methylation QTLs; P FDR, FDR-corrected pvalues; RA, rheumatoid arthritis.
Several known immune genes, involved in diverse immune pathways, were detected as potentially meQTL-regulated DEGs mediated by DNA methylation changes. For example, CD83 was regulated by rs75943492, mediated by a DMProbe at 100 kb upstream of the TSS (mediation effect=0.12, PFDR <5%; figure 4C).
Variants in differential expression-associated DMRs that explained significantly more heritability of RA
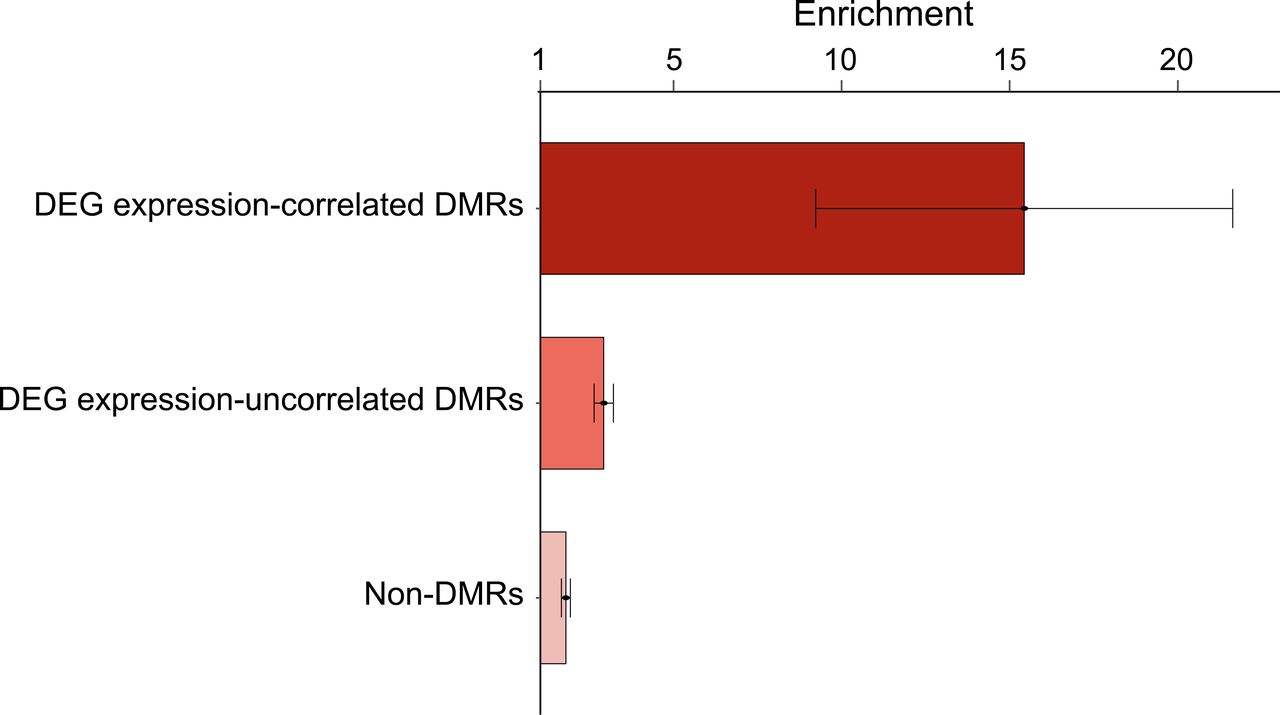
We observed DEGs in 79 loci out of 118 non-HLA RA-risk loci.4 5 46 In addition, 43 loci with DEGs had DMRs correlated with expression levels of DEGs in CD4+ T cells. Considering the highly enriched meQTLs and eQTLs around methylation sites and TSSs, respectively (online supplemental figure S5), we estimated RA heritability explained by all variants in the 5 kb regions around methylation sites or TSSs to examine the potential contribution of DMR-mediated DEG-regulating meQTLs and DEG-regulating eQTLs to RA susceptibility on a genome-wide scale. Strikingly, a relatively large fraction of RA heritability was explained by variants within RA-specific DMRs whose methylation levels correlated with the expression level of DEGs in RA CD4+ T cells (15.4-fold more heritability than control variants, 8.6-fold more than variants in non-DMRs and 5.3-fold larger than variants in expression-uncorrelated DMRs; figure 5 and online supplemental table S11). The TSS regions with significantly more eQTLs explained a relatively large fraction of RA heritability but the enrichment estimate in DEGs (=33.4) was only 1.6-fold more than that in non-DEGs (=20.5). Although most of the disease association signals are reported to be little correlated with QTL drivers,33 the genome-wide heritability partitioning analysis strongly suggests a potential regulatory effect of RA variants in DMRs that results in the differential expression of some disease-relevant genes in RA CD4+ T cells and eventually leads to T cell alteration in patients with RA.
Large enrichment of partitioned-heritability of RA in DEG expression-correlated DMRs. Enrichment of heritability of RA in three different types of DNA methylated regions was estimated using stratified LDSC. Strong enrichment was detected in DEG expression-correlated DMRs compared with methylated regions irrelevant to DEGs. The SEs of enrichment are shown as error bars. DEGs, differentially expressed genes; DMRs, differential methylated regions; RA, rheumatoid arthritis.
Discussion
This is the first multi-omics analysis for CD4+ T cells in patients with RA to profile the plausible causal factors underlying RA-specific DEGs using genomic, transcriptomic and epigenetic data in a single cohort. This study identified the differential expression of several key immune regulator genes involved in the proliferation and differentiation of CD4+ T cells. A large number of DMRs were identified in genome-wide and targeted methylation quantification approaches, suggesting that DMRs were preferentially located in highly regulatory elements in CD4+ T cells or TFBSs. A large number of DEGs could be partially explained by meQTL-mediated DMRs or eQTLs and were located in RA susceptibility loci. Nevertheless, it is not common that RA-risk variants are genetically linked in known eQTLs,33 suggesting a low statistical power in most eQTL analyses and the complex gene regulations involving multiple variants and indirect (epigenetic) regulation. We demonstrated the high enrichment of RA heritability in the region enriched with DMR-mediated DEG-regulating meQTLs.
Our results suggest that several key immune regulators (such as CD83, SMAD7 and GATA3) in CD4+ T cells are involved in the T-cell alteration in RA. For example, we observed decreased expression of CD83 in patients with RA possibly by a meQTL-mediated DMR. Deficiency of CD83 in mice downregulates the differentiation of Treg cells38 and leads to the proliferation of CD4+Foxp3− T cells and the differentiation to Th1 and Th17 cells, enhancing the immune response.37 As another example, SMAD7, encoding an inhibitor of TGF-β signalling in Treg differentiation,39 was downregulated in RA CD4+ T cells. Consistently, a recent study revealed the decreased expression of SMAD7 in synovial tissues of patients with RA as well as severe joint inflammation in a SMAD7-knockout mouse model displaying imbalanced Th17/Treg responses.47 As a third example, GATA3, which is downregulated in RA CD4+ T cells, is a master regulator of T cell function48 and a promising target of non-steroidal drugs for the treatment of autoimmune diseases.49–51
In conclusion, our findings shed light on how genetic variants can shape the disease-specific transcriptomic signatures in CD4+ T cells in patients with RA, illustrating the advantage of the same-sample inter-omics data analysis on disease-relevant tissues in dissecting the complex transcriptional regulation driven by genome-wide genetic variants.
Data availability statement
Data are available in a public, open access repository. All data relevant to the study are included in the article or uploaded as supplementary information. The summary statistics of DEGs, DMRs, eQTLs and meQTLs in this study are available at https://doi.org/10.5061/dryad.w0vt4b8pw.
Ethics statements
Ethics approval
This study was approved by the Institutional Review Board at Hanyang University (HYG-11-008-1).
References
Supplementary materials
Supplementary Data
This web only file has been produced by the BMJ Publishing Group from an electronic file supplied by the author(s) and has not been edited for content.
Footnotes
Handling editor Josef S Smolen
EH and S-YB contributed equally.
Contributors KK, SCB and BJK designed the study. SYB, HSL and SCB recruited and characterised patients with rheumatoid arthritis and controls. SYB, JHY, JMK, JBB, HSL, BJK, KK and SCB generated genetic, epigenetic and transcriptomic data. EH, JL, KK and SCB analysed the data and interpreted the results. EH, KK and SCB wrote the manuscript. All authors reviewed and approved the manuscript.
Funding This study is supported by Basic Science Research Program through the National Research Foundation of Korea funded by the Ministry of Science, ICT & Future Planning (2017R1E1A1A01076388), Hanyang University Institute for Rheumatology Research and the National Institute of Health (2012-N73006-01, 2017-NI73002-02). Expression and DNA methylation data were generated as a part of Korean Epigenome Project (4848–308) with the support of the Korea Disease Control and Prevention Agency. KoreanChip was designed by Korean Genome Analysis Project (4845–301) that was supported by the Korea Disease Control and Prevention Agency.
Competing interests None declared.
Provenance and peer review Not commissioned; externally peer reviewed.
Supplemental material This content has been supplied by the author(s). It has not been vetted by BMJ Publishing Group Limited (BMJ) and may not have been peer-reviewed. Any opinions or recommendations discussed are solely those of the author(s) and are not endorsed by BMJ. BMJ disclaims all liability and responsibility arising from any reliance placed on the content. Where the content includes any translated material, BMJ does not warrant the accuracy and reliability of the translations (including but not limited to local regulations, clinical guidelines, terminology, drug names and drug dosages), and is not responsible for any error and/or omissions arising from translation and adaptation or otherwise.