Article Text

Abstract
Objective To optimise a strategy for identifying gene expression signatures differentiating systemic lupus erythematosus (SLE) and antineutrophil cytoplasmic antibody-associated vasculitis that provide insight into disease pathogenesis and identify biomarkers.
Methods 44 vasculitis patients, 13 SLE patients and 25 age and sex-matched controls were enrolled. CD4 and CD8 T cells, B cells, monocytes and neutrophils were isolated from each patient and, together with unseparated peripheral blood mononuclear cells (PBMC), were hybridised to spotted oligonucleotide microarrays.
Results Using expression data obtained from purified cells a substantial number of differentially expressed genes were identified that were not detectable in the analysis of PBMC. Analysis of purified T cells identified a SLE-associated, CD4 T-cell signature consistent with type 1 interferon signalling driving the generation and survival of tissue homing T cells and thereby contributing to disease pathogenesis. Moreover, hierarchical clustering using expression data from purified monocytes provided significantly improved discrimination between the patient groups than that obtained using PBMC data, presumably because the differentially expressed genes reflect genuine differences in processes underlying disease pathogenesis.
Conclusion Analysis of leucocyte subsets enabled the identification of gene signatures of both pathogenic relevance and with better disease discrimination than those identified in PBMC. This approach thus provides substantial advantages in the search for diagnostic and prognostic biomarkers in autoimmune disease.
This paper is freely available online under the BMJ Journals unlocked scheme, see http://ard.bmj.com/info/unlocked.dtl
Statistics from Altmetric.com
The identification of gene expression signatures differentiating patients with systemic lupus erythematosus (SLE) and antineutrophil cytoplasmic antibody-associated small-vessel vasculitis (AAV) may well provide clinically relevant biomarkers as well as insights into disease pathogenesis.
Over the past decade the use of microarray-based expression profiling as a tool for the identification of both diagnostic and prognostic biomarkers has grown immensely. This has been most apparent in oncology, in which array-based gene signatures have been used to reveal novel clinically relevant patient subgroups,1 2 predict treatment response,3 identify patients at risk of metastasis,4 and provide insight into the underlying molecular pathology.5 Array-based diagnostic tests are starting to enter clinical oncology practice as a direct consequence of this work.6
In autoimmune disease, unlike oncology, the choice of material to profile is not straightforward. Most studies published so far have used heterogeneous populations of blood cells, either total leucocytes or Ficoll-purified peripheral blood mononuclear cells (PBMC). As a consequence, many of the signatures that have been reported may be attributable to differences in the relative abundance of individual leucocyte populations, which has been suggested7 but not yet directly addressed.
One strategy to circumvent this issue and identify cell-intrinsic expression signatures would be to profile purified populations of cells. Whereas a few studies have profiled single populations of cells,8,–,10 no studies have looked across all major leucocyte types simultaneously, or directly compared arrays of separated cells with those of PBMC. As a consequence, many subtle, cell-type-specific changes may be missed,11 and signatures that are found may be attributable to differences in the relative abundance of individual leucocyte populations. We have therefore developed a cell separation protocol that allows the isolation of CD4 and CD8 T cells, CD19 B cells, CD14 monocytes and CD16 neutrophils from individual patients.12 Although this protocol utilises two sequential rounds of positive selection using magnetic beads, it produces cell samples in which gene expression levels are essentially identical to those of untouched cells.12
Whereas several studies have applied expression profiling to the study of SLE,13,–,17 only one study has examined AAV.18 That study profiled unseparated leucocytes and showed some discrimination between patients with AAV and SLE, but it did not address the issue of whether the gene signatures observed could be explained by differences in the relative size of leucocyte subsets between their patient cohorts.
In this study we confirm that controls and patients with AAV and SLE cannot be accurately discriminated at a transcriptional level using unseparated PBMC, but demonstrate for the first time that arrays of purified leucocyte subsets achieve superior differentiation of disease and control populations and allow identification of novel disease-related expression signatures. The analysis of purified leucocyte subsets demonstrated that the large majority of disease specific expression differences found were not seen in the PBMC analysis. These cell intrinsic differences are likely to provide more insight into disease pathology and offer a greater chance of detecting clinically useful biomarkers.
Patients and methods
Full details of patient cohorts and experimental procedures are provided online (see supplementary file).
Patient and control cohorts
Thirteen patients with active SLE and 44 patients with active AAV attending the lupus and vasculitis clinic at Addenbrooke's Hospital, together with 25 age and sex-matched controls, were enrolled into the study (see supplementary tables 1 and 2, available online only).
Cell separation, RNA extraction and microarray hybridisation
PBMC, CD4 and CD8 T-cell, CD19 B-cell, CD14 monocyte and CD16 neutrophil samples were isolated as previously described.12 Following extraction, RNA was labelled and hybridised to microarrays as previously described.19
Microarray data analysis
Raw image data were imported into R for normalisation and assessment of differential expression using the Limma package in bioconductor.20
Results
Differences observed in the transcriptomes of unseparated leucocytes from normal controls and patients with SLE or AAV largely reflect changes in their cellular composition.
To determine the extent of similarity between SLE and AAV at a transcriptional level we profiled unseparated PBMC RNA from 28 patients with AAV, 12 with SLE and 21 normal controls (arrays from four AAV, three SLE and four control samples failed quality control and were not included in subsequent analyses). Data for 15 255 of the probes on the array were present in all 61 samples and were subjected to analysis of variance (ANOVA) with correction for multiple testing21 to identify differentially expressed genes among the three groups. This yielded 3549 statistically significant probes when the false discovery rate was set at 5% (supplementary table 3, available online only). Unsupervised hierarchical clustering using these data broadly separated the samples into three groups; however, they bore little resemblance to the original diagnostic classes (figure 1A). Group 1 contained 17 of 21 control samples; however, 45% of group 1 samples were from patients with AAV. Groups 2 and 3 were composed predominantly of patient samples (26 of 30), with SLE and AAV being equally distributed between them.
- Download figure
- Open in new tab
- Download powerpoint
Differences in cellular composition largely drive gene expression signatures seen in comparisons of peripheral blood mononuclear cell (PBMC) samples. (A) Hierarchical clustering of PBMC samples from antineutrophil cytoplasmic antibody-associated small-vessel vasculitis (AAV) and systemic lupus erythematosus (SLE) patients and controls broadly separates the samples into three groups. The numbers below the heat map show the distribution of AAV, SLE and control samples between the three groups. Vertical bars identify the following gene signatures; interferon, plasmablast and granulopoiesis (blue), CD8 T cell (purple), lymphoid (orange) and myeloid (yellow). (B-E) Gene set enrichment analysis was performed to look for enrichment of the interferon and granulopoiesis signatures described by Bennett et al.13 (B) Interferon-inducible genes are signifi cantly enriched in SLE patients. (C and D) Granulopoiesis-associated genes are signifi cantly enriched in both (C) SLE and (D) AAV patients and (E) interferon-inducible genes are not enriched in AAV patients. (F) Serum IgG but not IgM levels correlate with the presence of the plasmablast signature. PB sig +ve and −ve indicates patients with or without the plasmablast signature, respectively. (G) The plasmablast signature is associated with increased disease activity at enrolment. Horizontal bars denote the mean, statistical signifi cance was determined using a t test. (H) AAV and SLE patients have reduced CD4 T-cell and increased CD14 monocyte levels and in addition, AAV patients have signifi cantly reduced CD8 T-cell levels compared with controls. Horizontal bars denote the mean, statistical signifi cance was determined using analysis of variance followed by post hoc testing, *p<0.05, **p<0.01, ***p<0.001. (I) CD8A messenger RNA levels correlate with the relative abundance of CD8 T cells in the PBMC samples arrayed.
Post hoc analysis of the differentially expressed probes identified the genes that best differentiated SLE patients from controls (n=89, supplementary table 4, available online only), AAV patients from controls (n=61, supplementary table 5, available online only), and SLE and AAV patients (n=41, supplementary table 6, available online only). The transcripts differentiating SLE from control encode type 1 interferon-inducible proteins, immunoglobulin, or proteins expressed in immature granulocytes (figure 1B,C), consistent with previous reports.13 14 The 61 transcripts differentiating AAV from control mainly encoded proteins expressed in immature granulocytes (figure 1D, see also Alcorta et al).18 The type 1 interferon signature was completely absent in the AAV patients (figure 1E). Consistent with this, analysis of the 41 probes discriminating SLE and AAV patients revealed that they were primarily transcripts upregulated in SLE, which encode immunoglobulin or type 1 interferon-inducible proteins. The granulopoiesis signature is thus common to both diseases, the type 1 interferon and plasmablast signatures are restricted to SLE.
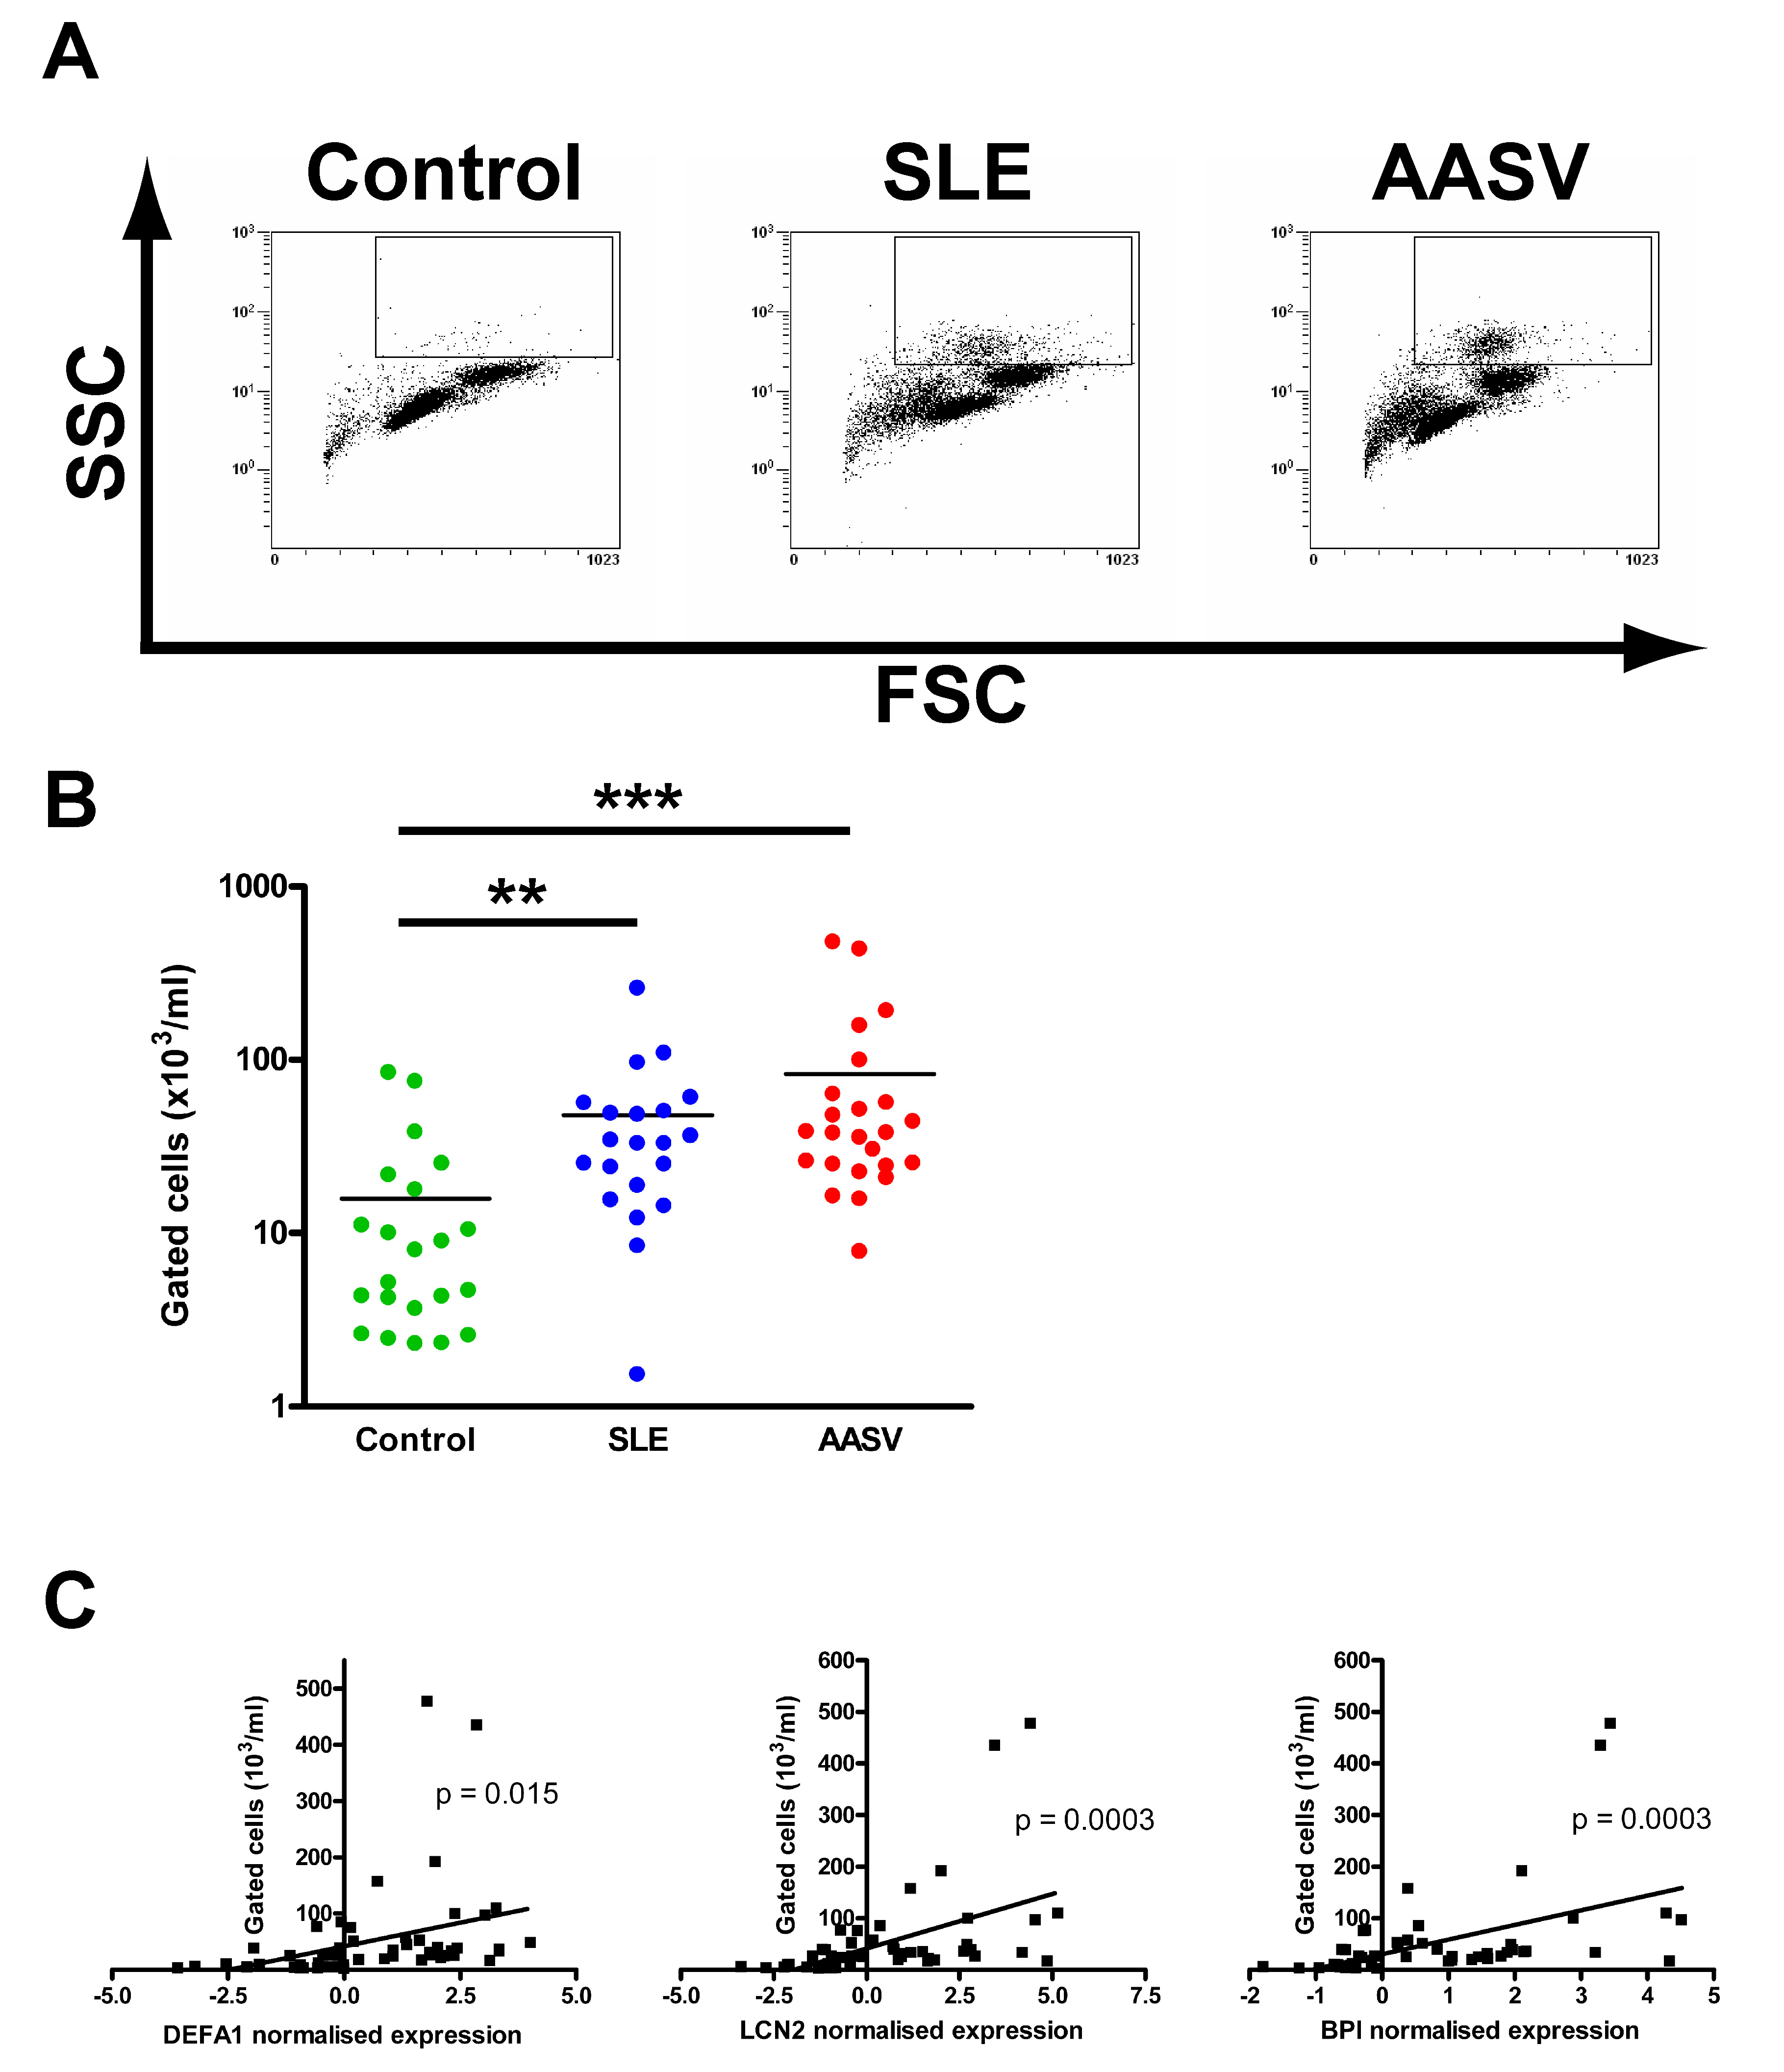
The granulopoiesis signature has previously been associated with contamination of the PBMC fraction by immature granulocytes.13 This was confirmed by flow cytometry (supplementary figure 1A,B, available online only), and there was a strong correlation between the expression of genes from the granulopoiesis signature and immature granulocyte numbers (supplementary figure 1C, available online only).
Interestingly, while the interferon and granulopoiesis signatures are found in almost all SLE patients, the plasmablast signature is absent in approximately one third. Patients with the plasmablast signature had significantly elevated serum IgG (figure 1F), and a trend towards higher antinuclear antibody and double-stranded DNA autoantibody levels (supplementary figure 2A, available online only). They had significantly more active disease at enrolment (figure 1G), but no difference in flare-free survival following induction therapy (supplementary figure 2B, available online only), suggesting the plasmablast signature is associated with disease activity rather than long-term prognosis.
- Download figure
- Open in new tab
- Download powerpoint
Expression profi ling purifi ed cells identify large numbers of novel expression differences. (A,B) Differential gene expression was measured in purifi ed cell subsets from both (A) systemic lupus erythematosus (SLE) and (B) antineutrophil cytoplasmic antibodyassociated small-vessel vasculitis (AAV) patients. Pie charts represent individual cell types and their size is proportional to the number of differentially expressed genes observed in each. Differentially expressed genes were defi ned as expression differences greater than 1.5-fold found to be statistically signifi cant following correction for multiple testing by setting the false discovery rate to 5%.
The probes representing the interferon, plasmablast and granulopoiesis signatures represent only a small fraction of the differentially expressed genes (vertical blue bar, figure 1A). The majority of the remaining genes could be broken down into two broad groups, those either upregulated or downregulated in controls compared with patients irrespective of diagnosis (figure 1A, vertical orange or yellow bar, respectively). Whereas these genes contained no obvious functional signatures, closer examination revealed that those upregulated in controls tended to be expressed more highly in cells of the lymphoid lineage (supplementary figure 3A, available online only), and those downregulated were expressed more highly in the myeloid lineage (supplementary figure 3B, available online only). Analysis of PBMC composition in AAV and SLE patients and controls revealed a significant relative T-cell lymphopaenia affecting both the CD4 and CD8 populations in AAV patients, but just the CD4 population in SLE patients, together with a significant relative monocytosis in both groups compared with controls (figure 1H). These differences in composition are likely to explain the majority of the expression differences observed earlier.
- Download figure
- Open in new tab
- Download powerpoint
A gene signature consistent with T-cell activation is found in CD4 samples from systemic lupus erythematosus (SLE), but not antineutrophil cytoplasmic antibody-associated small-vessel vasculitis (AAV), patients. (A) Analysis of the differentially expressed genes in CD4 samples from SLE, but not AAV, patients (supplementary table 8, available online only) using Pathway Miner (www.biorag.org) revealed a gene association network consistent with T-cell activation. Nodes represent differentially expressed genes, orange and green nodes indicate upregulated and downregulated genes, respectively, in SLE patients compared with controls. Edges indicate annotated associations between genes, with the thickness of the edge indicating the number of annotated associations. (B) Gene set enrichment analysis found no evidence for this network in peripheral blood mononuclear cell (PBMC) samples from SLE patients. (C) Microarray-based expression levels of LAT and STAT1 are highly correlated. (D) BNIP3L and CFLAR, but not BCL2 or BCL2L1, are differentially expressed in CD4 samples from SLE patients compared with controls. Horizontal bars denote means, statistical signifi cance was determined using a t test.
The ANOVA results also pointed to a CD8 T-cell signature differentiating AAV patients and controls (vertical purple bar, figure 1A), due to a number of genes primarily expressed in CD8 T cells being downregulated in AAV patients (supplementary table 7, available online only). This most likely reflects the specific relative CD8 T-cell lymphopaenia seen in AAV patients (figure 1H–I).
Microarray analysis of purified leucocyte subsets from AAV and SLE patients identifies cell-intrinsic expression differences.
To look for cell-specific expression changes that might provide clinically useful biomarkers we carried out a microarray analysis on purified CD4 and CD8 T cells, B cells, monocytes and neutrophils isolated at the same time as the PBMC from SLE or AAV patients described earlier.
Imposition of a 1.5-fold change cut-off identified 229 probes from the PBMC data that showed significant differential expression between SLE patients and controls (figure 2A). Of these, 112 belonged to the interferon, granulopoiesis or plasmablast signatures, with the remaining 117 falling into the unassigned category. Analysis of the purified leucocyte subsets identified many more differentially expressed genes, with a remarkably small overlap with those found in PBMC (6.5% in neutrophils to 39% in monocytes; figure 2A and specific examples in supplementary figure 4, available online only). Of the 1607 cell-specific genes differentiating disease from controls seen across the five cell types, 86% were missed on PBMC analysis. The plasmablast signature was not seen in the B-cell samples, nor the granulopoiesis signature in the neutrophils, further supporting the conclusion that these arise from differences in PBMC composition between SLE patients and controls. The only expression signature seen consistently across all cell subsets was the interferon signature (figure 2A and supplementary figure 4, available online only).
- Download figure
- Open in new tab
- Download powerpoint
Monocyte gene expression data clearly differentiates patients with systemic lupus erythematosus (SLE) and antineutrophil cytoplasmic antibody-associated small-vessel vasculitis (AAV) from each other and from normal controls. Hierarchical clustering of 13 SLE patients, 44 AAV patients and 25 normal controls using data from genes expressed in CD14 monocytes separates the samples into the three diagnostic groups (compared with Figure 1A). Hierarchical clustering was performed using the Pearson correlation coeffi cient as distance metric and average-linkage clustering. The vertical blue bar denotes interferon-inducible genes.
In a similar analysis of the AAV samples, 843 probes were found to be differentially expressed in PBMC samples between patients and controls (figure 2B), most falling into the ‘unassigned’ category. As in the SLE patients, there was little overlap between differentially expressed genes identified in the purified cell subsets and PBMC (specific examples in supplementary figure 4, available online only); from 8% in B cells to 43% in CD4 T cells (figure 2B).
We performed quantitative PCR, which confirmed the significant correlation between expression measured by microarray or quantitative PCR (supplementary figure 5, available online only).
Purified CD4 T-cell analysis reveals an SLE-specific activation signature.
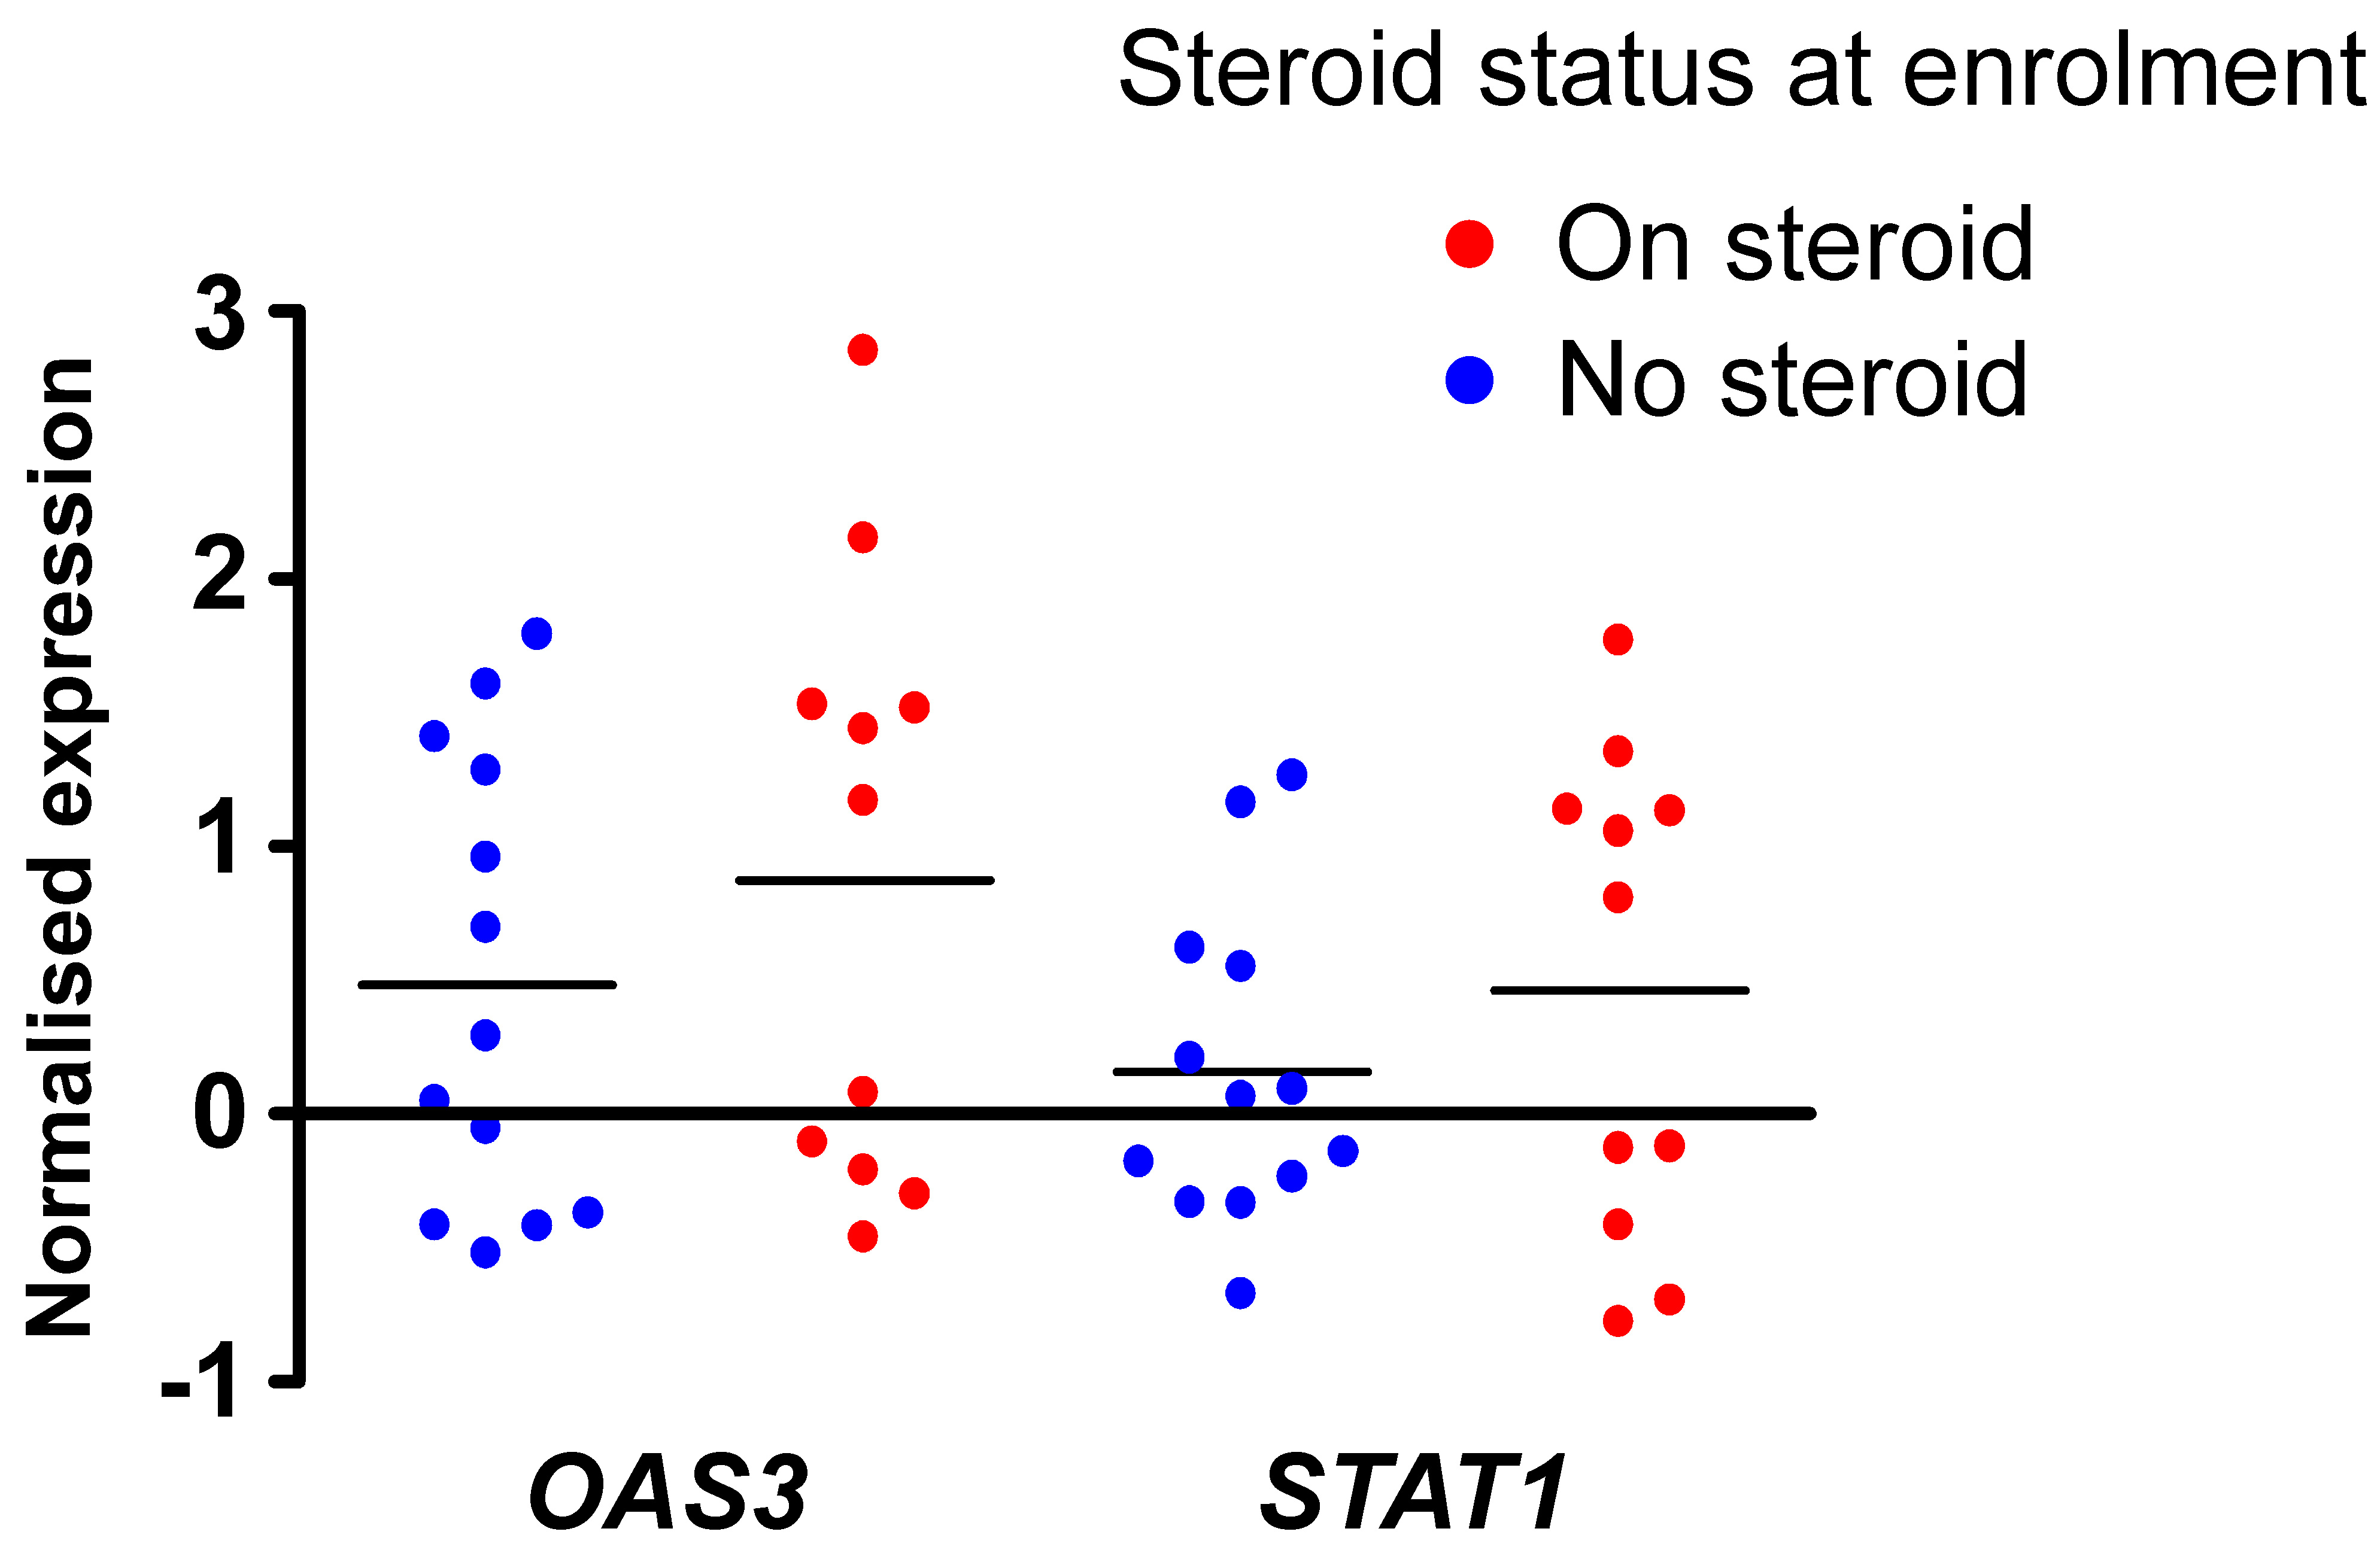
Among the 211 genes that show significant differential expression in CD4 T cells between SLE patients and controls (supplementary table 8, available online only), the biggest cluster represents interferon-inducible transcripts (figure 2A). In agreement with other studies,13 14 the upregulation of interferon-inducible genes was not seen in all patients, and was independent of treatment at enrolment (supplementary figure 6, available online only).
To look for coordinated dysregulation of other pathways in the CD4 expressed genes differentially expressed in SLE patients we searched the KEGG (www.genome.ad.jp), BioCarta (www.biocarta.com) and GenMAPP (www.genmapp.org) databases using the Pathway Miner tool.22 This analysis revealed a network of differentially expressed genes broadly related to T-cell activation (figure 3A). An identical analysis of genes differentially expressed in PBMC samples from SLE patients failed to reveal these expression differences (supplementary figure 7, available online only, and data not shown), as did a specific search for them using GSEA (figure 3B).
Interestingly, the expression of many genes in the network was strongly correlated with STAT1 expression (figure 3C), suggesting that their expression may be regulated by signalling downstream of the type 1 interferon receptor. In keeping with this, analysis of a 2 kb segment of DNA immediately upstream of the start site of each of the 28 genes in the signature revealed the presence of consensus interferon response factor (IRF) 3 and/or seven binding sites23 in the majority of cases (supplementary table 9, available online only). GSEA did not identify this signature in CD4 T cells from AAV patients (peak enrichment score 0.35, p=0.81), indicating that it may be SLE specific.
This finding is in agreement with the observation that type 1 interferon signalling keeps activated murine T cells alive, independent of a measurable effect on BCL2 or BCL2L1 (Bcl-X) levels.24 Consistent with this, we observed no difference in the expression level of these genes between SLE patients and controls (figure 3D); however, expression of the pro-apoptotic molecule BNIP3L is reduced and that of the anti-apoptotic molecule CFLAR elevated in SLE patients (figure 3D). Cell-specific array analysis has thus identified a novel interferon-associated, CD4 T-cell signature, which immediately suggests a mechanism for driving SLE pathogenesis.
Gene expression in monocytes differentiates patients with AAV and SLE from each other and from controls more robustly than PBMC data.
Gene expression data from unseparated PBMC samples is unable to discriminate SLE and AAV patients efficiently from each other or from controls (figure 1A and supplementary figure 8, available online only). To determine whether expression data from purified cells result in improved clustering, we analysed monocyte-derived microarray data from 13 SLE patients, 44 AAV patients and 25 normal controls (two SLE samples failed quality control). Data from 20 495 probes were subjected to ANOVA with correction for multiple testing to detect differentially expressed probes among the three groups. Post-hoc analysis identified 15 probes that best differentiated AAV patients from controls, 38 probes that differentiated SLE patients from controls and 41 probes that separated AAV and SLE patients. Hierarchical clustering of the 82 monocyte samples with the non-redundant list of probes generated from this analysis (supplementary table 10, available online only) clearly separated the samples into three groups (figure 4). Of the 14 samples in group 1, 12 are SLE patients, in group 2, 20 of the 21 samples are controls, and in group 3, 42 of the 47 samples are AAV patients (figure 4). Therefore, in comparison with the clustering obtained using PBMC data (figure 1A and supplementary figure 8, available online only), the monocyte data gave a much cleaner separation between diagnostic groups.
The most prominent feature of the ANOVA-derived gene list is a cluster of 42 interferon-inducible genes (vertical blue bar, figure 4 and supplementary table 10, available online only), high expression of which differentiates the SLE patients in group1 from the rest. The remaining 16 probes predominantly represent genes upregulated in both disease groups compared with controls (supplementary table 10, available online only), and are enriched for genes encoding components of the acute phase response, including haptoglobin and orosomucoid (supplementary table 10, available online only).
Discussion
While the analysis of PBMC array data may identify expression differences of pathological importance, for example, the interferon signature in SLE, it is clear that many of the differences between disease and controls are due to variation in the proportion of cell subsets and are thus not seen when purified cell subsets are arrayed. Perhaps the best examples of such signatures are the plasmablast and granulocyte signatures seen in SLE patients; both reflect plasmablasts or immature granulocytes present in the PBMC. Most differentially expressed genes found in purified subsets were not found in PBMC. This was true for genes differentially expressed in rarer cell types, for example, B cells, but also for those expressed in both CD4 and CD8 cells, which together make up the biggest proportion of PBMC. Surprisingly, PBMC analysis even failed to detect expression differences unique to genes expressed in only a single cell type. However, once a gene signature has been identified in purified cells, it may then be feasible in follow-up studies to test for the signature in unseparated cells using quantitative PCR of selected genes less influenced by population variation or by bioinformatics normalisation for cell proportions.
Analysis of purified T cells revealed an SLE-associated T-cell signature not seen in PBMC analyses,13 14 which may play a role in pathogenesis. T cells infiltrate inflamed organs and provide help for autoreactive B cells in SLE,25 and a number of T-cell defects have been reported in SLE patients.26 27 The majority of the genes making up the T-cell signature has promoters that contain consensus IRF3 and/or IRF7 binding sites and their expression levels correlate strongly with that of STAT1, suggesting that the signature might be driven by type 1 interferon signalling.
One component of this signature is increased expression of CXCR6, the receptor for CXCL16,28 which is expressed on a proportion of memory T cells and CD16 natural killer cells and is upregulated on activation.29 CXCR6 defines a subset of memory/effector T cells with tissue-homing potential,30 and consistent with this CXCR6+ T cells are enriched in inflamed tissues from a number of inflammatory conditions, including rheumatoid arthritis,30 Graves' disease31 and sarcoidosis,32 and treatment with an anti-CXCL16 monoclonal antibody reduces the severity of collagen-induced arthritis in mice.33 This first association of CXCR6 on CD4 T cells with SLE might thus be associated with tissue inflammation.
Type 1 interferon signalling promotes activated T-cell survival.24 The decreased expression of the pro-apoptotic molecule BNIP3L in SLE patients is particularly interesting as it is a functional homologue of BNIP3, which has been shown to play a role in activation-induced T-cell death.34 Similarly, CFLAR, also upregulated by type 1 interferon,35 protects T cells from T-cell receptor-mediated apoptosis.36 This is an example of a disease-related signature providing insight into pathogenesis that is only seen in purified cells.
Fundamental to the generation of expression-based diagnostic biomarkers is accurate clustering of patients by diagnosis. Expression data from unseparated cells is very poor at differentiating SLE and AAV. However, data from purified cells result in significantly improved discrimination, presumably because the differentially expressed genes reflect genuine differences in processes underlying disease pathogenesis rather than simply differences in relative cell proportion. It has long been hoped that microarrays would yield diagnostic tests in autoimmunity; our data suggest that the analysis of purified cell populations is a superior way to achieve this.
While array analysis of PBMC provides some useful information, the use of purified cell subsets identifies many more differentially expressed disease-specific genes. Such analysis promises to provide substantial advantages in the search for diagnostic and prognostic biomarkers in autoimmune disease.
Acknowledgments
The authors would like to thank the Wellcome Trust Clinical Research Facility at Addenbrooke's Hospital, and all the patients and controls who have contributed to this study. KGCS is a Lister Prize Fellow.
References
Supplementary materials
Web Only Data ard.2009.108043
Files in this Data Supplement:
Footnotes
-
Funding The study received financial support from the NIHR Cambridge Biomedical Research Centre, the Wellcome Trust, Kidney Research UK, the Medical Research Council and the Evelyn Trust. The Cambridge Institute for Medical Research is in receipt of a Wellcome Trust Strategic Award (079895).
-
Competing interests None.
-
Ethics approval This study was conducted with the approval of the Cambridge Local Research Ethics Committee.
-
Provenance and peer review Not commissioned; externally peer reviewed.