Article Text

Abstract
Objectives Behçet’s syndrome (BS) is a rare systemic vasculitis often complicated by thrombotic events. Given the lack of validated biomarkers, BS diagnosis relies on clinical criteria.
In search of novel biomarkers for BS diagnosis, we determined the profile of plasmatic circulating microRNAs (ci-miRNAs) in patients with BS compared with healthy controls (HCs).
Methods ci-miRNA profile was evaluated by microarray in a screening cohort (16 patients with BS and 18 HCs) and then validated by poly(T) adaptor PCR (PTA-PCR) in a validation cohort (30 patients with BS and 30 HCs). Two disease control groups (30 patients with systemic lupus erythematosus (SLE) and 30 patients with giant cell arteritis (GCA) were also analysed.
Results From the microarray screening, 29 deregulated (differentially expressed (DE)) human ci-miRNAs emerged. A hierarchical cluster analysis indicated that DE ci-miRNAs clearly segregated patients from controls, independently of clinical features. PTA-PCR analysis on the validation cohort confirmed the deregulation of miR-224-5p, miR-206 and miR-653-5p. The combined receiver operating characteristic (ROC) curve analyses showed that such ci-miRNAs discriminate BS from HCs (and BS with active vs inactive disease), as well as BS from patients with SLE and GCA.
The functional annotation analyses (FAAs) showed that the most enriched pathways affected by DE ci-miRNAs (ie, cell–matrix interaction, oxidative stress and blood coagulation) are related to thrombo-inflammatory mechanisms. Accordingly, the expression of the three ci-miRNAs from the validation cohort significantly correlated with leucocyte reactive oxygen species production and plasma lipid peroxidation.
Conclusions The ci-miRNA profile identified in this study may represent a novel, poorly invasive BS biomarker, while suggesting an epigenetic control of BS-related thrombo-inflammation.
- systemic vasculitis
- cardiovascular disease
- inflammation
- Behçet Syndrome
- autoimmune diseases
Data availability statement
Data are available in a public, open access repository. Data are available upon reasonable request. All data relevant to the study are included in the article or uploaded as supplementary information.
This is an open access article distributed in accordance with the Creative Commons Attribution Non Commercial (CC BY-NC 4.0) license, which permits others to distribute, remix, adapt, build upon this work non-commercially, and license their derivative works on different terms, provided the original work is properly cited, appropriate credit is given, any changes made indicated, and the use is non-commercial. See: http://creativecommons.org/licenses/by-nc/4.0/.
Statistics from Altmetric.com
Key messages
What is already known about this subject?
The pathogenesis of Behçet’s syndrome (BS) is still unclear and no unique feature or specific laboratory test is available in the clinical setting.
Circulating miRNAs (ci-miRNAs) play a role in both vascular and immune-mediated diseases, acting both as potential candidate biomarkers and pathogenic pathway clues.
ci-miRNAs may represent valuable poorly invasive biomarkers in vasculitides such as BS.
What does this study add?
Thanks to a microarray screening and subsequent results validation by RT-qPCR, we identified a unique ci-miRNA profile which segregates patients with BS from healthy subjects, as well as BS from other disease control groups.
The identified ci-miRNA profile potentially controls pathways related to thrombo-inflammation.
How might this impact on clinical practice or future developments?
The obtained ci-miRNA profile could be exploited as a novel, poorly invasive, candidate biomarker and could allow the design of novel therapeutic strategies in BS.
Introduction
Behçet’s syndrome (BS) is chronic systemic vasculitis of unknown aetiology and unique geographical distribution.1 BS is a rare disease, with higher prevalence limited to countries across the ancient Silk Route. Given the lack of validated biomarkers, disease definition is based on clinical criteria, which leads to difficult and often delayed diagnosis, especially in areas with low BS prevalence.1 BS pathophysiology is poorly understood, but both genetic predisposition and infectious triggers seem to have a causative role in the derangement of adaptive and innate immune responses.2
Besides mucocutaneous and ocular involvement, vascular events represent one of the major BS manifestations, with venous thrombosis, aneurysms and arterial occlusions being the main factors accounting for BS-associated morbidity and mortality.3 4 Consistently, BS represents a model of inflammation-induced thrombosis. The inflammatory nature of the vascular BS manifestations is suggested both by the pathogenetic mechanisms identified so far (eg, oxidative modifications of coagulation proteins, the formation of neutrophil extracellular traps, endothelial dysfunction and enhanced adhesiveness)5–9 and by clinical studies supporting the use of immunosuppressants rather than anticoagulants for the management of thrombotic events.3 4 8 10 The hypercoagulability state which characterises BS seems to be associated with inflammation-driven alterations of the thrombotic balance. The hyperactivation and perivascular infiltration of neutrophils with the ensuing production of reactive oxygen species (ROS) apparently links immune response deregulation with thrombotic events.5 7 However, the exact cellular and molecular mechanisms underlying BS-associated thrombotic diathesis still lack clarity.
miRNAs are a class of small non-coding RNAs that act as post-transcriptional regulators of gene expression by base-pairing to specific sites of target mRNAs, causing their degradation or translational inhibition. Thirty per cent of all human genes are under epigenetic modulation by miRNAs, through the control of the expression of multiple mRNA targets. Therefore, miRNAs act as pathogenetic pathway clues, reflecting pathophysiological processes in several human diseases.11 Some miRNAs are actively secreted into extracellular spaces (circulating miRNAs, ci-miRNAs), either through microvesicles or as free non-encapsulated RNAs, and may hence behave as cell-to-cell molecular communication devices, under both physiological and pathological conditions, by specific cell uptake.12
Plasma is the main repository of extracellular miRNAs, originating from endothelial or blood cells.13 Extracellular ci-miRNAs display several properties that make them appealing candidates as biomarkers for various human diseases,14–16 including vascular and immune-mediated disorders.17–24 To date, some miRNA-based diagnostic products are in clinical development for a wide range of diseases,25–27 but no miRNA-based diagnostic has reached the market, yet.
The aim of this study was to determine whether a peculiar ci-miRNA profile is specifically associated with BS, hence representing a novel biomarker candidate, with potentially relevant implications in BS pathophysiology.
Materials and methods
Study design and population
A prospective derivation and validation study was performed at the Behçet Center of the Careggi University Hospital (Florence, Italy). Two independent cohorts of adult patients with BS fulfilling the International Criteria for Behçet Disease (ICBD) were included.28 Of them, one cohort was used as screening setting and one as validation setting. Both cohorts were matched by age and sex with a healthy control (HC) cohort. Demographic, clinical and therapeutic data related to the medical history and to the time of enrolment were collected. Subjects with other autoimmune, neoplastic or active infectious diseases were excluded. Disease activity was evaluated by Behçet’s Disease Activity Form (BDCAF). Two disease control groups were also included in the study: systemic lupus erythematosus (SLE) and giant cell arteritis (GCA). SLE was chosen as the prototype of systemic auto-mmune diseases, and because affected patients may show some clinical manifestations similar to BS. On the other hand, GCA along with BS represents a systemic vasculitis with prevalent medium and large vessels involvement.
Sample size was determined by power analysis
The experimental workflow is described in figure 1. For the screening phase, plasma samples were subjected to microarray analysis, whereas the expression levels of the six most deregulated miRNAs emerging from microarray data were quantified by real-time PCR in the validation phase.

Flow chart of the study design. The study was composed of two different sequential phases: a screening phase followed by a validation phase (indicated by the rounded boxes). In the first phase, miRNA microarray technology was applied to an initial study cohort and top differentially expressed (DE) circulating microRNAs (ci-miRNAs) were then selected for further poly(T) adaptor PCR (PTA-PCR) validation in a larger and cohort according to the following criteria: −2>log2FC>2, p<0.01 (Limma differential expression t-test) and biological meaning (see online supplemental methods). The analyses performed on the results deriving from each phase are indicated in the square boxes. FAA, functional annotation analysis; FC, normalised expression fold change values in log2 scale; ROC, receiver operating characteristic; ROS, reactive oxygen species.
Supplemental material
Hierarchical cluster analysis and functional annotation analysis (FAA) were applied to microarray data to assess the ability to segregate patients with BS from HCs, and the biological meaning of differentially expressed (DE) ci-miRNAs. PCR data from the validation cohort were used to perform ROC curve analysis to assess DE ci-miRNAs’ discriminatory power. Moreover, functional analysis (both bioinformatic, by FAA, and experimental, determining oxidative stress in circulating leucocytes and plasma lipid peroxidation) was performed to evaluate the potential impact of the selected ci-miRNAs on BS pathogenetic mechanisms (figure 1).
Plasma preparation and RNA extraction
Eight millilitres of peripheral blood was collected from each subject (BS and HC) in K2-EDTA anticoagulant by standard venipuncture. Platelet-free plasma (PFP) was obtained from peripheral blood samples by a double centrifugation protocol (1500 g for 15 min at room temperature followed by supernatant centrifugation at 13 000×g for 3 min). Total RNA was extracted from 250 µL fresh plasma aliquots, using TRIzol LS reagent (Invitrogen, Carlsbad, California, USA) following the manufacturer’s protocol. Only RNA samples showing acceptable quality and concentration values were included (see online supplemental methods).
Archival plasma collection
For disease control groups, available archival PFP plasma samples were collected at the Lupus and Vasculitis Unit of the University of Florence. RNA extraction was performed using the same protocol described for fresh plasma samples.
Comparability between archival and fresh plasma samples was checked by comparing PCR amplification results (online supplemental figure 1).
miRNA microarray
ci-miRNA profiling was performed using Agilent Human miRNA 8×15 k Microarray kit v3.0 and miRNA Complete Labelling and Hyb Kit (Agilent Technologies, Santa Clara, California, USA) following manufacturer’s protocol. Microarray data analysis is detailed in the online supplemental methods.
Real-time quantitative PCR (PTA-PCR)
Selected ci-miRNA expression was validated by PTA-PCR using mature miRNA-specific primers and the stringent thermal protocol29 (see the online supplemental methods, table 1 and figure 2).
Functional annotation analysis
Predicted miRNA targets FAA was performed on the comprehensive (ie, the 29 DE human ci-miRNAs, see the Results section) ci-miRNA profile using the online tool DIANA-miRPath (see the online supplemental methods).30
Assessment of leucocyte ROS production and plasma lipid peroxidation
Lymphocyte, monocyte and neutrophil ROS production, as well as plasma lipid peroxidation, were measured as described in Becatti et al.31
Statistics
Categorical variables are presented with counts and proportions, while continuous ones as the mean±SE of the mean (SEM) or median with IQR. Statistical analysis was performed using GraphPad Prism V.6.0 (GraphPad Software, San Diego, California, USA). Differential expression analysis of Agilent microRNA array data was performed using the AgiMicroRna Bioconductor library (see the online supplemental methods). ROC curve analysis was performed using Matlab built-in function perfcurve V.2019a. All statistical tests were two tailed with a significance level of 0.05. Power analysis was performed using the software STATA (StataCorp V.14).
Results
Patients’ characteristics
The study included a screening cohort of 34 subjects (16 BS and 18 HC) and a validation cohort of 60 subjects (30 BS and 30 HC). Clinical and demographic characteristic of both cohorts are reported in table 1. In both cohorts, the two sexes were equally distributed. Notably, 6 out of 16 (37.5%) and 14 out of 30 (46.6%) patients had history of vascular events following BS onset, in the screening and validation cohorts, respectively.
Main demographics and clinical features of patients with Behçet’s syndrome and healthy controls included in the screening and validation cohorts
In the screening cohort, 50% of patients had active BS at time of enrolment, defined as a BDCAF score ≥1, and 13 out of 16 (81.3%) were on active immunomodulating therapy, either for active manifestations or for remission maintenance. In the validation cohort, 40% of patients had active BS at enrolment, and 29 out of 30 (96.7%) patients were receiving immunomodulators.
Disease control groups comprised 30 patients with SLE (mean age at enrolment 47.6±2.36, 29 females) and 30 patients with GCA (mean age 71.8±2.18, 21 females). The two groups were representative of the overall SLE and GCA populations in terms of demographic characteristics.
The DE ci-miRNA microarray profile segregates patients with BS from HC
RNA samples included in the screening phase were subjected to miRNA profiling using dedicated Agilent technology. Complete microarray data are available at GEO (accession number GSE145191) and included in Bagni et al.32 Statistical analysis of microarray data revealed the presence of 36 DE (p<0.05; −1>log2 FC>1) ci-miRNAs between patients with BS and HC (see table 2).
DE ci-miRNAs identified by microarray analysis in the screening phase
The identified profile mainly comprised human sequences (29 out of 36, indicated by the ‘hsa’ prefix), only seven mi-RNAs being of viral origin. Considering only human sequences, 16 out of the 29 DE ci-miRNAs were upregulated and 13 downregulated. Unsupervised hierarchical cluster analysis performed on the DE ci-miRNAs showed that 94% of samples co-segregate according to their different clinical status (BS vs HC), with the presence or absence of the disease causing the variation itself (figure 2). No significant association of the pattern of DE ci-miRNAs with specific clinical or demographic features (including disease activity state) emerged from microarray analysis.

Differentially expressed (DE) circulating microRNA (ci-miRNA) microarray profile hierarchical clustering analysis. Comprehensive DE ci-miRNA profile in patients with BS and HC: DE ci-miRNAs showed in the heatmap were selected according to the following statistical conditions: p<0.05 (Limma differential expression t-test), −1>log2 FC>1. Each heatmap column represents the expression profile of one sample (n=34, 16 patients ith BS vs 18 HC); green colour indicates high expression levels, while red colour indicates low expression levels. The heatmap dendrogram is representative of the unsupervised hierarchical cluster analysis. BS, Behçet’s syndrome; HC, healthy control.
To strengthen microarray results, the differential expression of 6 ci-miRNAs (selected on the basis of most relevant fold change values, p value and potential biological meaning, see online supplemental methods) emerging from microarray (hsa-miR-206, hsa-miR-224-5p, hsa-miR-653-5p, hsa-miR-187-3p, hsa-miR-411-5p and hsa-miR-27a-3p, highlighted in bold italic in table 2) was assessed by PTA-PCR, in a small sample subset (5 patients with BS vs 5 HCs, online supplemental table 2). The obtained PCR fold change values showed a significant correlation (Pearson’s correlation coefficient r=0.828, two-tailed p=0.0418) with those from the microarray screening (online supplemental figures 3 and 4).
The FAA of the DE ci-miRNAs indicates the involvement of pathways related to thrombo-inflammation
FAA was then performed on the 29 DE hsa ci-miRNAs, applying DIANA-miRPath analysis. A list of significantly (FDR-corrected p value <0.05) enriched pathways was identified. As expected, from both KEEG (Kyoto Encyclopedia of Genes and Genomes) pathway analysis and Gene Ontology (GO), biological mechanisms related to the immune system emerged. In particular, KEEG terms potentially converging on T regulatory (Treg) cell function and development (eg, FOXO-related terms) (figure 3A, online supplemental figure 5),33 and Toll-like receptors (TLR) signalling pathways GO:BP (Gene Ontology Biological Process) terms were also significantly enriched (figure 3B). However, the KEEG terms which displayed significant enrichment scores were ‘focal adhesion’, ‘regulation of actin cytoskeleton’, ‘MAPK signalling pathway’, ‘ECM (extracellular matrix) receptor interaction’ (figure 3A). In addition, the GO:BP term ‘cellular nitrogen compound metabolic process’ showed the highest enrichment score (figure 3B). Another significantly enriched GO:BP term was the ‘cellular protein modification process’ (figure 3B), which comprises mechanisms relative to protein oxidation and oxidative carbonylation. Finally, the ‘blood coagulation’ term also showed significant enrichment in the comprehensive DE human ci-miRNA profile analysis (figure 3B). Interestingly, part of the DE ci-miRNA targets included in the ‘blood coagulation’ GO:BP term overlapped with those involved in the most enriched ‘ECM-receptor interaction’ KEEG pathway. These include genes encoding for integrin alpha and beta subunits, thrombospondin, collagen type 1 alpha 2 chain, fibronectin, von Willebrand factor and platelet glycoprotein VI.

KEEG (Kyoto Encyclopedia of Genes and Genomes) pathways and GO (Gene Ontology) enrichment analysis. (A) Top significantly enriched KEEG terms. Terms relative to cell–matrix interaction are shown in red, the ones linked to innate and adaptive immunity are in black and white pattern. Highlighted KEEG terms: ‘ECM receptor interaction’ (hsa04512) (p=0.008), ‘mTOR signaling pathway’ (hsa04150) (p=0.0005), ‘PI3K-Akt signaling pathway’ (hsa04151) (p=0.0006), ‘gap junctions’ (hsa04540) (p=0.0008), ‘TGF-beta signaling pathway’ (hsa04350) (p=3.80E-05), ‘MAPK signaling pathway’ (hsa04010) (p=0.0011), ‘cAMP signaling pathway’ (hsa04024) (p=0.0022), ‘AMPK signaling system’ (hsa04152) (p=3.95E-05), ‘Hippo signaling pathway’ (hsa04390) (p=0.0032), ‘FoxO signaling pathway’ (hsa04068) (p=1.24E-06), ‘regulation of actin cytoskeleton’ (hsa04810) (p=0.024), ‘focal adhesion’ (hsa04510) (p=0.00028), ‘phosphatidylinositol signaling system’ (hsa04070) (p=0.039), ‘Wnt signaling pathway’ (hsa04310) (p=0.0027), ‘HIF signaling pathway’ (hsa04066) (p=0.006). (B) Top significantly enriched GO BP terms. Bars corresponding to terms involved in oxidative stress are shown in blue, the ones related to blood coagulation are in green, while the ones related to innate and adaptive immunity are in black and white pattern. Highlighted GO:BP terms: ‘cellular nitrogen compound metabolic process’ (GO:0034641) (p=1.92E-150), ‘cellular protein modification process’ (GO:0006464) (p=2.25E-52), ‘blood coagulation’ (GO:0007596) (p=7.09E-31), ‘toll-like receptor TLR1:TLR2 signaling pathway’ (GO:0038123) (p=2.49E-17), ‘toll-like receptor TLR6:TLR2 signaling pathway’ (GO:0038124) (p=2.49E-17), ‘toll-like receptor 10 signaling pathway’ (GO:0034166) (p=4.04E-17), ‘toll-like receptor 9 signaling pathway’ (GO:0034162) (p=0.0002683). Both KEEG pathway and GO annotation analysis was performed taking into account the comprehensive DE human miRNA profile using DIANA-miRPath v.3.0 (genes union mode, FDR-corrected p value threshold=0.05, microT threshold=0.07). The larger -log10(p value) (enrichment score) indicates a smaller p value. (C) Proposed ci-miRNA-driven pathogenetic mechanisms grouping terms and target genes outlined in (A) and (B). COL1A2, collagen type 1 alpha 2 chain; F3, coagulation factor 3 or tissue factor (TF); F5, coagulation factor 5; F7, coagulation factor 7; F9, coagulation factor 9; F10, coagulation factor 10; FN1, fibronectin 1; GP6, platelet glycoprotein VI; ITGAs, integrins alpha subunit genes; ITGBs, integrins beta subunit genes; NO, nitric oxide; SERPIN, serine protease inhibitor; TFPI, tissue factor pathway inhibitor; THBS1, thrombospondin 1; VEGFA, vascular endothelial growth factor; VKORC1, vitamin K epoxide reductase complex subunit 1; VWF, von Willembrand factor. *ITGA1, ITGA10, ITGA2, ITGA3, ITGA5, ITGA6, ITGAV, ITGB1. **SERPINB2, SERPIND1, SERPINE1, SERPINE2, SERPINF2, SERPING1.
Overall, threemain processes comprise the most enriched terms emerging from the FAA analysis: cell–matrix interaction, oxidative stress and blood coagulation (figure 3C). Notably, such three processes can be considered together as affecting the thrombotic balance at the vessel level. Collectively, terms and pathways suggestive of thrombo-inflammatory mechanisms emerged from the FAA analysis of the DE ci-miRNAs.
The combination of hsa-miR-224-5p, hsa-miR-206 and hsa-miR-653-5p shows diagnostic potential for BS
We then analysed plasma samples belonging to the validation cohort, applying the PTA-PCR protocol to determine the expression levels of the following ci-miRNAs: hsa-miR-27a-3p, hsa-miR-187-3p, hsa-miR-411-5p, hsa-miR-224-5p, hsa-miR-206 and hsa-miR-653-5p. Such miRNAs were previously used to assess the reliability of microarray data (online supplemental figures 3 and 4), and were here chosen since they were the most upregulated or downregulated human sequences (based on −2>Log2 FC>12 with p<0.01) and had already been reported as ci-miRNAs with available experimentally validated targets (see the online supplemental methods, tables 3 and 4). Considering a p value ≤0.05 to assess significance, three of six selected miRNAs (hsa-miR-224-5p, hsa-miR-206 and hsa-miR-653-5p) showed statistically significant differences between the two study groups (BS and HC), with a positive fold change direction (expressed as relative quantification, or ‘RQ’, performed by ΔΔCq method) consistent with microarray screening results (figure 4A). On the contrary, those ci-miRNAs resulting downregulated in the microarray screening phase failed to reach significance when analysed by PTA-PCR in the validation cohort.
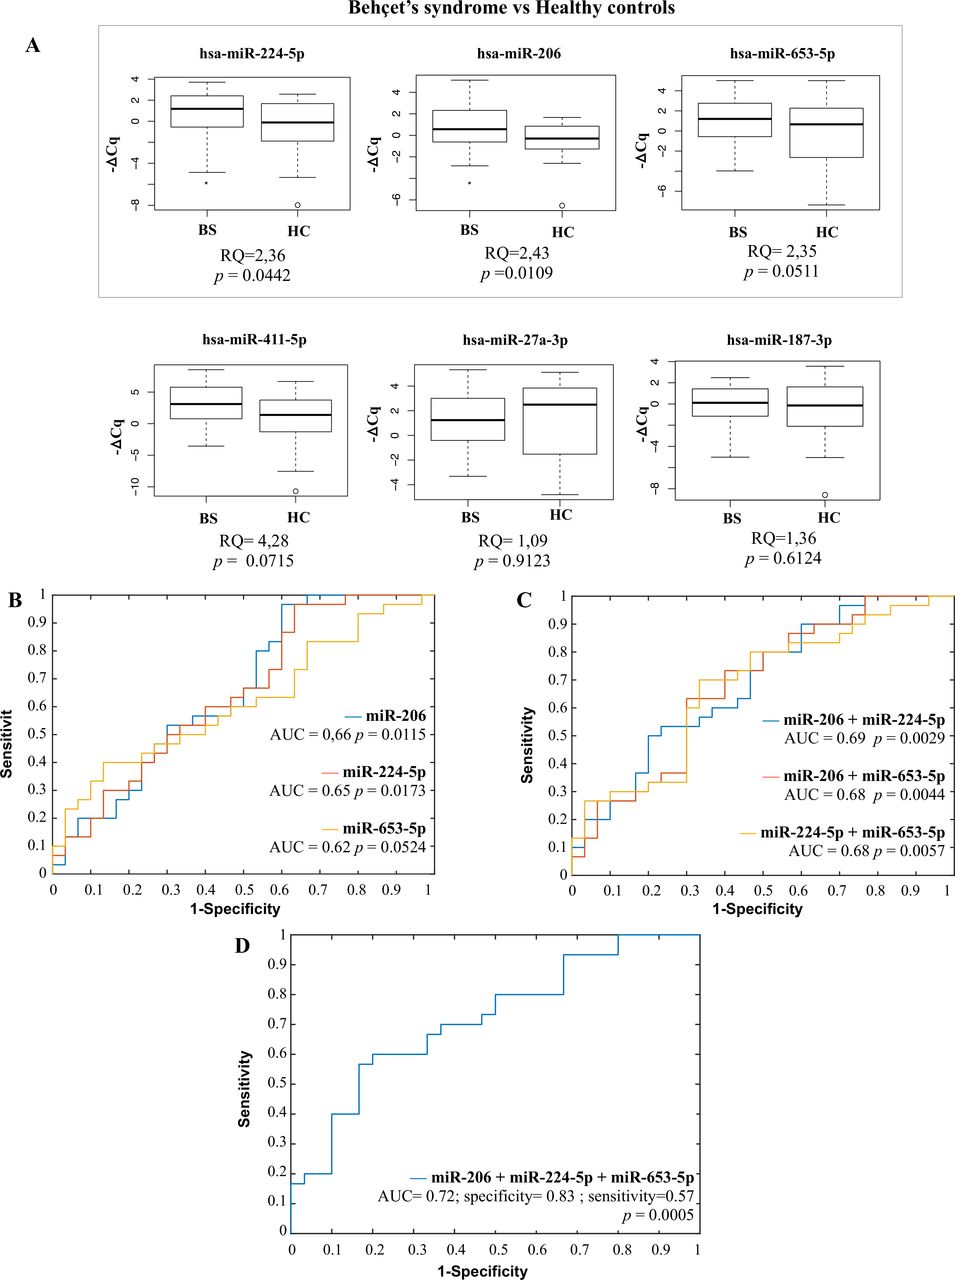
Validation phase results. (A) Selected ci-miRNAs poly(T) adaptor PCR (PTA-PCR) results in BS compared with HC. hsa-miR-653-5p (RQ=2.35, p=0.05), hsa-miR-224-5 p (RQ=2.35, p=0.04) and hsa-miR-206 (RQ=2.43, p=0.01) showed an upregulation in accordance with microarray results. hsa-miR-27a-3p and hsa-miR187-3p showed RQ of 1.09 (p=0.91) and 1.36 (p=0.61), respectively, while hsa-miR-411-5p reached a value of RQ=4.28 still without reaching statistical significance (p=0.07). Box and whiskers plots (95% CI). BS, Behçet’s syndrome; Cq, threshold cycle; HC, healthy control; RQ, relative quantification (ΔΔCq method); p, p value (Mann-Whitney test). n=60 (30 BS and 30 HC). Selected miRNAs ROC curve analysis. (B) Single miRNA ROC curves (hsa-miR-206: AUC=0.66, p=0.0115, 95% CI 0.60 to 0.97; hsa-miR-224-5p: AUC=0.65, p=0.0173, 95% CI 0.63 to 0.97; hsa-miR-653-5 p: AUC=0.62, p=0.0524, 95% CI 0.13 to 0.40); (C) two miRNA combination ROC curves (hsa-miR-206+hsa-miR-224-5 p: AUC=0.69, p=0.0029, 95% CI 0.50 to 0.80; hsa-miR-206+hsa-miR-653-5p: AUC=0.68, p=0.0044, 95% CI=0.30–0.63; hsa-miR-224–5p+hsa-miR-653–5 p: AUC=0.68, p=0.0057, 95% CI=0.33–0.70); (D) three miRNA combination ROC curve (hsa-miR-206+hsa-miR-224-5p+hsa-miR-653-5p): AUC=0.72, p=0.0005, 95% CI 0.50 to 0.93, specificity=0.83, sensitivity=0.57). AUC, area under the curve; p=p value (z-test)al. n=60 (30 BS and 30 HC). The receiver operating characteristic (ROC) curves and the optimal values of sensitivity and sensibility have been computed using the built-in Matlab function perfcurve.m (V.R2021b).
ROC curve analyses, both single and multiple marker combinations, were then performed on the three selected miRNAs which reached the statistical significance (hsa-miR-206, hsa-miR-224-5p and hsa-miR-653-5p). Both single miRNAs and two miRNA combinations (figure 4B,C) failed to reach area under the curve (AUC) values corresponding to an acceptable marker discriminating power. On the contrary, the combination of all three miRNAs (figure 4D) revealed a fair but highly significant AUC value (0.72, p=0.0005), with a specificity of 0.83 and a sensitivity of 0.57.
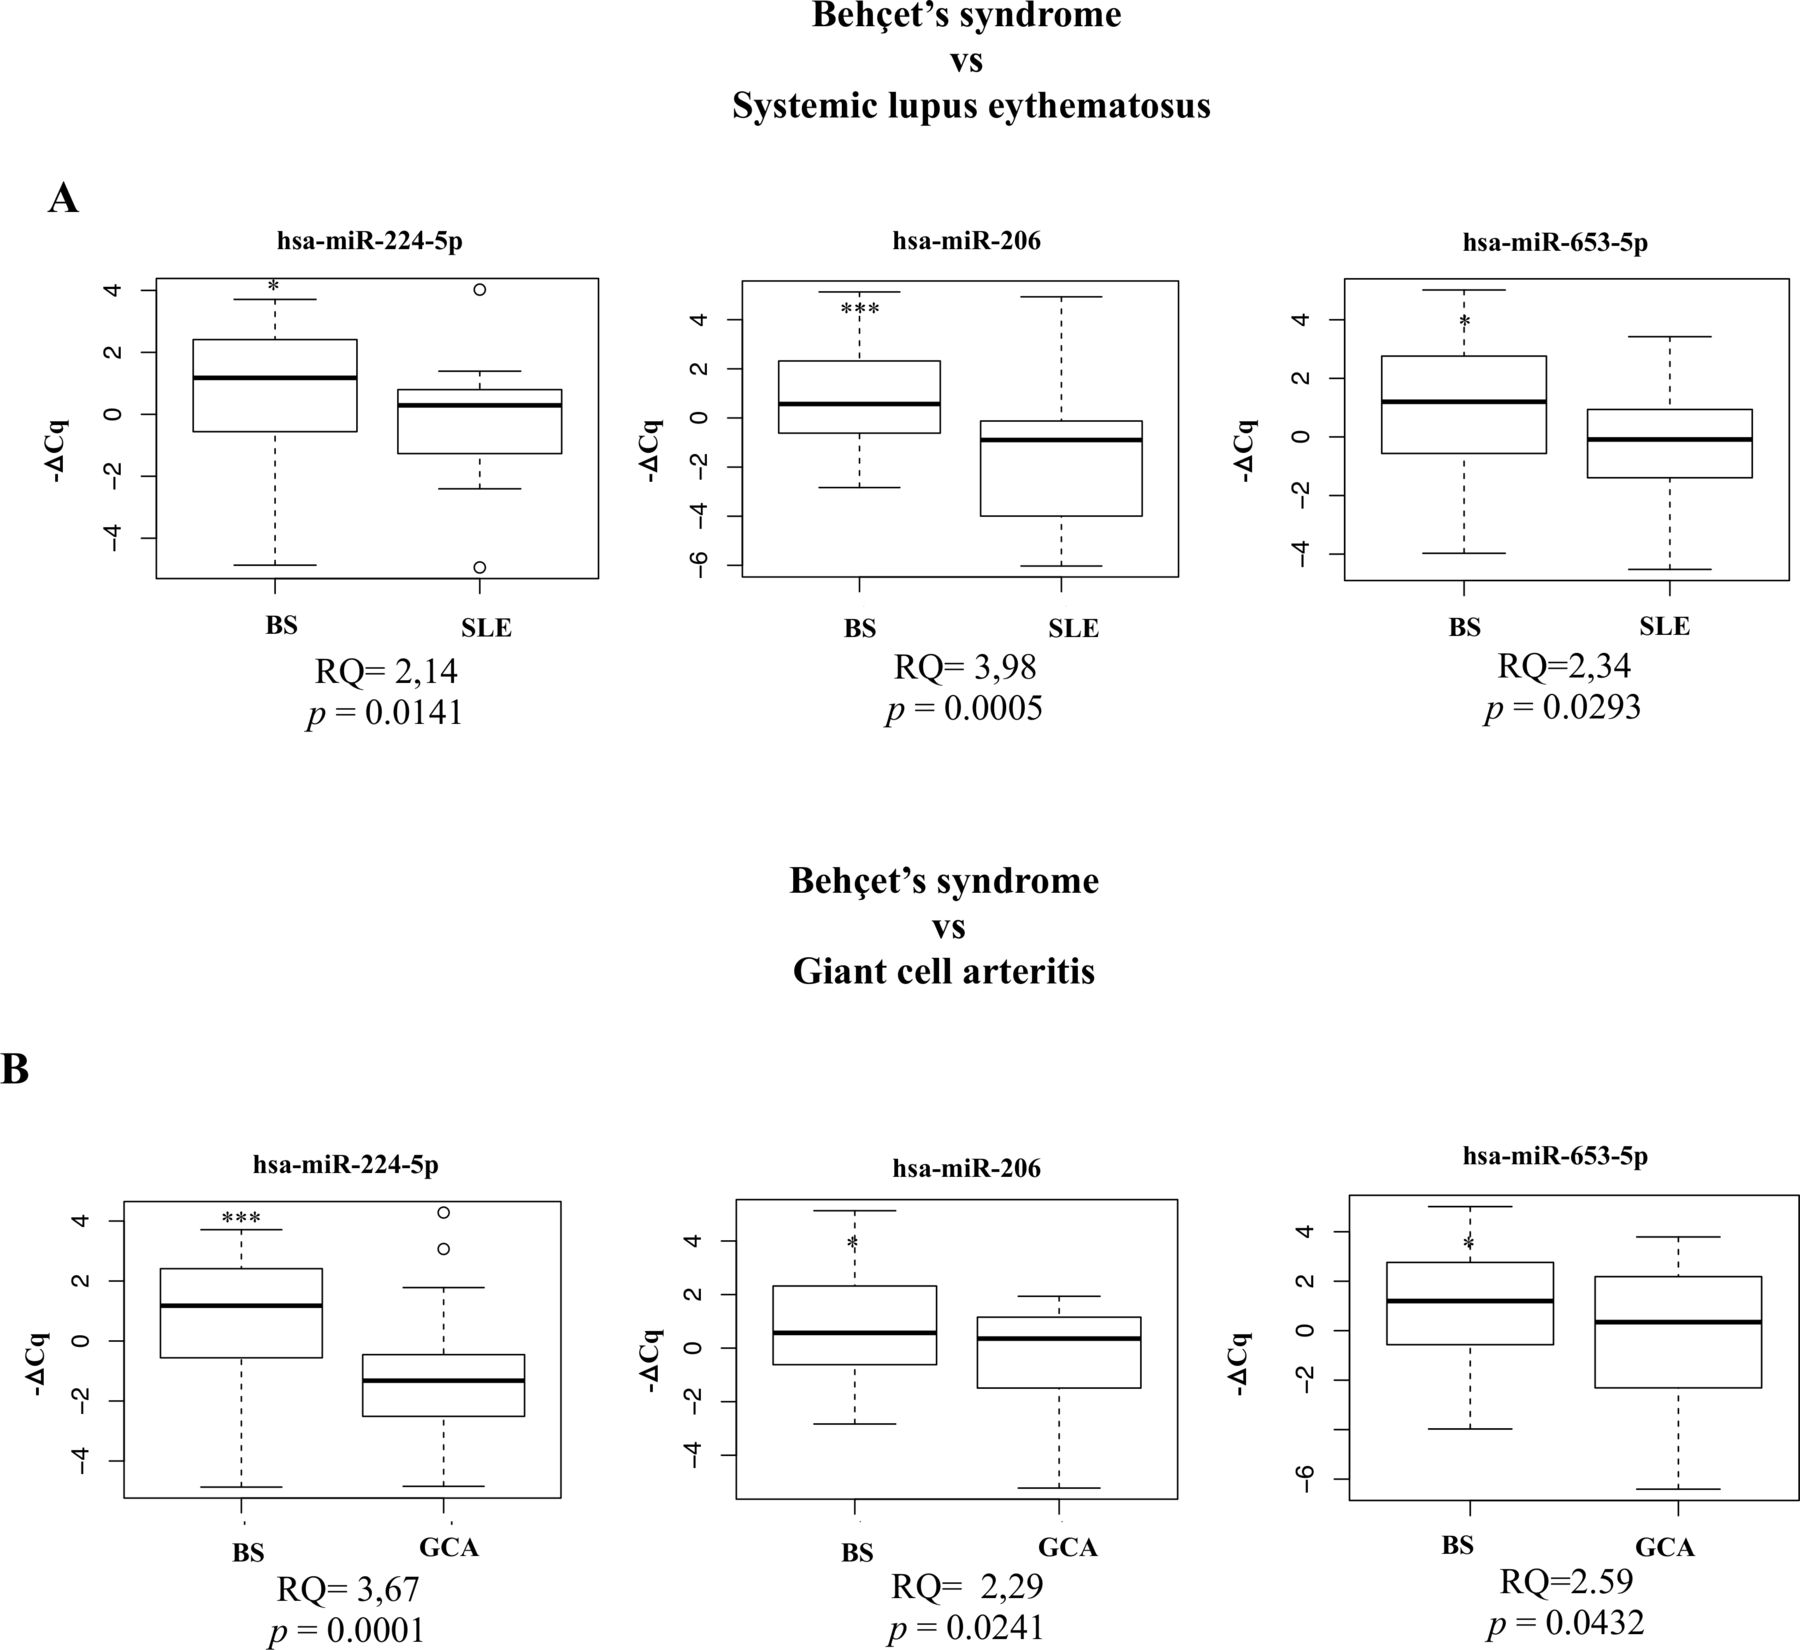
To further support the potential relevance of the identified ci-miRNA profile as potential disease biomarker, we also determined the expression levels of the three selected ci-miRNAs in two disease control groups. Figure 5A,B shows the results of the analysis of BS versus SLE and BS versus GCA, respectively: in any case, values of the relative quantification (RQ) were greater than 2, and the corresponding p values were statistically significant.

Selected miRNA expression in BS compared with disease control groups. (A, B). Selected circulating microRNAs (ci-miRNAs) poly(T) adaptor PCR (PTA-PCR) results in BS compared with disease control groups (SLE, GCA). hsa-miR-653-5p (BS vs SLE, RQ=2.35, p=0.02; BS vs GCA, RQ=2.59 p=0.04), hsa-miR-224-5p (BS vs SLE, RQ=2.14, p=0.01; BS vs GCA, RQ=3.67, p=0.0001) and hsa-miR-206 (BS vs SLE, RQ=3.98, p=0.0005; BS vs GCA, RQ=2.29, p=0.02) showed significant upregulation in BS when compared with both disease control groups. Box and whiskers plots (95% CI). BS, Behçet’s syndrome; Cq, threshold cycle; GCA, giant cell arteritis; RQ, relative quantification (ΔΔCq method); p, p value (Mann-Whitney test); SLE, systemic lupus erythematosus. n=60 (30 BS vs 30 SLE or 30 GCA).
This indicates that the three ci-miRNAs levels significantly differ between patients with BS and the two disease control groups. This conclusion was corroborated by the results of the combined ROC curve analysis (online supplemental figure 6A,B), which showed significant AUC values (AUC=0.81 for both disease control groups).
Comparison between both disease control groups and HC showed no significant deregulation in the expression of the three selected ci-miRNAs. Coherently, no valuable AUC value emerged from the combined ROC curve analysis of either SLE and GCA when compared with HC (online supplemental figure 7).
Finally, we also tested the ability of the identified three-ci-miRNA panel in discriminating patients with BS with active versus inactive disease state. The relative combined ROC curve analysis showed a significant AUC value of 0.71, with a specificity of 0.94 and a sensitivity of 0.42 (online supplemental figure 8).
The validated ci-miRNAs confirm their biological meaning potentially related to thrombo-inflammation: correlation with leucocyte ROS and plasma lipid peroxidation
The FAA performed on the three miRNAs hsa-miR-206, hsa-miR-224-5p and hsa-miR-653-5p revealed a significant enrichment in several of the pathways which also emerged from the comprehensive ci-miRNA profile emerging from the screening phase (figure 6A,B). Specifically, both GO and KEEG terms involved in thrombo-inflammation (‘blood coagulation’, ‘platelet activation’, ‘cellular nitrogen compound metabolic process’ and ‘ECM-receptor interaction’) as well as in native and adaptive immunity (‘TGF-beta signaling pathway’, ‘Hippo signaling pathway’ and ‘phosphatidylinositol signaling pathway’) showed the highest enrichment scores (figure 6A,B and online supplemental tables 5 and 6).

Selected miRNA functional annotation analysis (FAA) and correlation with intracellular and plasmatic oxidative stress markers. FAA was performed using the DIANA-miRPath v.3.0 (genes union mode, FDR-corrected p value threshold=0.05, microT threshold=0.07). (A) Top significantly enriched KEEG (Kyoto Encyclopedia of Genes and Genomes) terms. Bars corresponding to terms involved in cell–matrix interaction are shown in red, the ones related to innate and adaptive immunity are in black and white pattern. Highlighted KEEG terms: ‘ECM-receptor interaction’ (hsa04512) (p=2.97E-07), ‘gap junction’ (hsa04540) (p=1.45E-05), ‘Hippo signaling pathway’ (hsa04390) (p=0.0005), ‘cAMP signaling pathway’ (hsa04024) (p=0.0032), ‘focal adhesion’ (hsa04510) (p=0.0035), ‘TGF-beta signaling pathway’ (hsa04350) (p=0.0062), ‘phosphatidylinositol signaling pathway’ (hsa04070) (p=0.0318), ‘PI3K-Akt signaling pathway’ (hsa04151) (p=0.0422). (B) Top significantly enriched Gene Ontology (GO) BP terms. Bars corresponding to terms involved in cell–matrix interaction are shown in red, the ones related to innate and adaptive immunity are in black and white pattern, the ones related to blood coagulation are in green, while the ones linked to oxidative stress are in blue. Highlighted GO:BP terms: ‘cellular nitrogen compound metabolic process’ (GO:0034641) (p=2.73E-45), ‘cellular protein modification process’ (GO:0006464) (p=5.55E-25), ‘blood coagulation’ (GO:0007596) (p=2.023E-11), ‘cytoskeletal protein binding’ (GO:0008092) (p=8.44E-09), ‘platelets activation’ (GO:0030168) (p=1.04E-07), ‘phosphatidylinositol-mediated signaling pathway’ (GO:0048015) (p=2.24E-06), ‘Fc-gamma receptor signaling pathway involved in phagocytosis’ (GO:0038096) (p=1.80E-05), ‘platelets degranulation’ (GO:0002576) (p=0.0005), ‘innate immune response’ (GO:0045087) (p=0.0082), ‘activation of phospholipase C activity’ (GO:0007202) (p=0.0103), ‘cytoskeleton organization’ (GO:0007010) (p=0.0230). The larger -log10(p value) (enrichment score) indicates a smaller p value (p=FDR-corrected p value). Comprehensive significantly enriched KEEG and GO terms lists are reported in online supplemental tables 5 and 6, respectively. Validated circulating microRNA (ci-miRNA) expression level correlation with leucocytes’ oxidative stress levels and plasma lipid peroxidation: (C) neutrophil ROS; (D) lymphocyte ROS; (E) monocyte ROS; (F) plasma lipid peroxidation. BS, Behçet’s syndrome; Cq, threshold cycle; RFU, relative fluorescence units; ROS, reactive oxygen species; R, Pearson’s correlation coefficient: p, p value (Pearson’s correlation analysis). n=30 BS.
Furthermore, the expression levels of the three selected ci-miRNAs were compared with ROS levels in the main circulating leucocyte populations in patients with BS belonging to the validation cohort. Neutrophil ROS levels showed direct correlation with hsa-miR-224-5p (R2=0.1706, p=0.0233) (figure 6C). A significant direct correlation also emerged between lymphocyte ROS and upregulated hsa-miR-206 (R2=0.2039, p=0.0123) and hsa-miR-224-5p (R2=0.1712, p=0.0231) (figure 6D). In addition, monocyte ROS showed a significant direct correlation with hsa-miR-224-5p (R2=0.1620, p=0.0275) and hsa-miR-653-5p (R2=0.1412, p=0.0407) (figure 6E). Finally, plasma lipid peroxidation was directly correlated with hsa-miR-224-5p (R2=0.2544, p=0.0045) and hsa-miR-206 expression levels (R2=0.1853, p=0.0176) (figure 6F).
Overall, these findings suggest that the selected three ci-miRNA profiles which emerged from the validation phase of the study is potentially connected with the thrombo-inflammatory aspects uniquely associated with BS, further strengthening its role as candidate biomarker.
Discussion
The present study provides evidence that a peculiar profile of ci-miRNAs might serve to segregate patients affected by BS from HCs. Notably, the ci-miRNA profile we identified highlights the relevance of thrombo-inflammation in BS, hence suggesting an epigenetic regulation of thrombo-inflammatory mechanisms in the disease.
The DE ci-miRNA profile which first emerged from a microarray screening was clinically validated in a larger cohort by PCR. From the latter, the combination of three specific human ci-miRNAs (hsa-miR-224-5p, hsa-miR-206 and hsa-miR-653-5p) emerged, capable of segregating patients with BS from HC. Based on the specificity and sensitivity values derived from the combined ROC (CombiROC) curves, the above three ci-miRNAs might represent a supplemental diagnostic step following clinical evaluation. In other words, they might be exploited as a final tool to confirm a clinically based BS suspected diagnosis. The identified three ci-miRNA profiles were also able to discriminate patients with BS with active versus patients with BS with inactive disease. Finally, and more clinically relevant, the ci-miRNA profile could discriminate patients with BS from two disease control groups (SLE and GCA), further confirming its specificity for BS. Using the identified three ci-miRNAs in clinical practice would require additional testing with other control groups, such as isolated erythema nodosum, recurrent aphthous stomatitis, idiopathic uveitis and deep venous thrombosis. Nevertheless, the ci-miRNA profile emerging from our study paves the way to a valuable diagnostic support based on a novel biomarker, which is still strongly needed. Indeed, several potential biomarkers, either genetic or circulating have been described in BS, but none has effectively reached the clinical setting.34
In the last few years, specific miRNAs have been reported to be deregulated in peripheral blood mononuclear cells (PBMCs) from patients with BS compared with controls.20–24 Interestingly, none of the DE ci-miRNAs emerging from our analysis overlapped with those reported as differentially expressed in BS PBMCs, suggesting a more relevant involvement of endothelial cells and/or platelets in defining the plasmatic ci-miRNAs profile of patients with BS by active secretion. Notably, the FAA performed on the intracellular miRNA profile identified in BS PBMCs only partly covers the pathways that we identified in our study, with no emerging association with terms potentially linking thrombosis to inflammation.21
This potential origin acquires further strength from the functional analysis we performed, which indicated that the DE ci-miRNAs emerging from our study, besides being capable to discriminate patients from HC, contribute to highlight pathophysiological pathways underlying the disease, as expected by a disease biomarker.35
Indeed, both the bioinformatic analysis, focused on target genes of the DE ci-miRNAs, and the biochemical analysis on blood cells and plasma lipids identified molecular pathways potentially linked to BS pathogenesis. In particular, the FAA confirmed the undebated pathogenic role of native and adaptive immunity in BS,2 providing evidence that both TLRs and Treg-related pathways, in particular those converging on FOXP3 regulation,33 36–38 are deregulated in patients with BS. However, the most innovative finding emerging from our functional analyses indicated that most of the target genes of the DE ci-miRNAs are related to cellular and molecular processes underlying thrombo-inflammation. Notably, the latter is one of the main clinical aspects which characterises BS and strongly affects its morbidity and mortality.3 Our conclusion derived by the fact that the most enriched terms emerging from either KEEG or GO analyses on both microarray data and on the three validated ci-miRNAs, can be grouped into three main processes: cell–matrix interaction, oxidative stress and blood coagulation (figure 3). The first process is suggestive of tissue infiltration and interaction of blood cells with the lying endothelium, both signs of the inflammatory burden which characterises the perivascular milieu in BS and underlies its clinical features.2 The enriched pathway terms involved in oxidative stress processes are in agreement with recent evidence that an oxidative damage, produced, for example, by neutrophil activation,7 39 indeed occurs in BS. This evidence is further supported by our data showing a correlation of the three ci-miRNAs emerging from the validation phase (hsa-miR-206, hsa-miR-653-5p, hsa-miR-224-5p) with leucocyte ROS and plasma lipid peroxidation. Interestingly, such miRNAs directly or indirectly target those genes (collectively grouped in terms such ‘cellular nitrogen compound metabolic processes’ or ‘cellular protein modification process’), involved in antioxidant defenses, which hence contribute to cellular ROS accumulation.40–44 Both cell–matrix interaction and oxidative stress can be related to the extravascular tissue damage and endothelial dysfunction, which may contribute to the alterations of the thrombophilic profile characterising BS.6 45 46 This comprises, for example, oxidation-induced modifications of fibrinogen, which produces high resistance to fibrinolytic digestion.5 Hence, it is not surprising that the third process emerging from the FAA on microarray data as well as on the three ci-miRNAs emerging from the validation study (figures 3A,B and 6A,B, respectively) is related to blood coagulation. Genes related to the most relevant coagulation factors (tissue factor, factor IX, X and co-factor V) and coagulation inhibitors (serpins, tissue factor pathway inhibitor) are controlled by the ci-miRNAs emerging from our analysis, suggesting that these phenomena are potentially under epigenetic control.
Overall, the unique ci-miRNA profile described here can be considered a novel candidate biomarker in patients with BS and reinforces the hypothesis that BS represents a model of thrombo-inflammation.7 This may lead to uncover novel and still unexplored diagnostic and therapeutic strategies for the management of BS.
Data availability statement
Data are available in a public, open access repository. Data are available upon reasonable request. All data relevant to the study are included in the article or uploaded as supplementary information.
Ethics statements
Patient consent for publication
Ethics approval
This study was approved by the local ethical committee for Azienda Ospedaliero-Universitaria (AOU) Careggi in accordance with the 1975 Declaration of Helsinki ethical guidelines (protocol number CE 13972). A signed written informed consent was obtained from each participant enrolled in the study.
Acknowledgments
We would like to thank the entire team of the Behçet Center at the Careggi Hospital in Florence for allowing samples collection and the Center for the Study of Complex Dynamics (CSDC) (Sesto Fiorentino, Florence) for collaborating in statistical data analysis. We also thank Dr Salvatore De Masi and Dr Lorenzo Righi (Clinical trial Center-AOU Careggi, Florence, Italy) for their support in data analysis and study design. We would also like to thank all patients and healthy donors for their contribution to this study.
References
Supplementary materials
Supplementary Data
This web only file has been produced by the BMJ Publishing Group from an electronic file supplied by the author(s) and has not been edited for content.
Footnotes
GE and GB are joint first authors.
DP and AA are joint senior authors.
Handling editor Josef S Smolen
Contributors AA, DP, GE and LE provided concept and designed of the study. GB and EL performed microarray experiments and data acquisition. GB performed RT-qPCR experiments and data acquisition. GB, EL, AB and FDP performed microarray and RT-qPCR data analysis and interpretation. EL and GB performed plasma samples preparation. GE, ES, AB and MLU collected the samples and interpreted relative clinical data. FDP and AB performed data statistical analysis. CF and MB performed ROS measurement experiments and the relative data analysis. DP, AA and GE revised the results and gave final approval of the manuscript. AA served as overall content guarantor. All authors have read and approved the final manuscript. First authorship is shared by GE and GB as they contributed equally to this study. Senior authorship is shared by AA and DP.
Funding This work was partly supported by Associazione Italiana Sindrome e Malattia di Behçet (SIMBA onlus) (GE) and a grant by University of Florence (DP and AA, grant number: PRISCODRICATEN2015).
Competing interests None declared.
Patient and public involvement statement We provided patients with understandable information about the study at the time of informed consent signing. With the exception of clinical sample donation, patients were not involved in the study, since it revolves around basic and translational research.
Provenance and peer review Not commissioned; externally peer reviewed.
Supplemental material This content has been supplied by the author(s). It has not been vetted by BMJ Publishing Group Limited (BMJ) and may not have been peer-reviewed. Any opinions or recommendations discussed are solely those of the author(s) and are not endorsed by BMJ. BMJ disclaims all liability and responsibility arising from any reliance placed on the content. Where the content includes any translated material, BMJ does not warrant the accuracy and reliability of the translations (including but not limited to local regulations, clinical guidelines, terminology, drug names and drug dosages), and is not responsible for any error and/or omissions arising from translation and adaptation or otherwise.