Article Text

Abstract
Objective Alteration of the gut microbiome has been linked to the pathogenesis of systemic lupus erythematosus (SLE). However, a comprehensive view of the gut microbiome in SLE and its interaction with the host remains to be revealed. This study aimed to reveal SLE-associated changes in the gut microbiome and its interaction with the host by a comprehensive metagenome-wide association study (MWAS) followed by integrative analysis.
Methods We performed a MWAS of SLE based on shotgun sequencing of the gut microbial DNA from Japanese individuals (N case=47, N control=203). We integrated the result of the MWAS with the genome-wide association study (GWAS) data and plasma metabolite data.
Results Via species level phylogenetic analysis, we identified and validated increases of Streptococcus intermedius and Streptococcus anginosus in the patients with SLE. Microbial gene analysis revealed increases of Streptococcus-derived genes including one involved in redox reaction. Additionally, microbial pathways related to sulfur metabolism and flagella assembly were altered in the patients with SLE. We identified an overlap in the enriched biological pathways between the metagenome and the germline genome by comparing the result of the MWAS and the GWAS of SLE (ie, MWAS-GWAS interaction). α-diversity and β-diversity analyses provided evidence of dysbiosis in the metagenome of the patients with SLE. Microbiome-metabolome association analysis identified positive dosage correlation of acylcarnitine with Streptococcus intermedius, an SLE-associated taxon.
Conclusion Our MWAS followed by integrative analysis revealed SLE-associated changes in the gut microbiome and its interaction with the host, which contribute to our understanding of the relationship between the microbiome and SLE.
- lupus erythematosus
- systemic
- autoimmune diseases
- autoimmunity
Data availability statement
Data are available in a public, open access repository. Data are available on reasonable request. The whole-genome shotgun sequencing data are deposited in National Bioscience Database Center (NBDC) Human Database (http://humandbs.biosciencedbc.jp/) with the accession number of hum0197.
This is an open access article distributed in accordance with the Creative Commons Attribution Non Commercial (CC BY-NC 4.0) license, which permits others to distribute, remix, adapt, build upon this work non-commercially, and license their derivative works on different terms, provided the original work is properly cited, appropriate credit is given, any changes made indicated, and the use is non-commercial. See: http://creativecommons.org/licenses/by-nc/4.0/.
Statistics from Altmetric.com
Key messages
What is already known about this subject?
Alteration of the gut microbiome has been linked to the pathogenesis of systemic lupus erythematosus (SLE), but a comprehensive view of the gut microbiome in SLE and its interaction with the host remains to be revealed.
Whole metagenome shotgun sequencing technology has many advantages over conventional 16S ribosomal RNA sequencing such as higher taxonomic resolution and applicability for the functional analysis. However, evaluation of the microbiome-disease association based on shotgun sequencing is still incomplete for SLE.
What does this study add?
Our shotgun sequence-based metagenome-wide association study (MWAS) newly identified two bacterial species (Streptococcus anginosus and Streptococcus intermedius), eight bacterial genes and seven biological pathways which were significantly different between the healthy controls and the patients with SLE.
Integrative analysis with the genome-wide association study (GWAS) result and the plasma metabolite data revealed the interactions between the gut microbiome and the host mediated by biological pathways or plasma metabolites.
How might this impact on clinical practice or future developments?
Our shotgun sequencing-based MWAS and integrative analysis with the GWAS data and plasma metabolite profiles revealed an SLE-specific microbial landscape and its association with the host. Our analysis contributes to our understanding of the relationship between the gut microbiome and SLE.
Introduction
Systemic lupus erythematosus (SLE) is an autoimmune disease, which is characterised by overactivation of the immune system and involvement of various organs such as kidney and brain. Despite advances in treatment, standardised mortality rates in patients with SLE were three times higher than in the general populations because of poor control of the disease activity or infection due to immunosuppressive treatment.1 SLE results from a complex interplay of multiple genetic and environmental factors; however, much of the aetiology of SLE remain to be elucidated. Therefore, extensive efforts have been spent to reveal the pathogenesis of SLE for the development of better clinical care.
Microbiome, which refers to the microbial communities inhabiting the human body, has a remarkable effect on our body by modulating our immune system or taking a part of our metabolic network.2 The largest community of the human microbiota resides within the gut. Involvement of the gut microbiome is reported for various diseases, such as type 2 diabetes,3 colorectal cancer,4 rheumatoid arthritis (RA),5 6 inflammatory bowel disease (IBD)7, and multiple sclerosis.8 Accompanied by the great progresses in high-throughput sequencing technology and success of the treatment such as faecal microbiome transplantation and probiotics, characterisation of the gut microbiome has become a major research area in human diseases.
Recently, relationship between the gut microbiome and SLE was studied to reveal an unexplained part of the SLE aetiology. Faecal microbiome from an SLE model mouse has capacity to induce SLE-like phenotype in a healthy mouse underlying the non-trivial relationship between the gut microbiome and the SLE pathogenesis.9 Mechanistic insights of association between the gut microbiome and SLE have been obtained by mouse experiments (e.g, activation of the immune system caused by bacterial translocation from gut to liver10 or microbe derived metabolites11). In human, SLE-associated taxa were searched through amplicon sequencing of 16S ribosomal RNA (rRNA) genes.12–16 Although the findings were not universally consistent, reflecting difference in ethnicities and lifestyles, several SLE-associated clades were identified. However, 16S rRNA sequencing typically provides phylogenetic abundance at up to the genus level, making it suffer from low taxonomic resolution. In addition, 16S rRNA sequencing technology can only be used for phylogenetic analysis; thus, functional aspect of disease-specific microbial environment is overlooked.
In gut microbiome case-control study, metagenome-wide association studies (MWAS) based on whole-genome shotgun sequencing are replacing case-control comparison with 16S rRNA sequencing technology. Shotgun sequencing has a potential to detect the genomic composition of microbes at the species level, achieving higher taxonomic resolution than 16S rRNA sequencing technology. Furthermore, shotgun sequencing can be used for analysing microbial gene and pathway and is therefore useful for surveying the functional aspect of microbial environment. However, shotgun sequencing requires much larger sequencing cost and machine resource than 16S rRNA-sequencing. Additionally, analytic methods applied to shotgun sequencing data are usually complicated. For these reasons, evaluation of microbiome-disease association based on shotgun sequencing is still incomplete for many diseases including SLE.17 Furthermore, insufficient number of shotgun sequencing studies in non-European population is problematic given the significant impact of ethnicity and lifestyle on the microbial landscape.18 19
Even with shotgun sequencing analysis, microbiome-host interaction is hardly evaluated unless performing integrative analysis with other modality data such as metabolic profiles. A large part of microbiome-host interaction is estimated to be mediated by metabolic signals.2 Multiomics analysis based on microbial and metabolic data was performed in not many but several diseases such as IBD7 and has revealed the involvement of metabolites in microbiome-disease association. Integrative analysis with the genome-wide association study (GWAS) is also useful for revealing a link between the gut microbiome and the host genome, namely MWAS-GWAS interaction.5 Nonetheless, microbiome-host interaction in SLE has been never evaluated, hindering us from the comprehensive understanding of the microbiome-associated SLE pathology.
In this study, we carried out shotgun sequencing of faecal samples from 250 Japanese subjects, composed of 47 patients with SLE and 203 healthy controls (HCs). To identify SLE-associated microbes, we performed phylogenetic case-control comparison. We also performed microbial gene analysis followed by pathway analysis for revealing functional differences of the gut metagenome between the HCs and the patients with SLE. To reveal the microbiome-host interaction in SLE, we performed a combined biological pathway analysis of MWAS and GWAS. In addition, we performed an integrative analysis using plasma metabolite profiles obtained through the non-targeted metabolomics approach. The joint study of microbiome and metabolome can identify the functional readouts of disease-specific microbial activity which mediates the microbe-host interaction.
Results
High abundance of Streptococcus anginosus and Streptococcus intermedius in the SLE gut microbiome
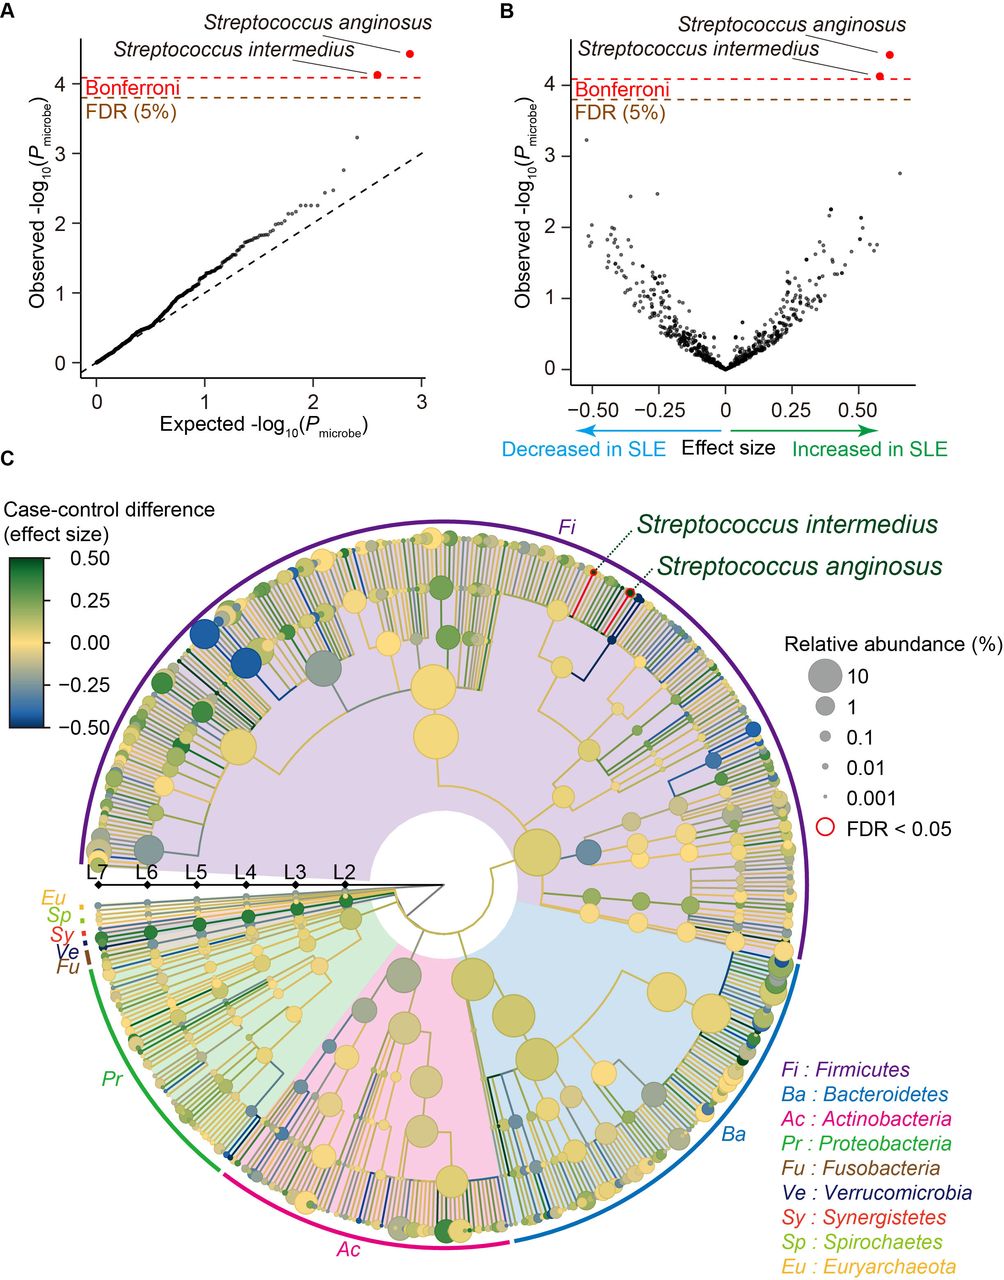
We performed whole-genome shotgun sequencing analysis of a total of 250 faecal DNA samples (47 individuals with SLE and 203 HC subjects) derived from three sequencing groups (online supplemental table 1), which passed stringent quality control (QC) for sequence reads and samples. Procedures of sample QC and definition of the sample sets in each analysis are described in online supplemental figure 1. Then, we obtained phylogenetic relative abundances (online supplemental figure 3). For case-control comparison, we performed clade QC. After clade QC, we had 774 clades for case-control association test, including 12 phyla (L2), 25 classes (L3), 36 orders (L4), 72 families (L5), 178 genera (L6) and 451 species (L7).
We performed case-control comparison for each clade and identified that Streptococcus anginosus and Streptococcus intermedius significantly increased in SLE (effect size=0.617 and P microbe=3.7×10⁻⁵ for Streptococcus anginosus, effect size=0.579 and P microbe=7.5×10⁻⁵ for Streptococcus intermedius; figure 1A,B and table 1), satisfying an empirically estimated Bonferroni threshold (α=0.05; P microbe <8.2×10⁻⁵). As illustrated in a phylogenetic tree indicating the case-control association results of multilayered taxonomic levels (figure 1C), both of the clades with case-control discrepancy were species (L7) level. Since it was difficult to detect the species-level clades using classical 16S rRNA sequencing, our results underlay the strength of MWAS approach with shotgun sequencing to identify disease-associated microbial taxa.

Result of the SLE MWAS based on the phylogenetic abundance data. (A) A quantile-quantile plot of the phylogenetic MWAS p values (P microbe) of the clades. The x-axis indicates log-transformed empirically estimated median P microbe. The y-axis indicates observed −log10(P microbe). The diagonal dashed line represents y=x, which corresponds to the null hypothesis. The horizontal red line indicates the empirical Bonferroni-corrected threshold (α=0.05), and the brown line indicates the empirically estimated FDR threshold (FDR=0.05). Clades with P microbe less than the Bonferroni thresholds are plotted as red dots, and other clades are plotted as black dots. (B) A volcano plot. The x-axis indicates effect sizes in linear regression. The y-axis, horizontal lines and dot colours are the same as in (A). (C) A phylogenetic tree. Levels L2–L7 are from the inside layer to the outside layer. The size and the colour of dots represent relative abundances and effect sizes, respectively. The two clades with significant case-control associations (FDR<0.05) are outlined in red. FDR, false discovery ratio; MWAS, metagenome-wide association study; SLE, systemic lupus erythematosus.
Clades with significant case-control discrepancy in the SLE MWAS
As medication of the patients with SLE and male-female imbalance due to sex biased prevalence could be a confounding factor, we performed subanalysis (online supplemental table 2). Effect sizes were almost similar among subanalyses for the Streptococcus anginosus and Streptococcus intermedius (0.487≤effect size≤0.647 for Streptococcus anginosus, 0.463≤effect size≤0.654 for Streptococcus intermedius (online supplemental figure 4 and table 2) after removing male subjects or those who took medications such as proton pump inhibitor, antibiotics or therapeutics for SLE. These results suggested that inclusion of the male subjects or those who took medications such as proton pump inhibitor, antibiotics or therapeutics minimally confounded the result but increased statistical power of the MWAS. The abundance of these two clades was not significantly different between the newly onset patients and the other patients, the patients with lupus nephritis (LN) and without LN or the patients with high SLE Disease Activity Index (SLE-DAI) and low SLE-DAI (P microbe >0.12; online supplemental table 2). We performed replication analysis for Streptococcus anginosus and Streptococcus intermedius by using a previously published shotgun sequencing study.17 Association of Streptococcus anginosus and Streptococcus intermedius was significantly replicated (same effect direction and P microbe <0.05/2=0.025), confirming the associations identified by our SLE MWAS.
High abundance of Streptococcus-derived genes in the gut metagenome of patients with SLE
We next performed a gene level MWAS. We obtained microbial gene abundance data based on Kyoto Encyclopedia of Genes and Genomes (KEGG) database.20 After gene level QC, we retained 240,544 genes for case-control comparison. We performed case-control comparison for each gene and identified eight genes which significantly increased in SLE (empirically estimated false discovery ratio (FDR)=0.05; figure 2A,B, table 2). As conducted in the phylogenetic analysis, we performed subanalysis (online supplemental table 3). For the eight-genes increased in SLE, effect sizes were almost similar among subanalyses (online supplemental figure 5). These results suggested that inclusion of the male subjects or those who took medications such as proton pump inhibitor, antibiotics or therapeutics did not confound the result. The abundance of these eight genes was not significantly different between the newly onset patients and the other patients, the patients with LN and without LN or the patients with high SLE-DAI and low SLE-DAI (online supplemental table 3).

Result of the SLE MWAS based on the microbial gene abundance data. (A) A quantile-quantile plot of the MWAS p values of the genes (P KEGG). The x-axis indicates log-transformed empirically estimated median P KEGG. The y-axis indicates observed −log10(P KEGG). The diagonal dashed line represents y=x, which corresponds to the null hypothesis. The horizontal red line indicates the empirical Bonferroni-corrected threshold (α=0.05), and the brown line indicates the empirically estimated FDR threshold (FDR=0.05). Genes with P KEGG less than the Bonferroni thresholds are plotted as red dots. Genes with FDR<0.05 are plotted as brown dots, and other clades are plotted as black dots. (B) A volcano plot. The x-axis indicates effect sizes in linear regression. The y-axis, horizontal lines and dot colours are the same as in (A). FDR, false discovery ratio; KEGG, Kyoto Encyclopedia of Genes and Genomes; MWAS, metagenome-wide association study; SLE, Systemic lupus erythematosus.
Genes with significant case-control discrepancy in the SLE MWAS.
All of these eight genes were registered as Streptococcus parasanguinis ATCC 15912 or Streptococcus parasanguinis FW213 derived. In our metagenome data, although major derivation of these genes were Streptococcus parasanguinis, reference genomes of other Streptococcus such as Streptococcus sanguinis or unclassified Streptococcus were linked to these genes. Streptococcus parasanguinis was not significantly increased in the gut metagenome of the patients with SLE in our phylogenetic analysis (effect size=0.122, P microbe=0.35), indicating the possibility of collective enrichment of the multiple species of Streptococcus which had the several genes in common or difference in the composition of genes among Streptococcus parasanguinis strains. Among the eight genes which significantly increased in the patients with SLE, Spaf_0732 was a glutaredoxin-like protein. Some glutaredoxin-like protein was involved in reactive oxygen metabolism.21 As previously described, gut redox environment has substantial effect on the host’s immune system,22 and its alteration in the gut microbiome of autoimmune diseases such as RA was reported.5 6
Identification of metagenomic biological pathways altered in the patients with SLE
Using the result of the gene level MWAS, we performed a gene set enrichment analysis to evaluate the case-control discrepancy of the gut metagenome at pathway level. We evaluated 126 QC-passed pathways registered in KEGG database. We found that genes differentially abundant between case and control were significantly enriched on seven pathways (FDR<0.05; figure 3A,B, online supplemental table 4). One of the significant pathways was sulfur metabolism and sulfur was associated with redox reaction,6 suggesting that altered redox reaction was associated with the pathology of SLE. Enrichment of flagellar assembly might result from bacteria-host interaction mediated by strong immune reaction to bacterial flagellar.23

MWAS results of the SLE case-control pathway association tests. (A) A quantile-quantile plot of the MWAS p values of pathways based on KEGG pathways (P pathway). The x-axis indicates log-transformed empirically estimated median P pathway. The y-axis indicates observed −log10(P pathway). The diagonal dashed line represents y=x, which corresponds to the null hypothesis. The horizontal red dashed line indicates the Bonferroni-corrected threshold (α=0.05), and the brown dashed line indicates the FDR threshold (FDR=0.05) calculated with Benjamini-Hochberg method. Pathways with p values less than the Bonferroni thresholds are plotted as red dots. Pathways with FDR<0.05 are plotted as brown dots, and other pathways are plotted as black dots. (B) System diagram of KEGG pathways. The three levels are defined as A, B and C and described from the inside layer out. The size and the colour of dots represent set sizes and P pathway, respectively. The seven pathways with significant enrichment (FDR<0.05) are outlined in red. (C) Comparison of P pathway between the SLE MWAS and GWAS data. The x-axis indicates the P pathway of the GWAS data (left, SLE GWAS; right, RA GWAS). The y-axis indicates the P pathway of the SLE MWAS. The horizontal and vertical black lines indicate P pathway of 0.05. The overlap of the pathway enrichment was evaluated by classifying the pathways based on the significance threshold of P pathway<0.05 or P pathway≥0.05 and using Fisher’s exact test. FDR, false discovery rate; GWAS, genome-wide association study; KEGG, Kyoto Encyclopedia of Genes and Genomes; MWAS, metagenome-wide association study; RA, rheumatoid arthritis; SLE, systemic lupus erythematosus.
SLE-specific biological pathways shared between metagenome and human genome
We integrated the result of the current SLE MWAS data and the previously published SLE GWAS data (4,943 cases and 8,483 controls)24 for assessing the sharing of biological pathways between the gut microbiome and the host. We used PASCAL25 for pathway analysis of the GWAS summary statistics. A total of 94 pathways registered in KEGG database were commonly evaluated for MWAS and GWAS. We compared the p values of the each KEGG pathway (P pathway) between the SLE MWAS and the SLE GWAS. We found a significant overlap between the pathways enriched both in the SLE MWAS (P pathway for metagenome <0.05) and in the SLE GWAS (P pathway for SLE GWAS<0.05; P Fisher=0.041; figure 3C). To check whether the overlap of the enriched pathways between the metagenome and the host genome truly reflected the SLE-specific changes in the biological pathways, we performed the same experiment with the SLE MWAS data and RA GWAS data (14,361 cases and 43,923 controls).26 When using the RA GWAS data, the overlap of the enriched pathways between the metagenome and the host genome was not significant (P Fisher=0.73; figure 3C). Therefore, our results suggested that there was a commonality in the enriched biological pathways between human genome and metagenome in SLE, namely MWAS-GWAS interaction.
Dysbiosis in the gut microbiome of the patients with SLE
Dysbiosis refers to an unbalanced microbiota, which is usually harmful for us. Decrease in the α-diversity (ie, within individual diversity) of microbiome was one of the most constant findings of the gut dysbiosis27 and reported in many disease conditions including IBD.28 As for SLE, decrease in α-diversity of the gut microbiome was still controversial.12–17 Therefore, we performed case-control comparison of α-diversity in the phylogenetic data (L2–L7) and the gene abundance data based on KEGG database. Significant decreases of α-diversity in the low taxonomic level phylogenetic data (L5–L7; P α-diversity<0.05/6=0.0083) and the gene abundance data were observed (P α-diversity=7.9×10⁻⁵; figure 4A,B, online supplemental tables 5 and 6). In subanalysis, significant decreases of α-diversity in the phylogenetic data at L5 and L6 levels and the gene abundance data were still observed (P α-diversity<0.05/6=0.0083 for phylogenetic data and P α-diversity<0.05 for gene abundance data; online supplemental tables 5 and 6). Although decrease of α-diversity in the phylogenetic data at L7 level was not significant when removing patients with antibiotics usage (P α-diversity=0.052), direction of the effect size was consistent. Microbial α-diversity was not significantly different between the newly onset patients and the other patients, the patients with and without LN or the patients with high SLE-DAI and low SLE-DAI (P α-diversity > 0.05/6 in phylogenetic analysis and P α-diversity >0.05 in functional analysis; online supplemental tables 5 and 6).

Case-control comparison of the microbial diversities in SLE. (A) α-diversities of the phylogenetic relative abundance data for the six taxonomic levels. Blue and green dots represent the median Shannon index of the HC and SLE subjects. Upper and lower dashed lines indicate the first and third quantile of Shannon index for the HC and SLE subjects. (B) α-diversities of the gene abundance based on KEGG gene databases. Boxplots indicate the median values (centre lines) and the IQRs (box edges), with whiskers extending to the most extreme points within the range between (lower quantile − [1.5×IQR]) and (upper quantile + [1.5×IQR]). (C) β-diversities of the phylogenetic relative abundance data at the species level. Result of NMDS based on Bray-Curtis distance is represented. Blue and green dots represent the HC and SLE subjects. (D) β-diversities of the gene abundance based on KEGG gene database. Result of NMDS based on Bray-Curtis distance is represented. Blue and green dots represent the HC and SLE subjects. *P α-diversity<0.05; **P α-diversity<0.0083. HC, healthy control; KEGG, Kyoto Encyclopedia of Genes and Genomes; NMDS, non-metric multidimensional scaling; SLE, systemic lupus erythematosus.
Next, we performed a β-diversity analysis for checking whether SLE affected the overall microbial composition or not. We performed PERMANOVA,29 based on Bray-Curtis distance calculated from the phylogenetic data (L2–L7) and the gene abundance data. Significant differences were detected in the phylogenetic data (L2–L7) and the gene abundance data with consistency in subanalysis (P β-diversity<0.05/6=0.0083 for phylogenetic data and P β-diversity<0.05 for gene abundance data; figure 4C,D, online supplemental figure 6, tables 7 and 8). There was no significant difference in the overall microbial composition between the newly onset patients and the other patients, the patients with and without LN or the patients with high SLE-DAI and low SLE-DAI (P β-diversity>0.05/6 in phylogenetic analysis and P β-diversity>0.05 in functional analysis; online supplemental tables 7 and 8). Collectively, diversity analysis provided evidence of the dysbiosis observed in the gut microbiome of the patients with SLE.
Association between plasma metabolite and the gut microbiome of the patients with SLE
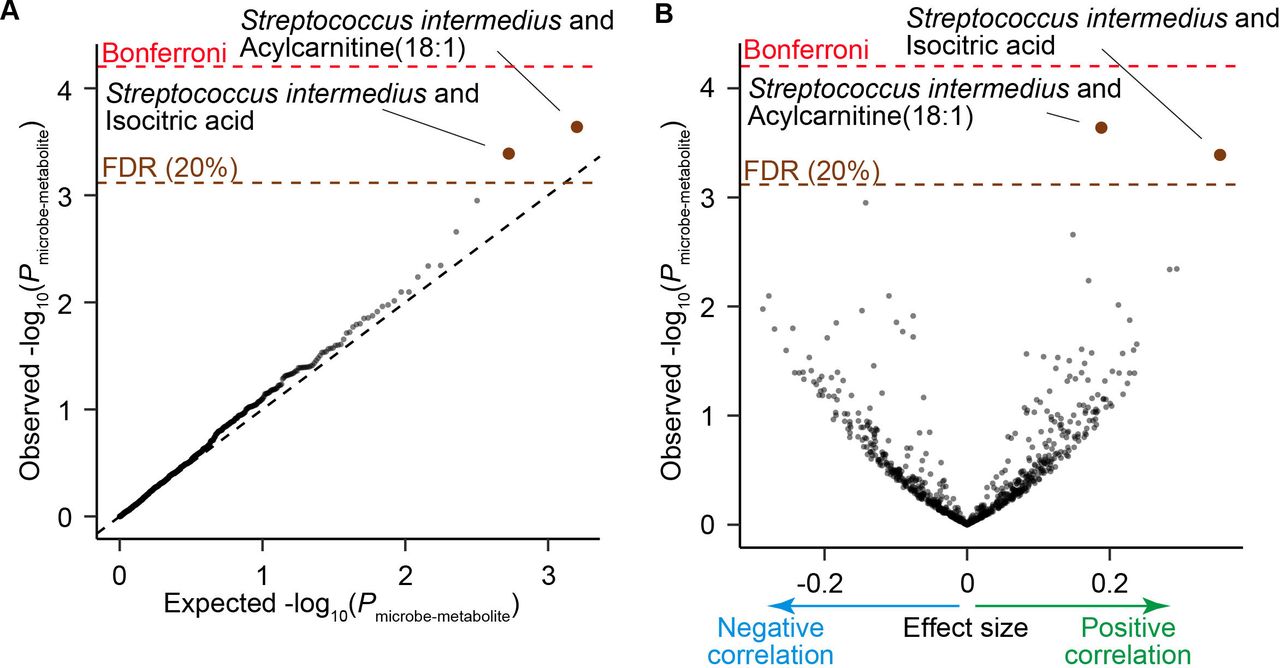
Gut microbiome can affect our body by changing the profiles of circulating metabolites.30–32 To assess the association between the SLE-associated taxa and plasma metabolites, we integrated the phylogenetic data and plasma metabolite profiles which were previously obtained from a part of the participants of this study.33 As the focus of this analysis is not the case-control discrepancy but the microbe-metabolite association, we combined 94 HC subjects and 9 patients with SLE, which resulted in 103 participants. Abundance of the two metabolites, acylcarnitine(18:1) and isocitric acid were significantly positively correlated with the abundance of Streptococcus intermedius (P microbe-metabolite <4.1×10⁻⁴; FDR<0.20; figure 5A,B, table 3). We performed a replication analysis using another dataset composed of 75 HC subjects.8 Positive correlation between acylcarnitine(18:1) and Streptococcus intermedius was successfully replicated (P microbe-metabolite=0.0080). Acylcarnitine is formed by carnitine and acyl-coenzyme A (CoAs) derived from fatty acids. Acylcarnitine was reported to be one of the main components of faecal bacteria-metabolite network and associated with the numerous dysbiosis associated species.7 Acylcarnitine can work as an inflammatory signal,34 suggesting that the gut microbiome of the patients with SLE is associated with the overactivation of the immune system in SLE via acylcarnitine.
Result of the microbe-metabolite association analysis. (A) A quantile-quantile plot of the p values from the microbe-metabolite association analysis (P microbe-metabolite). The x-axis indicates log-transformed empirically estimated median P microbe-metabolite. The y-axis indicates observed -log10(P microbe-metabolite). The diagonal dashed line represents y=x, which corresponds to the null hypothesis. The horizontal red dashed line indicates the Bonferroni-corrected threshold (α=0.05), and the brown dashed line indicates the FDR threshold (FDR=0.20) calculated with Benjamini-Hochberg method. The microbe-metabolite pairs with FDR<0.20 are plotted as brown dots, and the other microbe-metabolite pairs are plotted as black dots. (B) A volcano plot. The x-axis indicates effect sizes in linear regression. The y-axis, horizontal dashed lines and dot colours are the same as in (A). FDR, false discovery rate; HC, healthy control; SLE, systemic lupus erythematosus.
Microbe-metabolite pairs with significant association
Discussion
In this study, we conducted a MWAS of Japanese patients with SLE using whole-genome shotgun sequencing. Our study revealed following biological features associated with the SLE gut metagenome (online supplemental figure 7): (1) Streptococcus anginosus and Streptococcus intermedius were increased in the SLE metagenome; (2) eight genes derived from Streptococcus including a gene related to redox reaction increased in the SLE metagenome; (3) various biological pathways, including those related to sulfur metabolism and flagella assembly were enriched among genes differentially abundant between case and control; (4) there existed an SLE-specific link between biological pathway of the gut microbiome and the host genome, namely MWAS-GWAS interaction; (5) the features of dysbiosis, decreases in α-diversity and changes in the overall composition of the gut microbiome, were observed among the patients with SLE; (6) plasma acylcarnitine(18:1) level was positively associated with the abundance of Streptococcus intermedius.
One of the principal findings of our study was increase of Streptococcus anginosus and Streptococcus intermedius in the SLE metagenome. Because it was difficult to detect these species level clades using classical 16S rRNA sequence analysis, these results demonstrate the value of metagenome shotgun sequencing in identifying disease-associated taxa. Considering the clinical features of SLE such as female-biased prevalence and frequent prophylactic antibiotics usage before renal biopsy or during immunosuppressive treatment, we evaluate the effect of these factors on the result of MWAS. Although the findings of the MWAS were often not replicated across studies due to the difference in ethnicity and lifestyle, our results were validated in the independent SLE metagenome dataset from the Chinese cohort,17 suggesting that our statistical analysis robustly identified the taxa specifically abundant in the SLE metagenome. Streptococcus anginosus and Streptococcus intermedius belong to Streptococcus anginosus group and are parts of normal flora of the oral cavity and gastrointestinal tracts. Involvement of oral-gut interaction mediated by microbes was reported in several diseases,5 35 suggesting the possibility of association between the oral-gut axis and the SLE pathology. Liu et al reported that Streptococcus intermedius produced and secreted a histone-like DNA binding protein, which induced proinflammatory cytokine production of macrophage derived cell line.36 Therefore, interaction between Streptococcus intermedius and the host immune system could be related to the pathology of SLE.
Although the Streptococcus anginosus and Streptococcus intermedius consistently increased in the existing two shotgun sequencing studies (Chen et al 17 and our study), some previous findings in Chen et al were not replicated in this study. Although Chen et al reported that Ruminococcus gnavus increased in the patients with SLE, especially those with LN, it did not increase in our study (effect size=−0.001, SE=0.155, P microbe=1.00 in case-control comparison and effect size=0.195, SE=0.355, P microbe=0.59 in comparison between patients with SLE with LN or without LN). Additionally, among the 74 species which increased in Chen et al and evaluated in our study, two species, Streptococcus anginosus and Streptococcus intermedius, were replicated with P microbe <0.05/74=6.8×10−4. Among the 74 species, 38 species have the same directional effects between the studies. This heterogeneity might reflect the effects of geography and lifestyle on the gut microbiome, while differences in the analytic methods could not be rejected. Thus, further studies in the different countries or global meta-analysis will be warranted to further clarify the difference in the gut microbiome of the patients with SLE among different countries.
Our gene analysis revealed that eight genes including a glutaredoxin-like protein gene were increased in the SLE gut metagenome. Since all of these genes were derived from Streptococcus, there might be a possibility that some of these genes were enriched simply because of coabundance with Streptococcus genes truly relevant to the SLE condition. Further functional validation of each gene would be warranted. Subsequent pathway analysis based on the result of the gene analysis revealed an alteration of various biological pathways including sulfur metabolism and flagella assembly. Sulfur metabolism is reported to be altered in the metagenomes of other diseases such as RA,6 and it is related to redox environment. Together with the result of the gene level analysis, our results suggested that alteration of redox environment was associated with the pathology of SLE. Flagellar is known to elicit strong immune response. Zeevi et al reported that gut bacteria which had structural variant in flagellar protein had higher growth ratio, implying the loss-of-function adaptation to the host’s immune system.23 There was an interaction between the gut bacteria and the immune system via flagellar, and the alteration of flagellar-related pathways in the SLE gut metagenome could be associated with changes in the host’s immune system. Through the MWAS-GWAS integrative analysis, we showed that there was a biological pathway level commonality between the host genome and the metagenome in among the patients with SLE. Although biological pathway level commonality between host genome and metagenome was evaluated in other autoimmune diseases,5 8 disease specificity of the commonality had not been evaluated. In this study, we showed that there was no pathway level commonality between the result of the SLE MWAS and the RA GWAS. Pathway level microbe-host interaction detected from the SLE MWAS and the SLE GWAS should reflect an SLE-specific disease mechanism.
Decrease in α-diversity of the gut microbiome, which is one of the major characteristics of dysbiosis, in patients with SLE had been controversial; some reported significant decreases in α-diversity in the SLE gut microbiome,13 14 17 and others showed no differences.12 15 16 This might be due to the difference in study design, such as sample number, country, medication and treatment of the patients with SLE. In our analysis, α-diversity of the gut microbiome in the patients with SLE significantly decreased. Additionally, we certified the robustness of our result by subanalysis. Diversity of the gut microbiome is considered as important for the homeostasis of the host’s immune system, and decrease in α-diversity is reported in autoimmune diseases such as type 1 diabetes and IBD.27 Observed decrease of α-diversity in the gut microbiome of SLE could be associated with abnormal activation of the immune system in the patients with SLE. Through β-diversity analysis, we found that SLE condition significantly affected the overall microbial composition. As recently suggested by Ma et al,37 heterogeneity of the human microbiome among individuals tended to increase in the disease condition (Anna Karenina principle; AKP), and there is a possibility that AKP is also applicable to the case of SLE.
In this study, we identified a positive correlation between Streptococcus intermedius and acylcarnitine(18:1) followed by replication in another dataset. Acylcarnitine is known to form complex network with various microbes,7 association between Streptococcus intermedius and acylcarnitine(18:1) could be mediated by both direct interaction and indirect interaction mediated by other microbes. Rutkowsky et al reported that acylcarnitine induced inflammation in macrophage derived cell line by cyclooxygenase-2 dependent manner.34 Our microbe-metabolome association analysis revealed a functional readout from the SLE gut microbiome, which could be associated with the pathology of SLE. Further analysis including case-control comparison with greater number of cases and in vivo validation would be warranted.
Our SLE MWAS had a few limitations. First, our study had only a moderate sample size compared with other studies on more common diseases such as colorectal cancer38 39 and type 2 diabetes3 due to the relatively rare prevalence of SLE. Although we robustly detected SLE-associated taxa and genes, there may exist other taxa and genes with smaller effect size. Thus, future large-scale studies such as cross-cohort meta-analysis are needed to detect the evidence of such weaker associations (online supplemental figure 8), where our study will contribute. Second, some of the patients in out cohort were under treatment or antibiotics, which could be potential confounding factors. However, the stable consistency of the effect sizes among the subanalyses indicated that these factors might not confound the result of the MWAS. Replication by independent cohort further supported the robustness of the result. Third, it is still challenging to reveal mechanistic insights into disease biology from MWAS. Pathway and bacteria-metabolite analysis in our study provided potential causal mechanisms as well as those suggested previously.9–11 40 However, biological overview is still elusive due to the low throughput of mice experiment and technical and ethical difficulty in intervention to the human subjects. Future studies involving the latest technologies such as organoids and organs-on-chips technology,41 would be promising for studying the mechanistic insights into the relationship between the gut microbiome and SLE.
In conclusion, our shotgun sequencing-based MWAS and integrative analysis with GWAS and plasma metabolite profiles revealed the altered gut microbiome in SLE and its association with the host. Our analysis contributes to the understanding of the relationship between the gut microbiome and SLE and provides useful resources for future research such as in vivo functional investigation or large-scale meta-analysis.
Data availability statement
Data are available in a public, open access repository. Data are available on reasonable request. The whole-genome shotgun sequencing data are deposited in National Bioscience Database Center (NBDC) Human Database (http://humandbs.biosciencedbc.jp/) with the accession number of hum0197.
Ethics statements
Patient consent for publication
Ethics approval
This study was approved by the ethical committee of Osaka University (ID: 734–12).
Acknowledgments
We would like to thank all the participants involved in this study. We thank Ms. Miho Kaneda for supporting the study.
References
Supplementary materials
Supplementary Data
This web only file has been produced by the BMJ Publishing Group from an electronic file supplied by the author(s) and has not been edited for content.
Footnotes
Handling editor Josef S Smolen
YT, YM and EO-I contributed equally.
Contributors YT, TK and YO designed the study and conducted the data analysis. YT and YO wrote the manuscript. YT, YMae, EO-I, TK, DM, YMat, TN and SN conducted the experiments. YT, YMae, EO-I, TK, KY, KS, HM, MYo, MYa, TN and SO collected the samples. HI, KT, AK and YO supervised the study. All authors contributed to the article and approved the submitted version.
Funding This research was supported by the Japan Society for the Promotion of Science (JSPS) KAKENHI (19H01021 and 20K21834), the Japan Agency for Medical Research and Development (AMED; JP21km0405211, JP21ek0109413, JP21gm4010006, JP21km0405217 and JP21ek0410075), JST Moonshot R&D Grant Number JPMJMS2021, Takeda Science Foundation, Bioinformatics Initiative of Osaka University Graduate School of Medicine, Clinical Investigator’s Research Project of the Osaka University Graduate School of Medicine, Grant Programme for Next Generation Principal Investigators at Immunology Frontier Research Centre (WPI-IFReC), Osaka University.
Competing interests None declared.
Provenance and peer review Not commissioned; externally peer reviewed.
Supplemental material This content has been supplied by the author(s). It has not been vetted by BMJ Publishing Group Limited (BMJ) and may not have been peer-reviewed. Any opinions or recommendations discussed are solely those of the author(s) and are not endorsed by BMJ. BMJ disclaims all liability and responsibility arising from any reliance placed on the content. Where the content includes any translated material, BMJ does not warrant the accuracy and reliability of the translations (including but not limited to local regulations, clinical guidelines, terminology, drug names and drug dosages), and is not responsible for any error and/or omissions arising from translation and adaptation or otherwise.