Article Text

Abstract
Objectives Systemic lupus erythematosus (SLE) diagnosis and treatment remain empirical and the molecular basis for its heterogeneity elusive. We explored the genomic basis for disease susceptibility and severity.
Methods mRNA sequencing and genotyping in blood from 142 patients with SLE and 58 healthy volunteers. Abundances of cell types were assessed by CIBERSORT and cell-specific effects by interaction terms in linear models. Differentially expressed genes (DEGs) were used to train classifiers (linear discriminant analysis) of SLE versus healthy individuals in 80% of the dataset and were validated in the remaining 20% running 1000 iterations. Transcriptome/genotypes were integrated by expression-quantitative trail loci (eQTL) analysis; tissue-specific genetic causality was assessed by regulatory trait concordance (RTC).
Results SLE has a ‘susceptibility signature’ present in patients in clinical remission, an ‘activity signature’ linked to genes that regulate immune cell metabolism, protein synthesis and proliferation, and a ‘severity signature’ best illustrated in active nephritis, enriched in druggable granulocyte and plasmablast/plasma–cell pathways. Patients with SLE have also perturbed mRNA splicing enriched in immune system and interferon signalling genes. A novel transcriptome index distinguished active versus inactive disease—but not low disease activity—and correlated with disease severity. DEGs discriminate SLE versus healthy individuals with median sensitivity 86% and specificity 92% suggesting a potential use in diagnostics. Combined eQTL analysis from the Genotype Tissue Expression (GTEx) project and SLE-associated genetic polymorphisms demonstrates that susceptibility variants may regulate gene expression in the blood but also in other tissues.
Conclusion Specific gene networks confer susceptibility to SLE, activity and severity, and may facilitate personalised care.
- autoimmunity
- disease activity
- systemic lupus erythematosus
This is an open access article distributed in accordance with the Creative Commons Attribution Non Commercial (CC BY-NC 4.0) license, which permits others to distribute, remix, adapt, build upon this work non-commercially, and license their derivative works on different terms, provided the original work is properly cited, appropriate credit is given, any changes made indicated, and the use is non-commercial. See: http://creativecommons.org/licenses/by-nc/4.0/.
Statistics from Altmetric.com
Key messages
What is already known about this subject?
Previous DNA microarray gene expression studies have identified gene signatures involved in systemic lupus erythematosus (SLE) such as those linked to granulocytes, pattern recognition receptors, type I interferon and plasmablasts.
What does this study add?
A more comprehensive profiling of the ‘genomic architecture’ of SLE by combining genetic and transcriptomic analysis by next-generation RNA sequencing.
SLE has three distinct gene signatures: susceptibility, activity and severity signatures, the last best illustrated in nephritis which is enriched in ‘druggable’ granulocyte and plasmablast/plasma cell pathways.
Patients with SLE exhibit perturbed mRNA splicing in genes enriched in immune system and interferon signalling pathways.
Blood transcriptome discriminates SLE versus healthy individuals with high accuracy and can distinguish active versus inactive/low disease activity states.
DNA polymorphisms that confer susceptibility to SLE regulate gene expression not only in the blood but also in multiple other tissues, which may explain the multiorgan involvement in SLE.
How might this impact on clinical practice?
Characterisation of the ‘genomic architecture’ of SLE provides additional clues to the understanding of the systemic nature of the disease, its marked heterogeneity and novel targets of therapy and biomarkers for diagnosis/monitoring.
Introduction
Genome-wide expression analyses provide an unbiased approach to investigate complex diseases such as systemic lupus erythematosus (SLE). Previous microarray studies have identified gene signatures involved in SLE pertaining to granulocytes, pattern recognition receptors, type I interferon (IFN) and other cytokines, and plasmablasts.1–5 Notwithstanding, these results have not been associated with clinically defined disease outcomes or correlated with genetic data in a systematic way.
We combined genotype and RNA-sequencing data to comprehensively profile the blood transcriptome in 142 patients compared with healthy individuals, after controlling in silico for cellular heterogeneity. We define distinct ‘susceptibility’, ‘activity’ and ‘severity’ disease signatures, enriched in druggable pathways. Also, patients with SLE have perturbed mRNA splicing in immune system and interferon signalling genes. Based on transcriptome differences, we discriminate SLE versus healthy individuals with high accuracy and distinguish active versus inactive/low disease activity states. Finally, by integrating genotypes from our SLE cohort and using expression-quantitative trait loci (eQTLs) from the Genotype Tissue Expression (GTEx) project,6 we demonstrate that SLE-susceptibility polymorphisms regulate gene expression in the blood and also in other tissues.
Methods
See also online supplementary methods.
Supplemental material
Experimental design and patient characteristics
We conducted a cross-sectional study of SLE and age/sex-matched healthy individuals recruited from the participating Rheumatology and Blood Transfusion Units, respectively. History of biopsy-proven nephritis, classification criteria, serum autoantibodies, disease activity (physician global assessment, SLEDAI-2K7), definitions of Lupus Low Disease Activity State and remission,8 Lupus Severity Index (LSI)9 and use of medications were evaluated by standardised protocol. Participants gave informed consent and all procedures were approved by the local institutional review boards. All assays were performed in whole blood (PaxGene RNA tubes for mRNA extraction, EDTA tubes for DNA extraction), and patients withdrew lupus medications for 12 hours prior to sampling.
Genotyping
Individuals were genotyped with the Illumina HumanCoreExome-24 array, phased with SHAPEIT10 and imputed to the 1000 Genomes Project Phase III using IMPUTE2,11 yielding ~6.9 million variants.
RNA sequencing, mapping, quantifications and quality control
RNA libraries were prepared with the Illumina TruSeq kit and were sequenced on Illumina HiSeq2000. Paired-end reads (49 bp) were mapped to the GRCh37 reference human genome using GEM mapper.12 Exon quantification was performed on GENCODEv15. After quality control (online supplementary figure S1), we obtained quantifications for ~21 000 genes in 142 patients and 58 healthy volunteers (online supplementary table S1).
Supplemental material
Supplemental material
Differential gene expression and pathway enrichment analysis
DESeq213 was used to call differentially expressed genes (DEGs) including GC content, RNA integrity, study centre, insert size mode, age, gender, amount of RNA to construct the library and plate number as technical covariates. Statistical significance was set at 5% false discovery rate (FDR; Benjamini-Hochberg). We correlated gene expression with the SLEDAI-2K assigning −1 value for healthy individuals. Functional enrichment gene-set analysis for KEGG (Kyoto Encyclopedia of Genes and Genomes) pathways and GO (Gene Ontology) terms was performed.14
Cell type estimation-deconvolution
We used CIBERSORT15 to estimate the proportion of blood immune cell subsets for each individual. Cell-specific DEGs were identified by introducing as additional covariates the estimated cell proportions and the disease×cell proportion interaction term, and obtaining p values for every gene for the interaction term. For every cell type, we estimated the proportion of true positives from the enrichment of significant p values (π1 statistic).16
Disease classification
Linear discriminant analysis (LDA) was performed introducing DEGs as features. We divided our dataset into training (80%) and validation (20%) and run 1000 iterations. For each iteration, we identified DEGs between SLE and healthy individuals in the training set, which were used to build the LDA classifier. Each classifier was tested for its sensitivity and specificity to discriminate SLE versus healthy in the validation set.
Effect of genetic variation on gene expression
Genotypes obtained from our cohort were assessed for their effect on blood gene expression by eQTL mapping.17 ,18 Genetic ancestry was accounted by using the first three principal components (PCs) obtained from EIGENSTRAT (online supplementary figure S1E).19 To measure the impact of SLE GWAS (genome-wide association study) polymorphisms on SLE blood gene expression and across different tissues, we used eQTL data from our SLE cohort and GTEx.6 Co-localisation was assessed by the Regulatory Trait Concordance (RTC) score (>0.9)20 and calculated the shared probabilities (>0.9) that a SLE GWAS polymorphism and the eQTL tag the same functional variant.21
Results
Patients with SLE demonstrate widespread transcriptome perturbations
We found 6730 DEGs in SLE versus healthy individuals (online supplementary figure S2A, online supplementary table S2). Novel and previously identified pathways were implicated such as the IFN and NOD-like receptor signalling (online supplementary figure S2B–D, online supplementary figure S3A). Our DEGs overlapped significantly with DEGs in paediatric SLE versus healthy counterparts2 (p=10−165, Fisher’s exact test) (online supplementary figure S3B), denoting marked aberrancies in SLE blood transcriptome.
Supplemental material
Supplemental material
Supplemental material
IFN signature is robust in SLE and is present across various immune cell types
We used CIBERSORT15 to estimate the proportions in the blood of different immune cells and confirmed previously reported differences in SLE versus healthy individuals (figure 1A).22–26 By controlling for these data, we defined a global signature independent of cell variation that comprised 1613 DEGs (online supplementary table S3). The IFN and other pathways such as p53 signalling were prominent and independent of cell composition (figure 1B–C), underscoring a critical role in disease pathogenesis. By interrogating the interferome database,27 we found both type I and type II IFN response.
Supplemental material

Blood transcriptome deconvolution in systemic lupus erythematosus (SLE) and enriched pathways independent of cell composition. (A) Estimated proportions of different immune cell subsets in healthy and SLE individuals. For every cell type, the Mann-Whitney U test p value comparing healthy vs SLE individuals is displayed on top. (B) Pathway enrichment analysis with all differentially expressed genes (SLE vs healthy) after correcting for the proportion estimates of cell types. (C) Mechanistic map of the biological regulation (GO terms enrichment) in SLE after correcting for cell type proportion estimates.
We next explored cell-specific gene perturbations by a statistical model that fits the proportions of immune cells as covariates and a (SLE vs healthy)×proportion interaction term for every cell type. We tested for the significance of the interaction term and quantified for every cell type the proportion of true positives estimated from the enrichment of significant p values (π1 statistic) (figure 2A).16 In naive and memory B cells, CD4+ memory resting T cells, CD8+ T cells and neutrophils, π1 exceeded zero indicating that varying proportions of these cells correlate with divergent effects on gene expression in SLE versus healthy individuals. By introducing treatment with corticosteroids as an additional covariate, π1 for neutrophils decreased from 0.067 to 0.034, still the distribution of p values was left-skewed suggesting the existence of neutrophil-specific effects (online supplementary figure S4). Illustratively, increasing neutrophils correlated positively with GTPBP2 in SLE but not in healthy individuals (figure 2B). The same trend was observed for the correlation between CD4+ memory T cells and CD1c (figure 2C). Notably, GTPBP2 regulates type I IFN production,28 and CD1c mediates the presentation of modified peptides to T cells.29
Supplemental material

Cell-specific gene expression perturbations in patients with systemic lupus erythematosus (SLE). (A) Histogram of p values for the disease (SLE vs healthy)×proportion interaction term reveals cell type–specific gene expression effects for SLE. For every cell type, the proportion of estimated true positives (π1) and the number of significant genes at 5% false discovery rate (FDR) is shown. (B) Disease (SLE vs healthy) by estimated neutrophil proportion interaction for the gene GTPBP2. x-axis indicates the estimated proportion of circulating neutrophils while y-axis indicates the normalised GTPBP2 expression. Red dots indicate patients with SLE while blue dots indicate healthy individuals. (C) Disease (SLE vs healthy) by estimated CD4+ T-cell memory resting proportion interaction for the gene CD1c. x-axis indicates the estimated proportion of circulating CD4+ T-cell memory resting cells while y-axis indicates the normalised CD1c expression. Red dots indicate patients with SLE while blue dots indicate healthy individuals.
Distinct transcriptional signatures define susceptibility to SLE
Remission of disease activity is a therapeutic target in SLE,8 but whether this is mirrored by transcriptome changes remains unknown. We determined a ‘susceptibility’ signature that persists in the absence of disease activity following treatment. Principal component analysis (PCA) discriminated transcriptome in clinically active, inactive (clinical SLEDAI-2K=0) patients and healthy individuals (figure 3A–C). Inactive SLE were differentiated from healthy but not from active SLE, denoting persistently deregulated gene expression despite remission. We next took the intersection of DEGs in healthy versus active SLE (online supplementary table S4) and healthy versus inactive SLE (online supplementary table S5) that are not DEGs in active versus inactive SLE (online supplementary table S6), to reach 2726 DEGs which comprise the ‘susceptibility’ disease signature. These genes were enriched in regulation and response of the immune system processes (online supplementary figure S5A–C) suggesting persistence of immune activation. We also quantified alternative mRNA splicing events and found 84 genes with differential splicing (5% FDR) between SLE and healthy individuals (figure 3D, online supplementary table S7), enriched in immune system and type I interferon signalling pathways. Twenty-six out of 84 genes were also differentially expressed between SLE and healthy individuals after correcting for cell counts (online supplementary table S8). By comparing patients with clinically inactive SLE but evidence for serological activity (high anti-dsDNA, low complement) against those who are clinically and serologically inactive, we found no DEGs, corroborating clinical studies showing comparable prognosis for these two groups.30
Supplemental material
Supplemental material
Supplemental material
Supplemental material
Supplemental material

Blood transcriptome variation in systemic lupus erythematosus (SLE) vs healthy individuals and differential mRNA splicing. (A) Principal component analysis (PCA) of whole transcriptome between healthy and active SLE individuals. The two first principal components (PC1, PC2) are plotted. PC2 can differentiate the two groups implying differences in gene expression. (B) PCA between healthy and inactive SLE individuals. PC2 can differentiate the two groups indicating that even in disease remission, the transcriptome of patients with SLE is different compared with healthy individuals. (C) PCA between active and inactive patients with SLE. The first two PCs do not differentiate the two groups suggesting the absence of significant differences in gene expression between them. (D) We characterised alternative splicing events by focusing on intron excisions. A cluster is defined as set of overlapping spliced junctions or introns. For each cluster, we calculated the PSI (percentage splicing intron) coverage and then normalised it as a fraction of the total counts. Each splicing event is plotted as a line connecting its start and end coordinates of the intron with a thickness proportional to the displayed normalised count value. Differential splicing is measured in terms of the difference in the per cent spliced in dPSI. Illustratively, in the case of TIMM10, the splicing event ‘a’ is more frequent in healthy (88%) as compared with SLE (73%) individuals; therefore, the difference in PSI (SLE vs healthy; dPSI) is −0.202.
SLE activity signature is enriched in oxidative phosphorylation
Active disease in SLE may result in organ damage.31 We selected the DEGs from the inactive versus active SLE comparison that are not in the ‘susceptibility’ signature. A total of 365 DEGs were identified, which were enriched for oxidative phosphorylation, consistent with the alterations in mitochondrial mass and membrane potential in lupus T cells32 and the enhanced oxidative stress.33 Other enriched pathways included ribosomes and cell cycle. Together, active SLE is linked to perturbed expression of genes regulating metabolism, protein synthesis and proliferation of blood immune cells. The ‘activity’ signature persisted after controlling for serological activity/autoantibodies or treatments, therefore suggesting it could be of potential use for monitoring patients with SLE, although further validation in longitudinal studies will be required. To further corroborate this, we found significant overlap (p=10−5, online supplementary figure S3B) between our DEGs (inactive vs active disease) with the respective DEGs in paediatric SLE.2
Blood transcriptome as a biomarker of SLE severity
Patients with SLE demonstrate marked variability in clinical outcome and there is an unmet need for biomarkers that reflect disease severity and the underlying molecular mechanisms. We assessed transcriptome according to varying degrees of the SLEDAI-2K index.7 By performing PCA (figure 4A) on the identified 3690 DEGs (online supplementary table S9), we defined PC1 (explaining 23% of the transcriptome variance) as a new variable summarising the expression properties of genes that recapitulate SLE activity (figure 4B) and severity (LSI-defined) (figure 4C). PC1 clustered closely patients with clinical remission and low disease activity, consistent with evidence that both these states have a favourable outcome.8 Pathway analysis showed enrichment in oxidative phosphorylation and cell cycle (figure 4D), similar to the ‘activity’ signature. Network enrichment revealed signatures of protein ubiquitination, electron transport chain, protein phosphorylation, cell cycle, defence response and regulation of response to stress (figure 4D), all of which have been linked to SLE.33–35 These results suggest that multiple molecular pathways determine SLE progression/severity; in this context, blood transcriptome may serve as biomarker for clinically defined outcomes.
Supplemental material

Transcriptomic index correlates with systemic lupus erythematosus (SLE) activity and severity. (A) Principal component analysis (PCA) of 3690 differentially expressed genes (DEGs) significantly correlated with the SLEDAI-2K index (modified to include a fixed score of −1 for healthy individuals). The first two PCs are plotted. PC1 captures SLE activity states, thus separating different groups of individuals namely healthy individuals, patients with SLE at remission, low disease activity (LDA) state and active disease. (B) Jitter plot of PC1 weights according to SLE activity states. For each group, the median value is plotted. The regression line is plotted in red (p=5.86×10⁻¹⁷). (C) Jitter plot of PC1 weights according to SLE severity. Patients with SLE were stratified into three equal-sized groups based on the distribution of Lupus Severity Index scores (lowest to 33rd percentile score; 33rd to 66th percentile score; 66th to highest score), thus creating three distinct groups of increasing disease severity (DS1 to DS3). For each group, the median value is plotted. The regression line is plotted in red (p=1.02×10⁻²³). (D) KEGG pathway enrichment analysis of 3690 DEGs (inset on the right side of the plot) with prominent oxidative phosphorylation and cell cycle pathways. Functionally grouped networks of GO terms are shown on the right. Multiple biological aberrations are captured by differences in gene expression based on different levels of SLE activity/severity.
Neutrophil activation and humoral response signatures correlate with renal involvement in SLE
SLE can affect multiple tissues, but the molecular basis of this heterogeneity remains elusive. Comparison of active versus inactive patients with nephritis revealed extensive gene expression differences with 1496 DEGs (figure 5A–B). To discern the transcriptome basis for kidney disease, we compared patients with active nephritis versus those with activity from other organs (online supplementary table S10) and found 136 DEGs (online supplementary table S11) enriched in granulocyte activation and antimicrobial humoral response (figure 5E), consistent with the role of neutrophils36–38 and of plasmablasts/plasma cells.39 40 We aligned our results with those in paediatric lupus nephritis and confirmed the presence of neutrophil gene signature (p=5×10−39) (figure 5C). Next, we took the intersection of DEGs in active nephritis versus inactive SLE (1375 DEGs) with those in active versus inactive SLE (377 DEGs); 305 genes were common, suggesting a stepwise progression of transcriptome alterations from inactive to active non-renal and active renal SLE. These genes were enriched in oxidative phosphorylation, ribosome, proteasome (online supplementary table S12), cell cycle and pyrimidine metabolism pathways (figure 5D).
Supplemental material
Supplemental material
Supplemental material

Transcriptome analysis of lupus nephritis reveals prominent neutrophil and humoral response signatures. (A) Principal component analysis (PCA) of blood gene expression between active lupus nephritis and lupus nephritis in remission. PC1 and PC2 are plotted on x-axis and y-axis, respectively. PC2 is differentiating the two groups. (B) PC2 and PC3 are plotted on x-axis and y-axis, respectively. PC3 is also differentiating the two groups suggesting that PC2 and PC3 capture different transcriptome/biological aberrations involved in active lupus nephritis. (C) Comparison of neutrophil gene signature with data from a paediatric systemic lupus erythematosus (SLE) study (Banchereau and Pascual; Cell 2016). Fisher’s exact p values of overlap are plotted in accordance with the ORs denoted as heatmap. (D) Pathway enrichment analysis of the intersection of differentially expressed genes (DEGs) in active nephritis vs inactive SLE with those in active vs inactive SLE. (E) Functionally grouped networks of enriched GO term categories were generated for the 136 DEGs (5% false discovery rate) between patients with SLE with active nephritis vs those with activity from other organs. The main enriched terms are granulocyte activation and antimicrobial humoral response.
Gender differences in gene expression in patients with SLE patients
SLE exhibits a striking gender bias with women affected more frequently than men, yet the latter suffering from more severe disease.41 We examined for gender-biased gene expression specifically in SLE by taking the non-overlapping DEGs in male versus female SLE (Bonferroni significant) and male versus female healthy (90% FDR threshold to increase specificity) individuals. Six genes had perturbed gender-biased expression in SLE (online supplementary figure S6A), two of which (SMC1A, ARSD) escape X-chromosome inactivation. SMC1A 42 demonstrated the strongest gender difference (online supplementary figure S6A–B), and this was confirmed in purified CD14+ monocytes (online supplementary figure S6C). Although preliminary, these results provide candidate genes for further studies.
Supplemental material
Blood transcriptome discriminates SLE versus healthy individuals
SLE diagnosis can be challenging especially at early stages.43 We asked whether we could classify individuals based on their gene profile by LDA using DEGs as features. We divided our cohort into training (80%) and validation (20%) and run 1000 iterations. By sampling different individuals in each iteration, we inserted perturbations in our model therefore building multiple LDA classifiers to account for SLE heterogeneity. Using a median 5438 DEGs, we obtained a median diagnostic accuracy of 87.5% (85.7% sensitivity, 91.7% specificity) in the validation set (online supplementary figure S7). This finding needs further confirmation and testing against lupus-like control diseases.
Supplemental material
SLE genetic causality may arise from blood and non-blood tissues
Considering the extended genomic perturbations in patients with SLE, we asked to what extent they may be genetically determined by combining RNA-seq with genotype data and mapping eQTLs in our dataset. We found 3142 cis-eQTLs with highly significant eQTLs clustering close to the transcription start site of the genes (online supplementary figure S8A–B), in accordance with their putative regulatory effects. Approximately 17.5% of the DEGs (SLE vs healthy) had an eQTL. Co-localisation analysis (RTC method)20 21 with GWAS SLE variants revealed nine genes where both the GWAS and the eQTL tag the same variant, namely UBE2L3, HLA-DRB5, RP11-356I2.3, BLK, FAM167A, NADSYN1, RP11-660L16.2, ALDH2 and ALDH18A1, thus implicating them in SLE pathogenesis.
To detect disease-specific eQTLs, we compared our SLE eQTLs with those from a larger blood RNA-seq study (n=384 healthy) to gain statistical power.44 SLE and control eQTLs replicated well (π1=0.89, online supplementary figure S8C), suggesting the lack of disease specificity. Although it is possible that many of the SLE eQTLs are common eQTLs found also in healthy individuals, this result could be due to insufficient power and/or the need to assay cell subtypes. We analysed active and inactive patients with SLE and found 1072 and 539 eQTLs, respectively. The replication rate between the two groups was 0.854 and 0.921 (π1 measurement), respectively, again suggesting no specificity according to the disease status.
Supplemental material
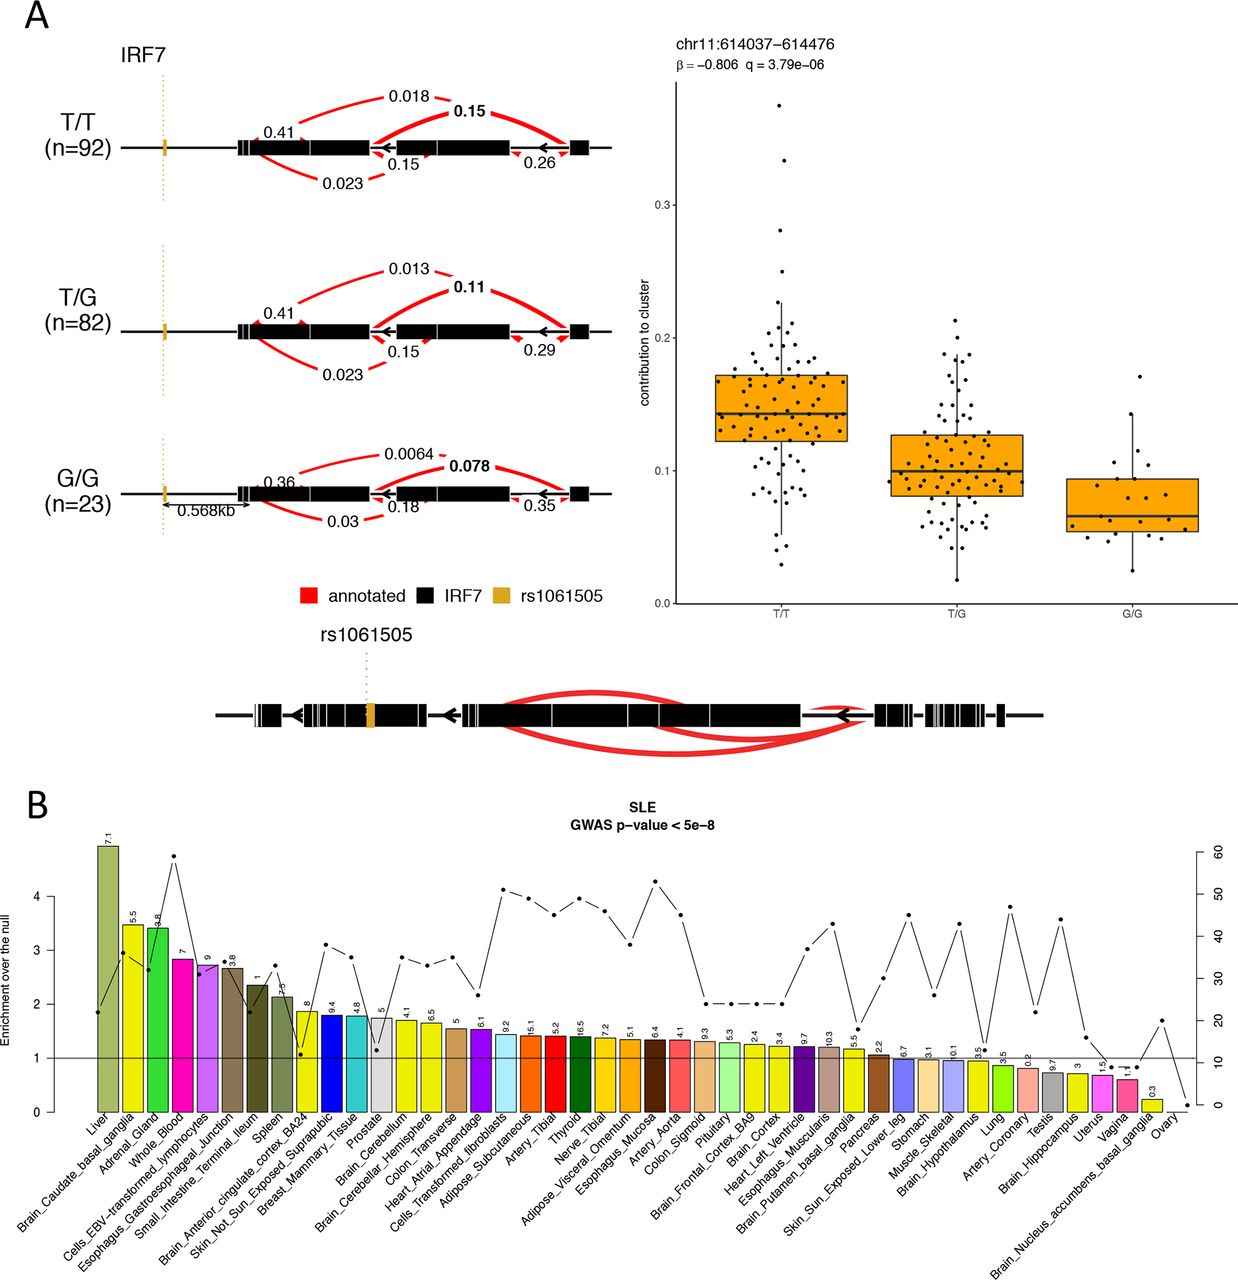
We next performed splicing-QTL analysis for the SLE individuals by calculating intron excision ratios,45 and found 777 splicing-QTLs. Notably, 13 of the 26 genes with both perturbed expression and splicing in SLE (online supplementary table S8) had a splicing-QTL, suggesting underlying genetic effects (figure 6A).
Systemic lupus erythematosus (SLE)-susceptibility variants regulate gene expression in blood and non-blood tissues. (A) Splicing QTL example for the gene IRF7. Individuals with SLE carrying the TT genotype show higher contribution of the same splicing event to the intron cluster compared with individuals carrying the GG genotype. (B) To address the impact of SLE GWAS (genome-wide association study) polymorphisms on gene expression across different tissues, we used the eQTL data in 44 tissues from GTEx6 and calculated the tissue-sharing probabilities of eQTLs and the probabilities that a SLE GWAS polymorphism and the eQTL tag the same functional effect. On the primary y-axis, the enrichments-over-the-null per tissue are plotted as bars; on the secondary y-axis, the number of SLE GWAS variants that colocalise with eQTLs per tissue are plotted as dotted line. The horizontal black line indicates the null. On top of each bars are the −log10 Benjamini-Hochberg–corrected p values for the enrichments.
Finally, we examined whether SLE-associated genetic variation may regulate gene expression in non-blood tissues. We used SLE GWAS signals and eQTLs from 44 tissues,6 and employed the RTC method21 to normalise the GWAS-eQTL probabilities with the tissue-sharing estimates of the eQTLs to determine relevant tissue(s). Notably, SLE-associated polymorphisms regulated gene expression not only in the blood but also in other tissues, particularly the liver followed by basal ganglia and adrenal gland (figure 6B), suggesting that SLE genetic susceptibility may affect multiple tissues. The finding of liver as a causal tissue concords with our result that disease activity correlates with changes in metabolism genes.46
Discussion
Our study provides a comprehensive characterisation of gene signatures in adult SLE associated with susceptibility and clinically relevant outcomes. Moreover, we explore the genetic regulation of transcriptome and provide novel insights regarding SLE pathogenesis.
By transcriptome deconvolution, we estimated the proportions of blood immune cell subsets. We confirmed previously reported perturbations in the abundancies of various cells in SLE,22–26 which collectively accounted for 75% of blood DEGs. Type I IFN and p53 signalling represented two robust signals unaffected by the cell composition, suggesting their critical involvement in disease pathogenesis.
Our analysis for cell-specific effects in gene expression might provide unique insights regarding perturbed molecular and/or genetic mechanisms in SLE. Illustratively, it can be hypothesised that there is a molecular mechanism that keeps GTPBP2 levels stable across increasing peripheral blood neutrophils in healthy individuals, but this is disturbed in SLE (figure 2B). Alternatively, a genetic mechanism such as a disease-specific eQTL might operate in neutrophils and regulate GTPBP2. Together, differences in SLE blood transcriptome may be driven by both altered abundances of circulating cells and cell-specific gene regulation.
Our data revealed a ‘susceptibility’ signature pertaining to regulation and response of the immune system that persists even when the disease has remitted. This emphasises the role of immune cell activation in SLE but also implies that existing therapies fail to restore immune aberrancies. Notably, patients with SLE exhibited perturbed splicing pattern in several genes implicated in immune system and interferon signalling, raising the possibility that proteins with aberrant amino acid sequence and/or function are produced.47 We also defined an ‘activity’ signature enriched in cell metabolism/oxidative phosphorylation genes. These data corroborate studies implicating mitochondrial function and aerobic glycolysis in regulation of immune cells relevant to SLE48 and could be explored therapeutically.
SLE typically follows a waxing–waning course, necessitating patient monitoring to optimise outcomes. We generated a novel transcriptome index that correlates with SLE activity and severity (figure 4A–C). Notably, this index distinguished patients with active disease versus remission or low disease activity,8 and could be further exploited as biomarker.
Lupus nephritis represents a distinct disease subset with increased morbidity and treatment complications. We detected extensive transcriptome perturbations in active nephritis with prominent granulocyte and plasmablasts/plasma cell signatures, a finding confirmed in paediatric patients with SLE.2 Notably, blockade of neutrophil extracellular traps formation,49 and of plasma cells by proteasome50 or Bruton’s tyrosine kinase51 inhibitors have shown evidence of efficacy in murine lupus nephritis.
SLE diagnosis is often based on the acumen of experienced physicians due to its clinical heterogeneity.41 43 We found that blood transcriptome had high specificity and sensitivity in discriminating SLE versus healthy individuals, suggesting it might serve as a diagnostic aid. Further studies including also control diseases are required to support these findings.
We assessed how genetic variation correlates with gene expression in SLE by integrating genotype and RNA-seq data. We found numerous cis-eQTLs which, however, were not disease specific. Moreover, our splicing-QTL data corroborate previous results,52 further emphasising the genetic contribution to the disease. Besides immune activation, the function of tissues may be critical in determining disease outcome. To this end, we used SLE GWAS data and eQTLs from the GTEx tissues. Top causal tissues included liver followed by basal ganglia, adrenal gland and whole blood. Interestingly, mTORC1-dependent liver mitochondrial dysfunction has been implicated in murine lupus46 although further mechanistic studies are needed to disentangle these findings.
Our study has also certain limitations. First, the lack of longitudinal data to assess intra-individual changes in transcriptome. Second, although our sample size was adequate to characterise subgroup differences, still it lacked sufficient power to detect SLE-specific eQTL signals. Finally, as we studied predominantly Caucasians, our findings may not be generalised to other ethnic groups.
Conclusively, by studying transcriptome differences in SLE and healthy individuals, we describe distinct susceptibility and activity/severity signatures. Our data further illustrate the molecular heterogeneity of the disease and may facilitate the development of novel biomarkers and therapies.
Supplemental material
Acknowledgments
The computations were performed at the Vital-IT (http://www.vital-it.ch) Centre for High-Performance Computing of the Swiss Institute of Bioinformatics. The authors thank Olivier Delaneau, Andrew Brown and Ana Viñuela for computational and scientific assistance.
References
Footnotes
NIP and GKB contributed equally.
Handling editor Josef S Smolen
Contributors NIP carried out the analyses. NIP and GKB drafted the manuscript, with contributions from all authors. GKB recruited and took care of patients, collected blood samples, extracted RNA and DNA. HO performed the RTC analysis. LRP and DB prepared the RNA-seq libraries and CH processed the RNA-seq and genotyping data. IG contributed in recruitment of patients and healthy individuals, and extracted clinical data from the medical charts. DK isolated immune cell subsets from peripheral blood samples and performed RT-PCR studies. MGT, MT, CP, AF, AR and PS contributed patient samples and participated in the analyses of data. DTB and ED conceived and oversaw the study and the writing. All authors read and approved the final manuscript for publication.
Funding This work was funded by the Foundation for Research in Rheumatology (FOREUM) and also in part by the Greek General Secretariat of Research and Technology ‘Aristeia’ action of the Operational Program ‘Education and Lifelong Learning’ (co-funded by the European Social Fund and National Resources, Aristeia I 2344 to DB), the European Research Council (ERC) under the European Union’s Horizon 2020 research and innovation programme (grant agreement no. 742390) and the SYSCID (A Systems Medicine Approach to Chronic Inflammatory Diseases) under the European Union’s Horizon 2020 research and innovation programme (grant agreement no. 733100). The work was also supported by grants from the Swiss National Science Foundation (SNSF) RNA 3: 31003A-170096, SystemX : 2012/201 SysGenetiX (to EDT) and the Louis-Jeantet Foundation support (to EDT). GKB was supported by the Greek State Scholarships Foundation-ΙKY (Postdoc Fellowships of Excellence—Siemens) and the European Union Seventh Framework Programme (project TransPOT; FP7-REGPOT-2011-1).
Data availability RNA-seq, genotype, clinical and processed data (summary statistics and expression files) have been deposited at the European Genome-phenome Archive (EGA), which is hosted by the EBI and the CRG, under the accession number EGAS00001003662.
Competing interests None declared.
Patient consent for publication Obtained.
Ethics approval All procedures were approved by the local institutional review boards.
Provenance and peer review Not commissioned; externally peer reviewed.