Article Text

Abstract
Objectives Treatment of patients with systemic sclerosis (SSc) can be challenging because of clinical heterogeneity. Integration of genome-scale transcriptomic profiling for patients with SSc can provide insights on patient categorisation and novel drug targets.
Methods A normalised compendium was created from 344 skin samples of 173 patients with SSc, covering an intersection of 17 424 genes from eight data sets. Differentially expressed genes (DEGs) identified by three independent methods were subjected to functional network analysis, where samples were grouped using non-negative matrix factorisation. Finally, we investigated the pathways and biomarkers associated with skin fibrosis using gene-set enrichment analysis.
Results We identified 1089 upregulated DEGs, including 14 known genetic risk factors and five potential drug targets. Pathway-based subgrouping revealed four distinct clusters of patients with SSc with distinct activity signatures for SSc-relevant pathways. The inflammatory subtype was related to significant improvement in skin fibrosis at follow-up. The phosphoinositide-3-kinase-protein kinase B (PI3K-Akt) signalling pathway showed both the closest correlation and temporal pattern to skin fibrosis score. COMP, THBS1, THBS4, FN1, and TNC were leading-edge genes of the PI3K-Akt pathway in skin fibrogenesis.
Conclusions Construction and analysis of normalised skin transcriptomic compendia can provide useful insights on pathway involvement by SSc subsets and discovering viable biomarkers for a skin fibrosis index. Particularly, the PI3K-Akt pathway and its leading players are promising therapeutic targets.
- systemic sclerosis
- gene expression profiles
- unsupervised clustering
- fibrosis
Statistics from Altmetric.com
Key messages
What is already known about this subject?
Systemic sclerosis (SSc) is a clinically heterogeneous disease with a variable molecular signature and clinical course.
The resolution of skin fibrosis remains an unmet clinical need in patients with SSc.
What does this study add?
Using unsupervised machine learning, a pathway-driven matrix of skin gene expression profiles allows subdivision of SSc into four subtypes with distinct activities of SSc-relevant pathways.
The inflammatory subtype was related to significant improvement in skin fibrosis at follow-up. Increased activity of the phosphoinositide-3-kinase-protein kinase B (PI3K-Akt) pathway was closely correlated with skin fibrosis in all patients and chronologically and was driven by COMP, FN1, TNC, THBS1 and THBS4.
How might this impact on clinical practice or future developments?
Pathway-based clustering and integrative analysis offer opportunities to understand the divergent mechanistic features of SSc and shed new light on the PI3K-Akt pathway as a promising biomarker or therapeutic target.
Introduction
Systemic sclerosis (SSc) is a chronic autoimmune disease that is characterised by the distinctive pathogenetic triad of microvascular damage, dysregulated autoimmunity and generalised fibrosis of the skin and multiple internal organs. SSc usually results in permanent functional impairment and is associated with high morbidity and mortality.1 2 Studies using tissue samples, diverse and sophisticated animal models and genome-wide analyses are providing insights regarding the pathogenesis of this disease. Current therapeutic approaches include treatments against vasculopathy, general immunosuppression and affected organ-specific therapies, although no single therapy has been proven to effectively reverse the fibrotic process in SSc.1 2 This is mainly because of a lack of sensitive and specific outcome measures, varying natural course of the disease and slow progression of the disease.1 3 As such, there are substantial gaps in our knowledge regarding the mechanistic basis of the SSc progression and prognosis stratification.
In SSc, gene expression profiling has been used to gain insights regarding the pathogenesis of the disease.4–6 Because all previous studies have been performed with small cohorts with varying patient histories, technical protocols and different technologies, a direct comparison between data sets and results is not possible. Therefore, we have constructed a compendium that reduces data set bias and provides opportunities to analyse features missing from previous studies, bridging the gap between prior and current knowledge—a technique that has been successfully applied in cancer and infectious disease research.7–9 In this study, we aim to elucidate the various transcriptional and signalling signatures of SSc by performing a comprehensive meta-analysis of the publicly available data sets that have been published so far. We have applied several preprocessing and normalisation steps to create a cohesive, homogenised compendium of genome-wide gene expression signatures for downstream analysis. We used this compendium to separate expression-driven subgroups, understand the key cellular components in each group and identify genes and pathways with high information value to create predictive models for drug responsiveness.
Methods
Overview of data processing and analysis
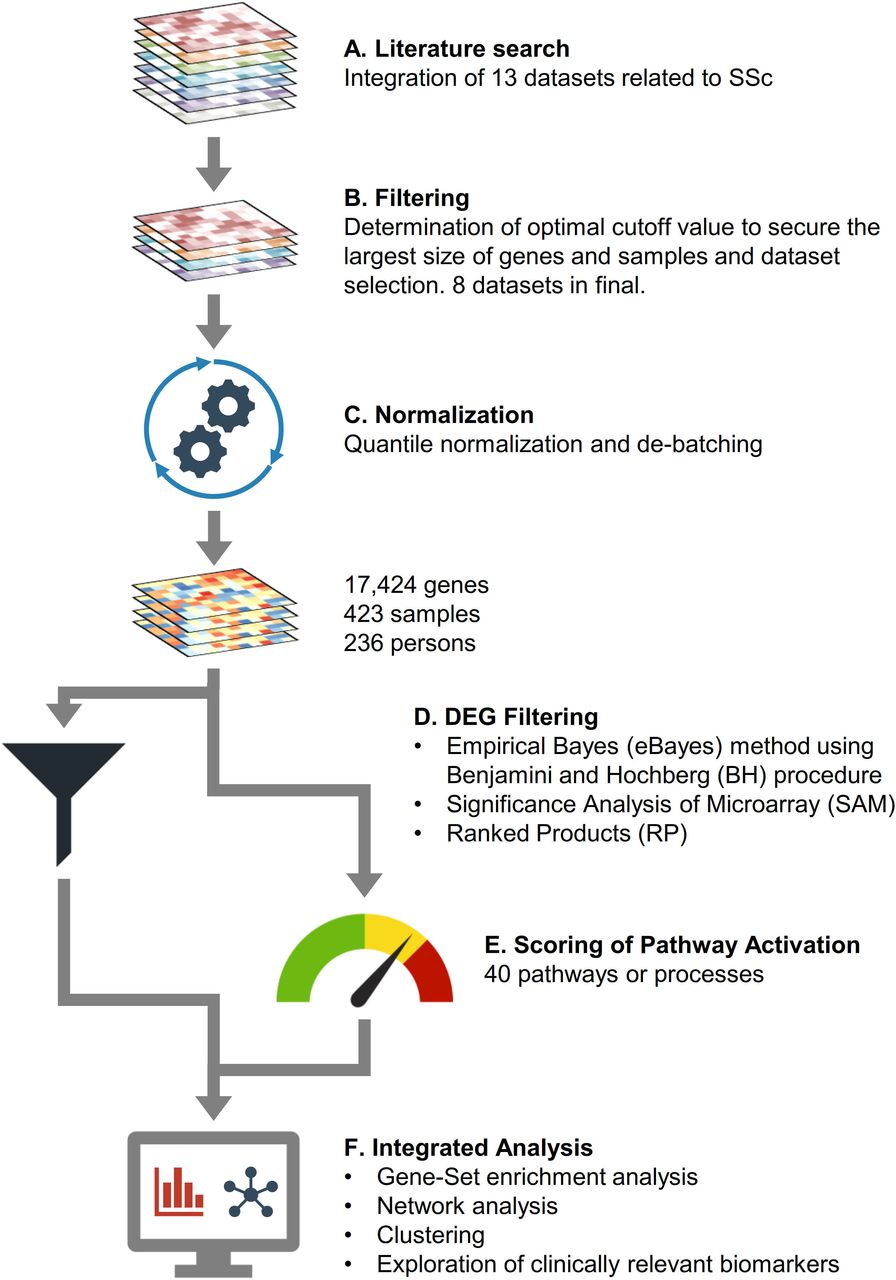
We used the keywords ‘systemic sclerosis’, ‘skin’, ‘transcriptomics or microarray’ and ‘data set’ in Google Scholar and PubMed to find relevant publications on genetic skin signatures in patients with SSc (figure 1). The final number of patients with SSc was 175 (diffuse subset SSc (dSSc) 115, limited subset SSc (lSSc) 60) and 61 healthy normal controls (NC). Ultimately, the final SSc compendium was constructed from eight studies with a total of 423 samples from 236 patients and covering 23 684 genes total (common core of 17 424 genes). After normalising the vectors for the matrix using quantile normalisation and correcting the batch effect, we performed differential expression analysis and selected the gene candidates identified by three independent methods. We then performed functional gene-set enrichment analysis (GSEA) and protein–protein interaction network analysis, with subsequent grouping of the samples based on non-negative matrix factorisation (NMF). Finally, we investigated the pathways and the biomarkers associated with skin fibrosis using GSEA. Detailed methods are described in supplementary methods.
Supplemental material

Overview of data processing steps. (A) A total of 20 studies covering 23 684 genes were retrieved from the literature. (B) Eight data sets were selected for integrated analysis, including samples from 175 patients with SSc and 61 NC, covering 17 424 genes. (C) The merged data set was normalised using quantile normalisation, and its batch effect was further corrected. (D) DEGs of SSc compared with NC were obtained using three methods: eBayes, SAM and RP. The intersection of three DEG sets was designated as significant. (E) Calculation of pathway activation scores using the whole gene expression profiles. (F) A list of strategies for integrated analysis. DEG, differentially expressed genes; eBayes, empirical Bayes; NC, normal controls; RP, rank products; SAM, significance analysis of microarray; SSc, systemic sclerosis.
Results
DEGs in each subgroup of SSc
To get a list of SSc-related DEGs, gene expression profiles of the involved forearm area of patients with SSc were compared with forearm samples from the NC groups. A total of 1089 upregulated DEGs were identified in dSSc and 192 in lSSc, respectively (supplementary file S1). Of these, 191 DEGs were shared by dSSc and lSSc. When compared with uninvolved back areas of patients with SSc and same-site samples from the NC groups, 31 upregulated DEGs were identified in dSSc and five in lSSc, respectively (supplementary file S1). A single DEG (IFI27) was shared by dSSc and lSSc. Enrichment of the type I interferon (IFN) signalling pathway (p=3.67×10⁶) was observed in 31 DEGs of dSSc by performing functional enrichment analysis. The combined clinical characteristics of the patients with dSSc were summarised in supplementary figure S2B. In subsequent analyses, we focused the data of dSSc because there were more enriched gene expression signatures with more samples.
Supplemental material
Supplemental material
Protein-to-protein interaction network and enriched biological processes
Because identification of central attractors in the gene and protein network can provide clues about novel disease-associated genes with high priority and hidden targets for further experimentation, we constructed a protein-to-protein interaction network of dSSc (figure 2A). We identified 1068 interactions of the 1089 DEGs, and 620 genes were isolated without a link. Inter-relationships between genetic susceptibility, potential drug targets and hub positions on the network were shown schematically in supplementary figure S4. Of these, 14 DEGs overlapped with SSc genetic susceptibility loci previously discovered10–13 and five genes (CTGF, HCK, LYN, PDGFRB and PPARG) were the potential target molecules for therapy.14 15 A total of 89 genes were ranked as hub molecules based on centrality analysis, and four target molecules, except PPARG, have the hub position. Notably, CTGF was the unique gene with both molecular target potentiality and hub status among the susceptibility genes.10 15–17

Differentially expressed genes (DEGs) and their functional networks. (A) Protein–protein interaction network of upregulated DEG. Informative genes are coloured and guided at the right-side table. (B) Gene-set enrichment map for whole gene expression profiles. Nodes represent gene ontology (GO)-termed gene sets. Their colour intensity and size are proportional to the enrichment significance and the gene size, respectively. Edge thickness represents the degree of overlap between gene sets, and only edges with a Jaccard similarity coefficient larger than 0.25 were visualised. Conglomerates of functionally related gene-sets were manually curated based on the GO parent–child hierarchy and assigned a label.
We performed GSEA for whole gene expression profiles using the GSEA tool, from which 526 gene ontology processes were identified (figure 2 and supplementary figure S5). As expected, immune related (cytokine and chemokine related), profibrotic (extracellular matrix organisation, transforming growth factor beta (TGFβ) related, cell proliferation) and angiogenesis (vascular endothelial growth factor-related) processes were enriched and adequately explained the current concept of dermato-pathophysiology in SSc.
Pathway activations describing SSc biology and subgrouping
Genes, proteins and other chemical compounds in a living organism rarely act in isolation, but instead work cooperatively to perform certain biological functions. In the same vein, disease is the summed result of aberrant activation of common pathways through dysregulated genes and aggregated activity of compounds.18 The advantage of pathway-based analysis has been previously demonstrated in clinical stratification for cancer research.8 19 We curated 40 SSc-relevant pathways or processes from the literature20–24 and computed pathway activation scores using the gene sets from the KEGG and Reactome databases (supplementary file 2).25 26 We assessed whether patients with dSSc could be categorised into subgroups based on their pathway activation profiles through consensus NMF clustering.27 To identify the optimal number of clusters and to assess the robustness of the clustering results, we computed the cophenetic coefficients and silhouette scores for different numbers of clusters from two to six; we found that four clusters most optimally represent the data (figure 3A and supplementary figure S6). Segregation of dSSc subgroups was also reproduced by t-distributed Stochastic Neighbor Embedding (t-SNE) analysis (figure 3B). Pathway elements matrix of four segregated subgroups were depicted by heatmap (figure 3C) and active pathways or processes were distinct across four clusters.
Supplemental material
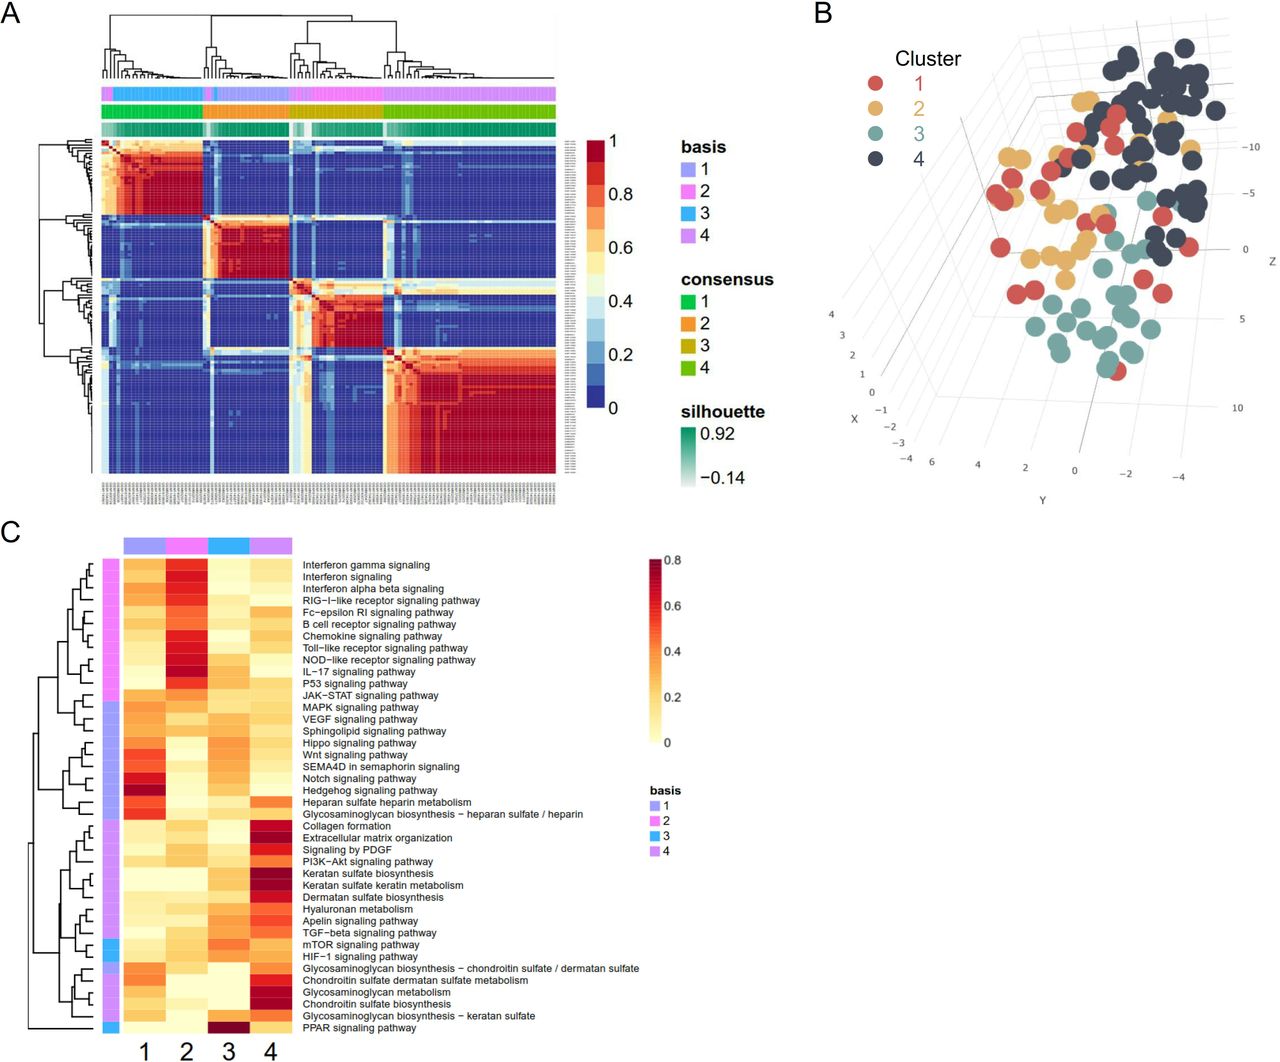
Identification of systemic sclerosis (SSc) subgroups according to pathway-based skin signatures. (A) Reordered consensus matrices on SSc compendium. The samples were clustered using average linkage and 1-correlation distances. Deep-red colour indicates perfect agreement of the solution, while blue colour indicates no agreement (right-side colour bar). Basis and consensus represent clusters based on the basis and consensus matrices, respectively. The silhouette score is a similarity measure within its own cluster compared with other clusters. (B) t-distributed Stochastic Neighbor Embedding (t-SNE) reduces the dimensions of a multivariate dataset. Each data point is assigned a location in a three-dimensional map to illustrate potential clusters of neighbouring samples, which contain similar gene expression patterns. (C) Element matrix of pathways or processes by negative matrix factorisation. Heatmap with red gradient represents the level of fold enrichment for each pathway or processes. HIF, hypoxia-inducible factor; IL, interleukin; JAK, Janus kinase; MAPK, mitogen-activated protein kinase; mTOR,mammalian target of rapamycin; NOD-like, nucleotide-binding oligomerizationdomain-like; PDGF, platelet-derived growth factor; PI3K, phosphoinositide3-kinases; PPAR, peroxisome proliferator-activated receptors; RIG-I-like, retinoic acid-inducible gene-I-like; SEMA4D,semaphorin-4D; STAT, signal transducer and activator of transcription; TGF, transforming growth factor; VEGF, vascular endothelial growth factor.
To validate the differences in activities of pathways among the four clusters, we analysed the activation of individual pathways and filtered the 20 pathways of significant difference across the four clusters (figure 4A). The chord diagram in the centre shows the interconnectedness between the gene sets of pathways or processes by the Jaccard similarity coefficient. In general, there was no remarkable link between cytokine or chemokine pathways and processes of extracellular matrix formation, but the platelet-derived growth factor (PDGF) signalling pathway and collagen formation shared a proportion of element genes (Jaccard similarity coefficient=0.144) and highly correlated (γ=0.928, p=2.2×10 -16) (supplementary figure S7). The peroxisome proliferator-activated receptor (PPAR) signalling pathway rarely shared with any one of them (Jaccard similarity coefficient <0.10) and exhibited the opposite direction of activity against the other pathways (supplementary figure S7).

(A) Pathway activation scores according to systemic sclerosis (SSc) subgroups. The chord diagram shows the interrelationship among pathways, and link thickness is proportional to the overlap between two pathways. These were calculated using the Jaccard similarity coefficients. Turkey box plots reveal pathway activation scores across the SSc subgroups, and analysis of variance (ANOVA) analysis was used to analyse the differences across four subgroups. (B) xCell-inferred enrichment score of cell types according to the four clusters. xCell scores predict relative enrichment for cell types, not the proportions. *P<0.05; **P<0.01; ***P<0.001 by ANOVA.
Cluster 4 showed the strongest inclination towards extracellular matrix formation and was also highly active for TGFβ, Apelin, PI3K-Akt and PDGF signalling pathways. The type I IFN signalling pathway was more active in clusters 1 and 2. Cluster 1 was more heavily weighted towards the Notch and Hedgehog signalling pathways, while cluster 2 showed a stronger predilection for the TGFβ signalling pathway. Cluster 3 was the weakest for most pathways, but was conspicuous for the PPAR signalling pathway. As matched with previous results by intrinsic gene subsets,5 6 clusters 1 and 2 and clusters 3 and 4 were conceptually similar to inflammatory, normal like and fibroproliferative types, respectively.
To characterise the cell types responsible for gene expression differences among the skin tissue samples, we applied xCell software, the machine learning framework to estimate cell type enrichment.28 Cluster 2 was the most enriched with immune cells such as B cells, T cells, dendritic cells and macrophages (figure 4B). Fibroblast subsets predominated in cluster 4, with strong activity for fibrosing signalling pathways (figures 3 and 4A). Cluster 1 had a higher score for eosinophils and Th1 cells, while cluster 3 had a higher score for epithelial cells and keratinocytes.
To validate the dSSc subgrouping scheme, a 20-pathway classifier was developed using a naive Bayes machine learning algorithm. This classifier was applied to an independent dataset consisting of 69 skin samples from 38 patients with dSSc (GSE106358).29 The 20-pathway classifier reliably categorised dSSc samples in the GSE106358 into four subgroups, with an average classification performance of 0.8372 (p=4.56×10⁻¹²) (supplementary figure S8). The four subgroups were identified and the proportions were comparable to the training data set (supplementary figure S8), demonstrating proper functioning of the classification model.
Clinical implication of pathway-driven subgroups in dSSc
We examined the relationships between identified four subgroups and pertinent clinical features based on the provided information. The highest correlation was age in cluster 4, and disease duration in cluster 1, but the range of values was comparable across the clusters (figure 5A). The modified Rodnan skin score (mRSS) was significantly higher in cluster four compared with clusters 1 and 3 (all p<0.05), but not compared with cluster 2 (p=0.31), which was a proxime accessit in the mRSS and TGFβ pathway activity (figure 4). Correlations between mRSS and SSc-relevant pathways were analysed, and significant correlations were plotted in figure 5B. PI3K-Akt and PDGF signalling pathways had the strongest correlation with mRSS (γ=0.553, p=1.77×10 -10 and γ=0.501, p=1.39×10 -8, respectively), and which were followed by mitogen-activated protein kinases (MAPK) and TGFβ signalling pathways (γ=0.431, p=1.67×10 -6 and γ=0.418, p=3.55×10 -6, respectively).

(A) Levels of clinical variables by systemic sclerosis (SSc) subgroup. Comparison between the two subgroups was done by t-test. *P<0.05; **P<0.01; ***P<0.001. (B) Correlation between modified Rodnan skin score (mRSS) and pathway activation score. Correlation analysis was performed by Pearson’s method, and p value at the x-axis was log scaled for better visualisation. (C) Correlation of variations between mRSS and pathway enrichment scores. Correlation analyses for the 27 paired samples of baseline and 24-week follow-up by subcutaneous tocilizumab therapy in patients with diffuse subset SSc (GSE106358) were performed using Spearman’s method. ΔmRSS was positively correlated with Δenrichment score of phosphoinositide-3-kinase-protein kinase B (PI3K-Akt) (γ=0.407, p=0.034) and Janus kinase-signal transducers and activators of transcription (JAK-STAT) signalling pathways (γ=0.389, p=0.045) and dermatan sulfate biosynthesis (γ=0.466, p=0.014). (D) Evolution of the cluster (left panel) and change of mRSS by clusters (right panel) after 24 weeks.
The transcriptomic data set of GSE106358 includes 27 paired samples of baseline and 24-week follow-up patients in the placebo-treated arm from clinical trials, subcutaneous tocilizumab therapy in patients with dSSc.29 To investigate the correlation between variation in mRSS and pathway enrichment score, single sample GSEA was used to generate enrichment scores for gene sets of 40 SSc-relevant pathways and the differentials (Δ) before and after treatment were calculated. The ΔmRSS was significantly correlated with Δenrichment score of PI3K-Akt signalling pathway (γ=0.407, p=0.034), Janus kinase-signal transducers and activators of transcription (JAK-STAT) signalling pathway (γ=0.389, p=0.045) and dermatan sulfate biosynthesis (γ=0.466, p=0.014) (figure 5C and supplementary figure S9). This implies that improvement in mRSS was accompanied by proportional mitigation of PI3K-Akt signalling, JAK-STAT signalling and dermatan sulfate biosynthesis and vice versa. Next, we compared the change in mRSS by cluster (figure 5D). The mRSS was significantly reduced in cluster 2 (p=0.040), while variable responses were observed with no significant improvement in mRSS in clusters 1 and 4 (p=0.677 and p=0.438, respectively).
Enrichment of PI3K-Akt signalling pathway and its leading-edge genes
In GSEA, the PI3K-Akt signalling pathway was identified as one of the most enriched gene sets (false discovery rate <0.001) in dSSc (figure 6A). To identify which genes in the gene sets were enriched in the PI3K-Akt signalling pathway, we focused on the ‘leading edge’ of enrichment. Leading-edge genes in a GSEA are those that contribute most to the enrichment of a particular gene set and include the most significantly upregulated genes in a given gene set.30 In total, 94 leading-edge genes were captured, and the top 10 genes are shown as a heatmap in figure 6B. There are five genes left except for the collagen family: COMP, THBS4, THBS1, TNC and FN1. Expression values of these genes were closely correlated with mRSS in patients with dSSc (all γ>0.4, p<0.001) (figure 6C).

Enrichment of the phosphoinositide-3-kinase-protein kinase B (PI3K-Akt) signalling pathway and its leading-edge genes. (A) Enrichment plot generated by gene-set enrichment analysis (GSEA) analysis of ranked gene expression data (left, upregulated (red); right, downregulated (blue)) by the PI3K-Akt signalling pathway in diffuse subset systemic sclerosis (dSSc) versus normal controls (NC). (B) GSEA-derived heatmap of the top 10 leading-edge genes showing the strongest upregulation in dSSc versus NC based on a signal/noise ratio score. (C) Correlation between the expression values of the leading-edge genes and modified Rodnan skin score (mRSS) in patients with dSSc. Correlation analysis was performed using Pearson’s correlation as a similarity measure.
Discussion
In the present study, we built the largest cohesive SSc transcriptomics compendium to understand differential expression patterns and to identify key players, potential drug targets and distinct patient clusters. Unbiased cluster analysis of the dSSc compendium resulted in meaningful categories of patients with dSSc with distinct activities for relevant pathways. This pathway-based analysis allowed refinement of our understanding of dSSc subgroups and allowed us to discover promising target pathways and biomarkers that have a close correlation with the clinical index.
To refine the SSc-unique genes, we compared SSc samples with NC and adopted DEGs shared by three independent methods. We found that 14 of the DEGs are known SSc-associated genetic loci and 89 DEGs occupy a central position in the molecular skin network. Because functional implications of high-risk alleles were often obscure, it was helpful to elucidate the biological mechanisms in which risk alleles operate. CTGF, HCK, LYN and PDGFRB were the targets, having hub positions in the network. CTGF is a secreted matricellular protein contributing to tissue remodelling and fibrosis in cooperation with TGFβ.31 32 Administration of anti-CTGF antibodies reduced or reversed fibrosis in animal models with various stages of fibrotic disease.31 32 HCK, LYN and PDGFRB were all understood in terms of activation of intracellular tyrosine kinases,15 which were proven to play key roles in the pathologic activation of fibroblasts during fibrogenesis.33 34 However, a discrepancy exists between the encouraging preclinical results in animal models and the disappointing clinical experiences of several tyrosine kinase inhibitors.15 We also found enrichment of the type I IFN signature in unaffected skin areas of dSSc. This result corroborates systemic activation of the type I IFN signature, independent of overt fibrosis.35 36
We were able to identify four distinct subgroups through NMF analysis of the dSSc compendium, and they differed in activation levels of SSc-relevant signalling pathways. This was commensurate with the result by intrinsic gene subsets analysis,5 6 and inflammatory types were further subdivided into two subgroups (cluster 1 and 2) by the predominance of Notch/Hedgehog or TGFβ signalling pathways. Cluster 4 was most active in profibrotic pathways (TGFβ, Apelin, PI3K-Akt and PDGF signalling pathways) and extracellular matrix organisation and was graded highest in mRSS on average. Given the short disease duration in cluster 2 (figure 5), cluster 2 was counted as the early inflammatory phase and showed a better clinical outcome because it has a strong immunoinflammatory nature with reversibility, unlike irreversible fibrotic change.
However, it is not clear that these clusters are simply linked to the stage of SSc clinically because the progression of skin fibrosis and thickening is variable.37 Disease duration varied widely across the clusters, although mean disease duration was the longest in cluster 1 and the shortest in cluster 2. This pathway-driven clustering may provide a good starting point for understanding the divergent mechanistic features and clinical trajectory of SSc. Future clinical trials can account for the categorisation by performing deep profiling on study participants and conducting a differential analysis for prognosis. This approach can also be used in the clinical setting to determine whether certain groups of patients are more responsive to investigational drugs than other types of patients.38 It would also be interesting to investigate whether the distinct subgroups have different correlations with occurrence or severity of other complications, such as interstitial lung disease and pulmonary arterial hypertension.
Dysregulation of multiple cellular and molecular components and activation of profibrotic processes converge towards the progressive tissue accumulation of fibrous matrix, which is the distinguishing hallmark of SSc.1 23 Among the prevailing pathways, the activity of PI3K-Akt pathway not only had the closest correlation with mRSS but also shifted in parallel with the changes in mRSS. PI3K is a downstream molecule of the TGFβ and PDGF signalling pathways,1 and PI3K inhibition was found to effectively reverse or alleviate organ fibrosis in vivo.39 40 Many clinical trials have failed in the past for several reasons, including choosing the wrong target pathways or molecules.15 41 In this context, inhibition of the PI3K-Akt pathway should be reappraised as a promising antifibrotic therapy. A number of investigational agents inhibiting the PI3K-Akt pathway in clinical trials for specific cancers can be adopted for SSc research.42
Not all members of a gene set participate in a specific biological process at all levels; the core of a gene set accounts for the enrichment signal.30 In this study, we filtered the top 10 leading-edge genes for enrichment of the PI3K-Akt pathway, and focused on five genes, excluding the collagen family: cartilage oligomeric matrix protein (COMP), thrombospondin-1 (THBS1), thrombospondin-4 (THBS4), fibronectin 1 (FN1) and tenascin-C (TNC). All of these seem to represent the extent of skin fibrosis because they have a strong correlation with mRSS. Notably, COMP (also known as thrombospondin-5) is produced by dermal fibroblasts and plays a key role in assembly and maintenance of the fibrillar collagen extracellular network.43 Our results corroborated that COMP expression both in skin and blood is closely correlated with mRSS, assessed by cross-sectional and longitudinal analyses.43 44 THBS1 is also an essential regulator in various fibrotic diseases by activating the latent TGFβ.45 FN1 and TNC are connective tissue molecules, which are induced by TGFβ and constitutively upregulated in SSc.46 47 They drive skin fibrosis by stimulating collagen gene expression and myofibroblast transformation via toll like receptor 4 signalling.46 47 The leading-edge genes for enrichment of the PI3K-Akt pathways were the product of activated fibroblasts, and in turn, they can further stimulate fibroblasts through the PI3K-Akt pathway.48 49 Therefore, the interruption of the PI3K-Akt signalling pathway is an ideal target for decelerating this feed-forward loop.
There are some limitations to address in this study. First, removing batch effects is not ideal because it adds to the noise in the compendium. Second, we did not address the association of each SSc subgroup with other clinical factors, such as interstitial lung disease, pulmonary hypertension and autoantibodies, because of lack of complete annotation for each SSc sample. Third, minority signatures by specific cell subsets might have been diluted because the gene expression signature was at the tissue level. SSc is a major medical challenge with high unmet need, and no drug has been able to halt the fibrotic process or modify the clinical course. Efforts focusing on the application of advanced machine learning techniques, such as in this work, enable a better understanding of SSc at a systems level.
Acknowledgments
We thank Katrina Krogh, MD, from Edanz Group (www.edanzediting.com/ac) for editing a draft of this manuscript.
References
Footnotes
Handling editor Josef S Smolen
Contributors K-JK and S-JM designed the study and carried out data collection. K-JK performed computational analysis and drafted the paper, but all authors were involved in critically revising its final preparation. All authors approved the final version to be published.
Funding This work was supported by the National Research Foundation of Korea (NRF) grant funded by the Korea government (MSIT) (No NRF-2018R1A2B6007291).
Competing interests None declared.
Patient consent for publication Not required.
Provenance and peer review Not commissioned; externally peer reviewed.