Article Text

Abstract
Objectives Rheumatoid arthritis (RA) is an autoimmune disease accompanied by lymphocyte infiltration into joint synovium. While T cells are considered to be important for its pathogenesis, the features that are the most relevant to disease and how they change after treatment remain unclear. The aim of this study was to clarify the characteristics of T cells in RA, comprehensively.
Methods We enrolled a total of 311 patients with RA and 73 healthy participants, and carefully classified them by disease state, constructed multiple cohorts and analysed clinical samples from them in a stepwise manner. We performed immunophenotyping with multiple evaluation axes, and two independent transcriptome analyses complementary to each other.
Results We identified that ‘effector memory-Tfh’ subset was specifically expanded in the peripheral blood (PB) of patients with RA in correlation with disease activity, and reverted after treatment. Besides, we revealed distinct features of T cells in synovial fluid (SF) that the expression of Tfh/Tph-related genes and pro-inflammatory cytokines and chemokines, including CXCL13, were significantly enriched, whereas these phenotype were Th1-like. Finally, we identified specific pathways, such as mTORC1, IL-2-stat5, E2F, cell cycle and interferon-related genes, that were significantly enriched in SF, in particular, as well as PB of untreated patients with RA, and notably, these features reverted after treatment.
Conclusion Our multi-dimensional investigation identified disease relevant T-cell subsets and gene signatures deeply involved in pathogenesis of RA. These findings could aid in our understanding of essential roles of T cells in RA and will facilitate to development better diagnostic and therapeutic interventions.
- rheumatoid arthritis
- T cell
- synovial fluid
This is an open access article distributed in accordance with the Creative Commons Attribution Non Commercial (CC BY-NC 4.0) license, which permits others to distribute, remix, adapt, build upon this work non-commercially, and license their derivative works on different terms, provided the original work is properly cited, appropriate credit is given, any changes made indicated, and the use is non-commercial. See: http://creativecommons.org/licenses/by-nc/4.0/.
Statistics from Altmetric.com
Key messages
What is already known about this subject?
Multiple observations from various studies and therapeutic reactivities suggest that T cells play an important role in the pathogenesis of rheumatoid arthritis (RA); however, the T-cell features that are most relevant to the disease and how they change in response to treatment remain unclear.
What does this study add?
We found two disease-relevant subsets, effector memory-Tfh and effector memory T helper 17, by immunophenotyping using multi-axis evaluation.
Disease-driving pathways, such as mTORC1, IL-2-stat5, cell cycle, E2F and interferon-related genes, and the list of differentially expressed genes including several pro-inflammatory cytokines and chemokines were identified by non-biased comprehensive gene expression analyses.
How might this impact on clinical practice or future developments?
Our finding could deepen understanding of essential roles of T cells in RA, and will facilitate to develop better diagnostic and therapeutic interventions in future.
Introduction
Rheumatoid arthritis (RA) is a common autoimmune disorder characterised by lymphocyte infiltration and chronic inflammation of the synovial tissues and progressive joint disability.1 Both genetic and environmental factors influence its pathogenesis, and the strongest contributor to disease heritability is the major histocompatibility complex (MHC) class II, which is involved in antigen presentation to CD4+ T cells.2 Genes associated with RA risk alleles outside the MHC locus are also preferentially expressed in CD4+ T cells,3 4 and multiple lines of evidence from both genetic and clinical research indicate a central role for autoreactive CD4+ T cells in RA pathogenesis.5 Emerging evidence also points to a role for CD8+ T cells in RA.6 A subset of CD8+ T cells was found to be essential for ectopic germinal centre formation in the synovial membrane in RA,7 and clonal expansion was observed for CD8+ T cells but not for CD4+ T cells in newly diagnosed patients with RA.8
Despite convincing evidence for T-cell involvement in RA pathogenesis, the specific cell subsets and states that drive the disease have been challenging to identify since T cells are highly heterogeneous, displaying diverse surface markers, developmental and activation states, and effector functions, which has led to multiple systems of classification. Functionally, CD4+ T cells are classified into many subfractions, such as Th1, Th17, Treg, Tfh9 10 and, recently, peripheral helper T (Tph),11 many of which have been reported to be involved in RA.12–15 In terms of classification by developmental stage, peripheral blood (PB) CD4+ T cells are classified into four stages (naïve (Tn), stem cell memory (Tscm), central memory (Tcm) and effector memory (Tem)), whereas CD8+ T cells are classified into five stages (Tn, Tscm, Tcm, Tem and CD45RA-positive effector memory (Temra)). To further complicate matters, the axes for the various classification systems are not independent. For example, in PB, Th1 and Th17 fractions are enriched in Tcm and Tem, whereas the Tfh fraction is enriched in Tscm and Tcm but is hardly expressed in Tem.16 Additionally, T-cell profiles vary widely depending on their anatomical localisation. In RA, synovial fluid (SF) T cells are more developed and more activated and have different cytokine production profiles than what is observed in T cells in PB.17–21
Other factors that should be considered in RA studies are age and therapy. T cells develop immunosenescence in the elderly, which results in a decrease in the naïve pool and a relative increase in the memory subset.22 23 Because RA can occur across a wide range of ages, study results can vary depending on its cohort. Treatments for RA have advanced in recent years, and several therapeutic drugs with different modes of activity are used. Many studies have reported changes in T-cell subsets as a result of these treatments. Consistent changes have been reported in some studies (eg, increase in Treg after tocilizumab (TCZ)),24 25 however, others have reported conflicting results (eg, decrease26 or stable levels24 of Th17 after TCZ).
To overcome these issues and clarify the characteristics of T cells in RA, we collected a large number of samples from clinically well-defined cohorts of patients with RA and age-matched healthy controls (HCs), and analysed them in a stepwise manner. Here, we report the phenotypic and transcriptomic features of T cells in RA.
Methods
Detailed methods were described in online supplementary file 1 and online supplementary figure S1-3. We prospectively recruited a total of 311 patients with RA and 73 HCs over a period of 5 years from 2012 to 2017. We carefully classified the patients by disease state, constructing multiple cohorts necessary for various consecutive analyses. There were eight cohorts in this study; cohorts 1 and 2 were performed immunophenotyping of PB with single parameter evaluation, cohorts 3 and 4 were performed immunophenotyping of PB with double-axes evaluation, cohort 5 was performed comparison of immunophenotyping between PB and SF, cohorts 6 and 7 were performed transcriptome analysis, and cohort 8 was performed proliferation assay.
Supplemental material
Supplemental material
Results
Comparing peripheral T-cell subsets between RA and HC, single-axis immunophenotyping
Figure 1 shows the results from the immunophenotyping of CD4+ (panels A, C and D) and CD8+ (panel B) T-cell subsets in PB from 53 untreated patients with RA and 30 age-matched and gender-matched HCs (cohort 1; online supplementary table S2). Significant increases were observed for Tscm, Tem and activated cells (HLA-DR+) in CD4+ T cells, Tscm and Temra in CD8+ T cells, and Tfh (especially Tfh2) and Treg in polarity. However, none of the subsets were positively associated with disease activity score (DAS28-erythrocyte sedimentation rate (ESR); online supplementary figure S4). We next examined the effect of age and gender for cell proportion and found that developmental stage of both CD4+ and CD8+ T cells was correlated with age (see online supplementary figure S5). Therefore, we performed multiple regression and confirmed that the increase in Tscm and Tem in CD4+, Temra in CD8+, and Tfh and Treg in polarity was affected by RA (see online supplementary table S3).

Characterisation of T cells from PB of patients with RA according to developmental stage, activation status, and polarity. PBMCs from 53 patients with RA and 30 HCs were immunophenotyped. The proportions of cells in each developmental stage (Tn, Tscm, Tcm, Tem and Temra) and activated cells (DR+) in (A) CD4+ and (B) CD8+ T cells from HC (blue) and patients with RA (red) are shown. The proportions of (C) polarised T-cell subsets and (D) the Tfh subfraction in CD4+ T cells from HC (blue) and patients with RA (red) are shown. Wilcoxon rank sum test. *p<0.05, **p<0.01, ***p<0.001. HCs, healthy controls; PB, peripheral blood; PBMCs, PB mononuclear cells; RA, rheumatoid arthritis; Tcm, central memory T cell; Tem, effector memory T cell; Tn, naïve T cell; Tscm, stem memory T cell; Temra, effector memory rheumatoid arthritis T cell.
Treatment effect on peripheral T-cell subset, single-axis immunophenotyping
Next, we examined the effect of RA treatment on immunophenotyping. A new cohort, which consist of 49 naïve patients with disease-modifying antirheumatic drugs (DMARD) who were treated with methotrexate (MTX) alone (MTX group; 40/49 were followed from cohort 1), 46 patients who were resistant to DMARD for whom infliximab (IFX) was added to their medication (IFX group) and 28 patients who were resistant to DMARD for whom TCZ was added to their medication (TCZ group), were recruited (cohort 2; online supplementary table S4). PB mononuclear cells (PBMCs) were collected at 0, 3, 6 and 12 months after treatment initiation, and we examined the statistical change from baseline using paired test. To alleviate variation due to temporary changes, only variables that were significantly different from baseline at two or more time points after treatment initiation were considered to have changed.
Significant changes were observed mainly in the MTX group (see online supplementary figure S6). The pattern of changes observed in the MTX group was the opposite of the characteristic changes of RA described above: after treatment, patients showed an increase in CD4-Tn, a decrease in CD8-Tem and a decrease in CD4- and CD8-HLA-DR+. In addition, Th1, Th17 and Treg were decreased after MTX treatment, whereas Tfh2 and Tfh17 were increased. Therefore, MTX treatment appears to broadly suppress T-cell activation and polarisation except for the Tfh subpopulation.
In the IFX and TCZ groups, the effect of treatment was not as prominent, which is notable considering that RA disease activity was substantially improved by these treatments, probably because MTX had in many cases been used prior to the biologics. The IFX group showed increases in CD8-HLA-DR+, Th1/17 and Tfh, and decrease in Treg, while the TCZ group showed increase in Tfh and decrease in Th1. We observed that Treg tended to be increased after TCZ treatment as previously reported,24 this change was not statistically significant.
Identification of Tem-Th17 and Tem-Tfh as disease activity-related subsets, multi-axes immunophenotyping
To identify T-cell subsets more accurately reflecting RA pathogenesis, we evaluated CD4+ T cells along two axes, developmental state and polarity, simultaneously. We recruited a new cohort consisting of 12 patients who were DMARD naïve and 16 age-matched and gender-matched HCs (cohort 3; online supplementary table S5).
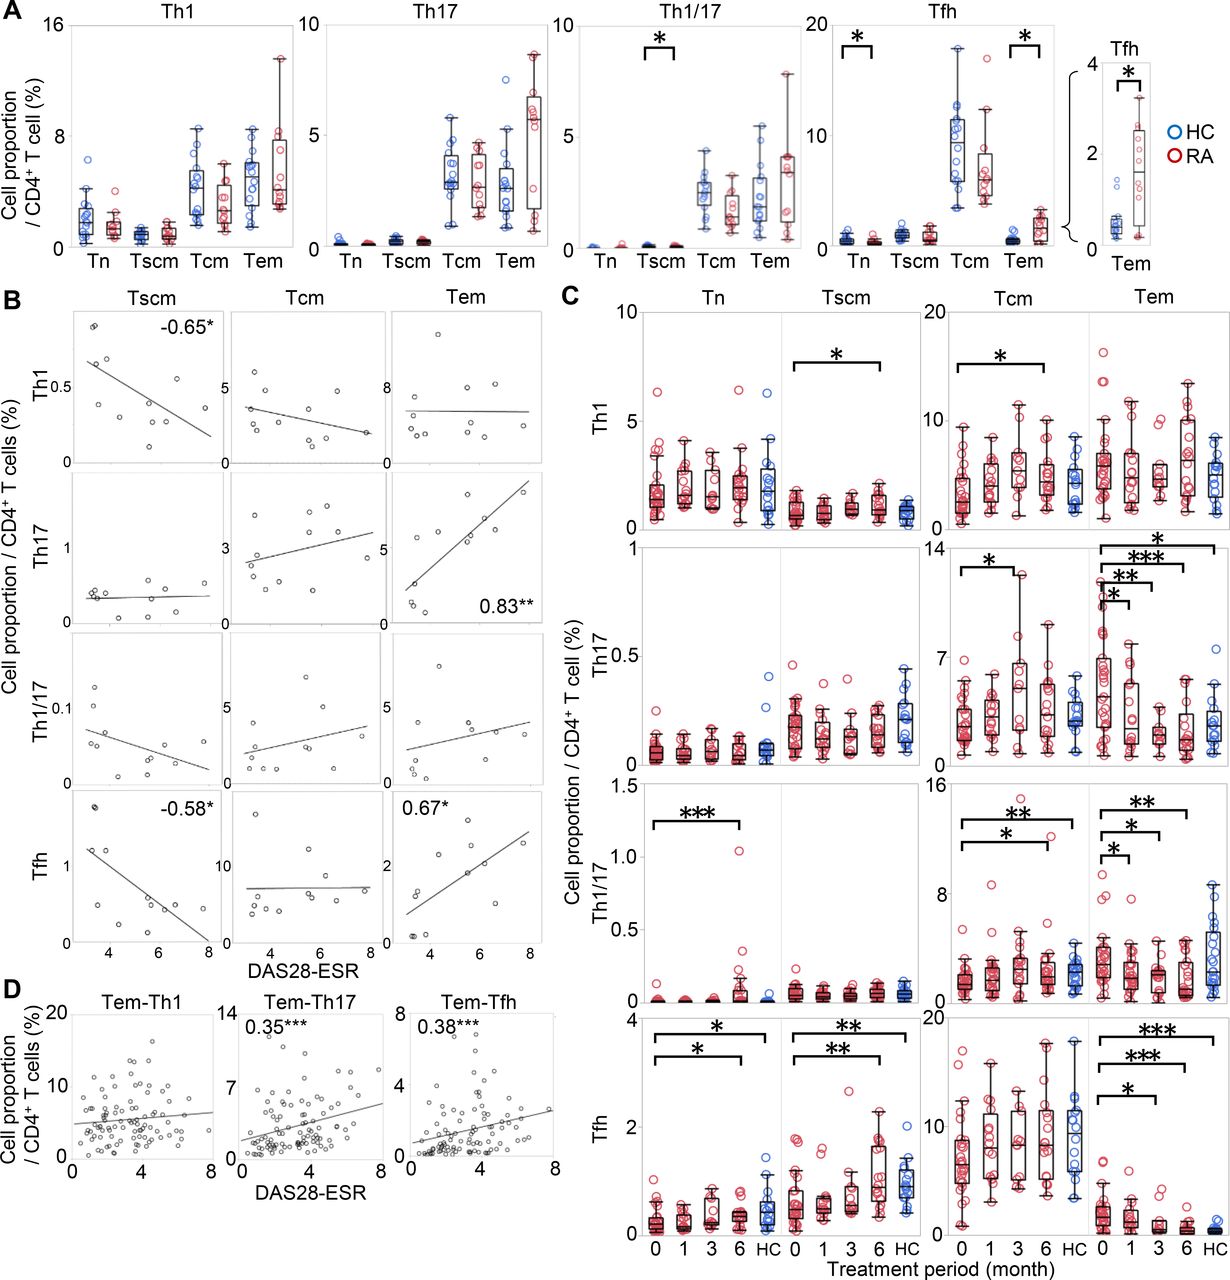
As shown in figure 2A, significant difference was observed in the distribution of Tfh. Tem-Tfh, which was hardly observed in HC, was approximately four times more abundant in RA (HC, 0.4%; RA, 1.6%, median), while Tn-Tfh were less abundant. Tem-Th17 also tended to be higher in RA (HC, 2.6%; RA, 5.7%, median), though this difference was not statistically significant. These characteristics of T cell in RA did not change even after multivariate analysis using age (see online supplementary table S6).

Two-dimensional analysis of T cells from PB of patients with RA according to development and polarity. CD4+ T cells from 12 patients with RA and 16 HCs were immunophenotyped simultaneously along two axes: development and polarity. (A) The proportions of Tn, Tscm, Tcm and Tem were evaluated via a Th1, Th17, Th1/17 and Tfh polarising marker as shown for HC (blue) and RA (red). Wilcoxon rank sum test. (B) The correlations between the proportions of each T-cell subset and DAS28-ESR are shown. The columns represent developmental stages, and the rows represent polarity. The numbers indicate correlation coefficients in Spearman's test. (C) CD4+ T cells from 27 patients with RA who started MTX or biologics were immunophenotyped simultaneously along two axes at 0, 1, 3 and 6 months after the start of treatment. The changes in Th1, Th17, Th1/17 and Tfh cell proportions at each developmental stage are shown in red. For reference, the proportions in HC (shown in figure 2A) are represented in blue. Wilcoxon signed-rank test compared with 0 month. (D) The correlations between the cell proportion of Tem-Th1, Tem-Th17, and Tem-Tfh and DAS28-ESR were measured at all time points in all patients. The numbers indicate correlation coefficients in Spearman's test. *p<0.05, **p<0.01, ***p<0.001. DAS28-ESR, disease activity score-erythrocyte sedimentation rate; HCs, healthy controls; MTX, methotrexate; PB, peripheral blood; PBMCs, PB mononuclear cells; RA, rheumatoid arthritis; Tcm, central memory T cell; Tem, effector memory T cell; Tn, naïve T cell; Tscm, stem memory T cell; Temra, effector memory rheumatoid arthritis T cell.
Additionally, the proportions of Tem-Th17 and Tem-Tfh were highly positively correlated (ρ = 0.83 and 0.67, respectively) with DAS28-ESR (figure 2B), whereas other subsets were negatively or not correlated. Among the Tem-Tfh subfractions, Tem-Tfh1, Tem-Tfh2 and Tem-Tfh1/17 were increased in untreated patients with RA, and Tem-Tfh2 and Tem-Tfh17 were correlated with DAS28-ESR (see online supplementary figure S7A-B).
We further examined whether the proportions of these subsets were changed by treatment. To this end, we recruited a new cohort consisting of 27 patients with RA who started treatment with MTX or patients who were resistant to csDMARD and started biologics (cohort 4; online supplementary table S7). Interestingly, the proportion of Tem-Th17, Tem-Th1/17 and Tem-Tfh decreased over time with treatment, whereas the other subsets showed a slight increase or no change (figure 2C). Among Tem-Tfh, all subfractions decreased after treatment (see online supplementary figure S7C). The observed correlation of the Tem-Th17 and Tem-Tfh with DAS28-ESR was also observed in a composite analysis across all treatment time points (figure 2D).
Thus, by evaluating CD4+ T cells simultaneously along two axes, we revealed that Tem-Th17 and Tem-Tfh were the most relevant subsets to disease that were correlated with disease activity in untreated phase, and decreased after treatment.
Comparing T-cell subsets between SF and PB, single-axis immunophenotyping
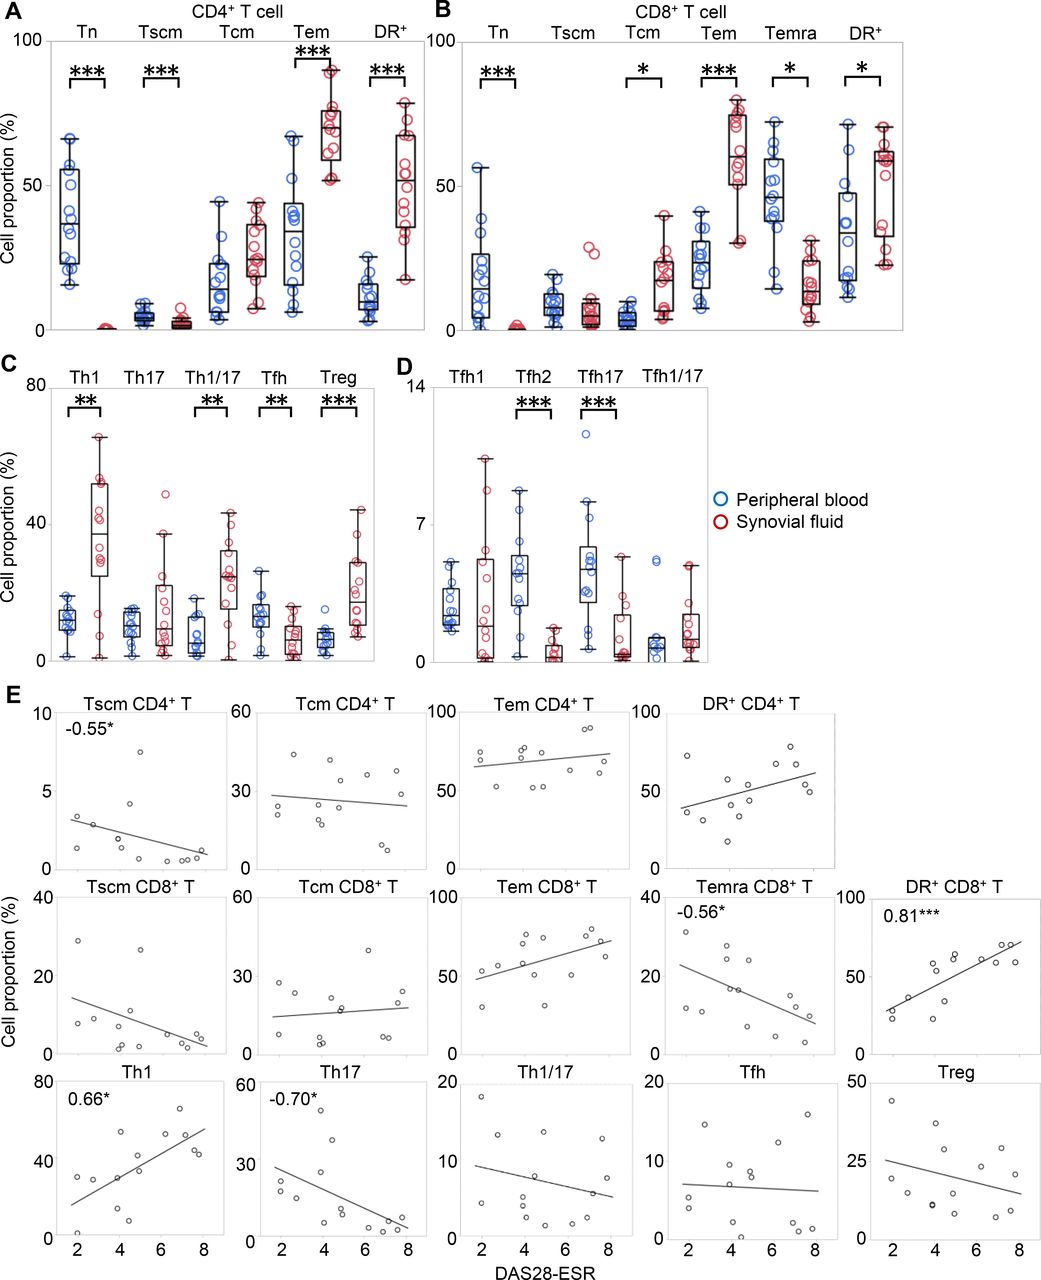
Since T cells in SF have been reported to be mostly memory fractions, with their polarity being disparate from that observed in PB,17 18 a well-defined comparative analysis of both PB and SF is necessary to fully characterise T-cell distribution in RA. Therefore, we collected 14 paired samples of SF and PB from the same patients undergoing joint centesis (cohort 5; online supplementary table S8). Consistent with previous studies,17 our results showed that the majority of SF T cells were Tem cells, which accounted for 50%–70% of the total CD4+ and CD8+ T cells (figure 3A–B). We also examined recently discovered Tscm in SF for the first time. Notably, we found that cells that were previously ‘so-called’ naïve were in fact mostly Tscm while true Tn were almost absent in SF. The proportion of activated cells was also high in SF.

The comparison of T-cell subsets in SF and PB. Paired samples of SF and PB were collected from 14 patients undergoing joint centesis. The proportion of cells in each developmental stage and activated cells in (A) CD4+ and (B) CD8+ T cells, (C) polarised T-cell subset, and (D) Tfh subpopulation in PB (blue) and SF (red) were evaluated individually for each patient. Wilcoxon rank sum test. (E) The correlations between the proportion of each subset and DAS28-ESR are shown. Numbers indicate correlation coefficients in Spearman's test. *p<0.05, **p<0.01, ***p<0.001. DAS28-ESR, disease activity score-erythrocyte sedimentation rate; PB, peripheral blood; SF, synovial fluid; Tcm, central memory T cell; Tem, effector memory T cell; Tn, naïve T cell; Tscm, stem memory T cell.
The polarity of CD4+ T cells in SF has been reported to be substantially different from that in PB. Our results indicate that there were more Th1, Th1/17 and Treg in SF than in PB, consistent with previous reports18 20 (figure 3C). Interestingly, Tfh, which are prominent in PB of RA, were significantly reduced in SF. In addition, Tfh2 and Tfh17, the proportions of which in PB were correlated with DAS28-ESR, were also significantly reduced in SF (figure 3D).
We also checked the correlation between the proportions of each subset in SF and DAS28-ESR (figure 3E). The proportions of Th1 and CD8-HLA-DR+, which were increased in SF, positively correlated with DAS28-ESR, while the proportions of CD4-Tscm, CD8-Temra and Th17 negatively correlated with DAS28-ESR.
Pathways downregulated by TCZ treatment, gene expression analysis
Since immunophenotyping can only examine known cell populations with specific markers, we decided to perform two transcriptomic analyses to gain a broader understanding of T-cell changes in RA. First, we compared paired PB samples before and after treatment from six patients with RA who met the following conditions: had moderate to high disease activity before treatment, had received TCZ treatment for 6 months and achieved remission after treatment (cohort 6; online supplementary table S9). Whole CD4+ and CD8+ T cells were sorted from frozen PBMC and subjected to transcriptomic analysis.
First, we performed principal component analysis (PCA) and unsupervised clustering (figure 4A–B). Interestingly, the samples were clustered by each individual rather than by positivity for CD4/8 or treatment status. Therefore, we first extracted the difference between pre-treatment and post-treatment for each patient to eliminate inter-individual variation. Lists consisting of 858 and 950 differentially expressed genes (DEGs) were created for CD4 and CD8, respectively (see online supplementary data 1), and were used for enrichment analysis (figure 4C–D, online supplementary data 2). Pathways that were downregulated after TCZ treatment in both CD4+ and CD8+ T cells included mechanistic target of rapamycin complex 1 (mTORC1) signalling, which is involved in T-cell metabolism, differentiation, and function;27 the interleukin-2 (IL-2) pathway, which is essential for lymphocyte proliferation; and interferon (IFN)-related pathways, which were previously reported in RA.28 29 In addition, pathways related to cell cycle were downregulated in CD8+ T cells after treatment. These findings indicate that TCZ broadly suppressed activation and proliferation in both CD4+ and CD8+ T cells.

Changes in immune-related pathways in T cells from patients with RA after TCZ treatment. PBMCs from six patients with RA before and at 6 months after the start of TCZ monotherapy were collected and cryopreserved until use. CD4+ and CD8+ T cells were sorted from PBMCs, and a transcriptome analysis was performed using an Ion AmpliSeq Transcriptome Human Gene Expression Kit. One sample of CD8+ T cells could not be analysed due to a lack of sufficient RNA. (A) Hierarchical clustering of all samples was performed. Red and blue colours indicate increased and decreased expression, respectively. (B) PCA analysis of CD4+ and CD8+ T cells was performed. Black circles indicate samples that were derived from the same patient. (C–D) Differentially regulated pathways were identified by enrichment analysis. DEGs between before and after TCZ treatment were extracted based on a p value <0.05 and an absolute fold change >1.2 (see online supplementary data 1), and enrichment pathways based on a p value <10−5 were shown (see online supplementary data 2). DEGs, differentially expressed genes; PBMCs, peripheral blood mononuclear cells; PCA, principal component analysis; RA, rheumatoid arthritis; TCZ, tocilizumab.
Comparison of T cells sorted by developmental stages, gene expression analysis
To complement the earlier comparative approach within each patient, we performed another transcriptomic analysis that compared samples from patient group. Ten patients each of the following five groups were enrolled: Age-matched and gender-matched HCs, untreated patients with RA (RA-NT), patients treated by MTX monotherapy (RA-MTX), combination therapy of MTX and IFX (RA-IFX), and TCZ monotherapy (RA-TCZ). CD4-Tn/Tcm/Tem and CD8-Tn/Tcm/Tem/Temra were sorted from their PB. In addition, four samples of CD4-Tcm, three samples of CD4-Tem and one sample of CD8-Tcm from SF mononuclear cells (RA-SF) were included. In total, 358 samples from 54 individuals were underwent transcriptome analysis (cohort 7; online supplementary table S10).
We performed PCA and unsupervised clustering separately on CD4+ and CD8+ T cells (figure 5A–B, online supplementary figure S8A-B). Notably, sample clustered according to developmental stage rather than according to the presence of RA or treatment status. First principal component (PC1) was strongly associated with developmental stage, and PC2 was associated with developmental stage, DAS28-ESR and disease status (see online supplementary figure S8C). Of note, eight samples from RA-SF were distinct in these results because they shifted to the right on the PC1 component towards a more advanced developmental stage in figure 5A–B.

Transcriptomic analysis of T cells from PB and SF of patients with RA. PBMCs were collected from 10 patients each of the following five groups: HCs, untreated RA (RA-NT), MTX monotherapy (RA-MTX), combination therapy of MTX and IFX (RA-IFX), and TCZ monotherapy (RA-TCZ). SF mononuclear cells (four samples of CD4-Tcm, three samples of CD4-Tem and one sample of CD8-Tcm) were collected from four patients. From these, we freshly sorted CD4+ Tn, Tcm, and Tem and CD8+ Tn, Tcm, Tem, and Temra and performed a transcriptomic analysis. (A–B) PCA analysis of CD4+ and CD8+ T cells was performed. The shapes indicate patient groups, and colours indicate developmental stages. Samples obtained from SF are indicated with arrows. (C) The numbers of overlapped DEGs based on a p value <0.05 and an absolute fold change >1.2 between RA-SF and HC from CD4-Tcm, CD4-Tem and CD8-Tcm, respectively (see online supplementary data 4) were shown. (D–H) Normalised gene expression levels related to Th1, Th17, Tfh, Treg and Tph are shown. Some genes related to polarity, such as CXCR3 and IL17, were not included in the Ion AmpliSeq Transcriptome Human Gene Expression Kit. (I–J) An enrichment analysis was conducted based on a p value <10−5. The top 10 pathways enriched in SF-derived CD4-Tcm and CD4-Tem are shown (full pathway list, see online supplementary data 5). Orange indicates upregulated pathways, and blue indicates downregulated pathways. DEGs, differentially expressed genes; HCs, healthy controls; IFX, infliximab; PB, perpheral blood; PBMCs, PB mononuclear cells; PCA, principal component analysis; MTX, methotrexate; RA, rheumatoid arthritis; SF, synovial fluid; Tcm, central memory T cell; TCZ, tocilizumab; Tem, effector memory T cell; Tn, naïve T cell.
To comprehensively characterise the gene signature of T cells in RA pathogenesis, we next identified DEGs between RA-SF and HC, since SF is closest to RA lesion and is considered to best represent disease pathophysiology. Lists consisting of 3164, 3569 and 3316 DEGs were created for CD4-Tcm, CD4-Tem and CD8-Tcm, respectively, and among them, 908 genes were common to all three lists (figure 5C, online supplementary data 4). Furthermore, the most significant gene among these lists was identical, that was CXCL13. Many other cytokines and chemokines were also identified, including CSF1, CSF2, LIF, VEGFA, and CCL3, and their receptors, such as IL21R, CCR1, CCR5, and CXCR6 (see online supplementary figure S9). We next confirmed gene expression of the prominent cell populations in RA identified by immunophenotyping: Tfh (especially Tem-Tfh) and Treg increased in PB (figures 1–2), and Th1 and Treg increased in SF (figure 3). The transcriptome data were consistent with the immunophenotyping results to some extent: CXCR5 expression was higher in PB Tem in untreated RA than HC (figure 5D), and the expression of Th1-related and Treg-related genes were higher in SF than PB (figure 5E–F), whereas genes related to Th1 and Th17 were not differentially expressed between HC and RA (figure 5E,G). Although CXCR5 expression was low in RA-SF consistent with immunophenotyping, the expression of two other Tfh-related genes, IL21 and BCL6, was high in SF (figure 5D), which may reflect the presence of Tph.11 We confirmed that Tph-related genes, CXCR13, PDCD1, PRDM1 and BATF, were highly expressed in SF (figure 5H).
Identification of disease-driving pathways in RA T cell, gene expression analysis
We then performed an enrichment analysis using these DEGs between RA-SF and HC (see online supplementary data 5) and found that pathways related to cell cycle, mitosis, E2F, mTORC1 signalling, and IL-2-stat5 signalling (ie, the same pathways that were downregulated after TCZ treatment, as previously described in figure 4C–D) were highly enriched in both CD4-Tcm and CD4-Tem in SF (figure 5I–J). We also identified tumor necrosis factor-alpha (TNFα) and IL-6 signalling, both of which are current therapeutic targets,30 thus pointing to the high reliability of our results. We performed the same analysis to compare RA-SF and RA-NT (see online supplementary data 6-7) and found that the DEGs and pathways were not substantially different from that found between RA-SF and HC.
We next compared PB of RA and HC to reveal whether the disease-related pathways were also observed systemically. First, we compared HC with RA-NT and identified the differentially regulated pathways in untreated RA. Then, we compared RA-NT with patients after treatment (RA-MTX, RA-IFX and RA-TCZ) to see how they had changed by treatment. Interestingly, the pathways enriched in SF were also enriched in PB of untreated RA, although the statistical significance was lower than the comparison between SF and PB (figure 6A–B). Moreover, the pathways that were enriched in RA-NT were downregulated after treatment, and conversely, the pathways that were downregulated in RA-NT were reverted after treatment, shown as the colour changes of figure 6A–B. Additionally, these pathways were commonly enriched in several developmental stages and in both of CD4+ and CD8+ T cells. Representative pathways were visualised by heatmap and pathway map (figure 6C, see online supplementary figure S10-11).

Differentially regulated pathways in T cells from untreated and treated patients with RA. (A–B) Pathways that were differentially regulated in untreated patients with RA (RA-NT) relative to HC based on a p value <10−5, and among them, pathways that were differentially regulated in MTX-treated, IFX-treated and TCZ-treated patients (RA-MTX, RA-IFX and RA-TCZ) relative to RA-NT based on a p value<10−2 were extracted (full pathway list, see online supplementary data 8). The number of the columns indicates the p value for each. Orange indicates upregulated pathways, and blue indicates downregulated pathways. (C) Hierarchical clustering of representative pathways in each subset was shown. Red and blue colours indicate increased and decreased expression, respectively. CD4-Tn, Tcm and Tem and CD8-Tn, Tcm, Tem and Temra were freshly sorted from 13 untreated patients with RA (RA-NT), 10 patients receiving MTX (RA-MTX), 9 patients receiving TCZ (RA-TCZ) and 17 HCs. Sorted cells were labelled with dye, and cultured with CD3/28 beads for 5 days. (D) The proliferation index was calculated by FlowJo software, as shown. Wilcoxon rank sum test. (E) Representative cell trace violet dilution in gated live cells after culture for 5 days is shown. *p<0.05, **p<0.01, ***p<0.001. HC, healthy control; IFX, infliximab; MTX, methotrexate; Tcm, central memory T cell; TCZ, tocilizumab; Tem, effector memory T cell; Tn, naïve T cell.
The pathways that were identified above, such as cell cycle, E2F, IL-2-stat5 and mTORC1, are related to T-cell proliferation. Therefore, we confirmed whether the proliferation ability of RA T cells were high in vitro using a new cohort: 13 untreated patients with RA, 10 patients receiving MTX monotherapy, 9 patients receiving TCZ monotherapy and 17 age-matched and gender-matched HCs (cohort 8; 19/49 were the same patients as cohort 7, online supplementary table S11). Significant increase in proliferation was observed in five out of seven T-cell subsets obtained from untreated RA relative to HC, and TCZ treatment reverted them to the same level as HC, especially in developed T-cell subset (figure 6D–E). These findings support our overall analyses of the impact of RA and its treatment on T-cell distribution and function.
Discussion
In this study, we found that Tem-Tfh was specifically increased in patients with RA, and Tem-Tfh and Tem-Th17 were correlated with DAS28-ESR by simultaneously evaluating T cells along two axes. In addition, we listed the genes that are highly expressed in RA, which contained Tph-related genes, and identified disease-driving pathways such as cell cycle, E2F, IL-2-stat5 signalling and mTORC1, which were reproducibly detected in multiple comparisons in active RA, and reverted after treatment. The overview of our results were shown in online supplementary table S12.
Because our immunophenotyping results showed a large inter-individual variation in the proportion of T-cell subset, we performed the gene expression analyses using two experimental procedures for reducing individual variations. The advantages and disadvantages of each method were described in online supplementary file 2. Persistent IFN signalling and the shift towards Tfh response were reported in chronic viral infection,31 and increased Treg was observed in infectious and inflammatory disease such as chronic hepatitis,32 tuberculosis33 and sarcoidosis.34 Therefore, some of these characteristics of RA were considered the features of persistent immune activation.
mTORC1 is an evolutionarily conserved molecule that senses various stimuli, such as growth factors and nutrients.35 36 In T cells, mTORC1 is important for differentiation into Th1, Th17 and Tfh37 38 and for the effector function of CD8+ T cells.39 40 These functions are consistent with the features of RA T cells that were revealed in this study, such as a high proliferative capacity and Tfh response. mTOR has been reported to accelerate proliferation and invasion of synovial fibroblasts in RA41 42; however, our data are the first to show that mTORC1 is one of the disease-driving pathways in T cells. mTOR inhibitor has already been used for cancer therapy and immunosuppression after organ transplantation.43 The clinical effectiveness of mTOR inhibitors, rapamycin44 and everolimus45 has been confirmed in a few RA cases, and the roles of mTOR have been reported in large vessel vasculitis46; therefore, it was considered to be an attractive target of systemic autoimmune disease including RA.
Recently, Janus kinase (JAK) inhibitors have been approved for RA treatment. Four types of JAKs have been found in humans: IL-2-stat5 signalling uses JAK1 and JAK3, whereas IFN signature and IL-6-JAK-stat3 signalling use JAK1, JAK2 and Tyk2.47 Recently, another group reported that a specific gene module including JAK3 was enriched in RA and reverted after abatacept (CTLA4-Ig) treatment by comparison of multiple helper T-cell subsets.48 JAK3 locates downstream of IL-2-stat5, which is consistent with our results. Although it is not yet clear which JAK-suppressing therapy is most effective in RA, some of the clinical effects of JAK inhibitors may be due to the inhibition of these pathways.
Our results showed the importance of analysing cells at the disease site; however, it also becomes a limitation; the number of RA-SF samples was small due to less frequency of joint centesis. In particular, since CD8-Tcm from SF was only one sample, it was difficult to give meaning alone. Therefore, we focused on the pathways that are commonly expressed in all SF samples (CD8-Tcm, CD4-Tcm and CD4-Tem), and we confirmed that TNF and IL-6 signalling, the current treatment targets of RA, were included in our results. Another limitation is that we have not counted the absolute number of each subsets in immunophenotyping. Although it is controversial which of cell proportion or absolute number reflects the disease, it was better to analyse using absolute number in addition to the proportion of each subset.
In summary, we extensively and comprehensively investigated the characteristics of RA T cells in a stepwise manner, using multiple clinically well-defined cohorts. We revealed disease-relevant subset, Tem-Th17 and Tem-Tfh, in periphery, and high expression of Tfh/Tph- and Treg-related genes in SF. Furthermore, we identified a list of DEGs and pathways that were enriched in untreated RA and reverted after treatment. These findings highlight the significance of our multi-dimensional analysis in identifying disease-driving features that could aid in the development of better diagnostic and therapeutic interventions against RA.
Acknowledgments
We thank Harumi Kondo, Mayumi Ota, Yoshiko Yogiashi, Yuki Otomo, Fumitsugu Yamane and Miku Shimizu for helping with the experiments.
References
Footnotes
Handling editor Josef S Smolen
Contributors Study design: MT, KS, RM, KK, Y.Ka., KG, HM, YE, AY and TT. Data acquisition: MT, YK, KK, YK, MT and RK. Data analysis and interpretation: MT, KS, RM, YO, KK and YK. Manuscript drafting: MT, KS, YO and TT.
Funding This work was partly supported by Takeda Pharmaceutical Company Limited, Kanagawa, Japan (grant number 04-078-0067).
Competing interests YO, KK, YK, KG, MT, RK, HM and YE are employees of Takeda Pharmaceutical Company Limited. KS has received research grants from Eisai, Bristol-Myers Squibb, Kissei Pharmaceutical, and Daiichi Sankyo, and speaking fees from Abbie Japan, Astellas Pharma, Bristol-Myers Squibb, Chugai Pharmaceutical, Eisai, Fuji Film Limited, Janssen Pharmaceutical, Kissei Pharmaceutical, Mitsubishi Tanabe Pharmaceutical, Pfizer Japan, Shionogi, Takeda Pharmaceutical, and UCB Japan, consulting fees from Abbie, and Pfizer Japan. AY has received speaking fees from Chugai Pharmaceutical, Mitsubishi Tanabe Pharmaceutical, Pfizer Japan, Ono Pharmaceutical, Maruho, and Novartis, and consulting fees from GSK Japan. TT has received research grants from Astellas Pharma Inc, Bristol-Myers KK, Chugai Pharmaceutical Co. Ltd., Daiichi Sankyo Co. Ltd, Takeda Pharmaceutical Co. Ltd, Teijin Pharma Ltd, AbbVie GK, Asahikasei Pharma Corp, Mitsubishi Tanabe Pharma Co, Pfizer Japan Inc, and Taisho Toyama Pharmaceutical Co. Ltd, Eisai Co. Ltd, AYUMI Pharmaceutical Corporation, and Nipponkayaku Co. Ltd, and speaking fees from AbbVie GK, Bristol-Myers KK, Chugai Pharmaceutical Co. Ltd, Mitsubishi Tanabe Pharma Co, Pfizer Japan Inc, and Astellas Pharma Inc, and Diaichi Sankyo Co. Ltd, and consultant fees from Astra Zeneca KK, Eli Lilly Japan KK, Novartis Pharma KK, Mitsubishi Tanabe Pharma Co, Abbivie GK, Nipponkayaku Co. Ltd, Janssen Pharmaceutical KK, Astellas Pharma Inc, and Taiho Pharmaceutical Co. Ltd.
Patient consent for publication Not required.
Ethics approval Ethics approval was obtained from the Institutional Review Board of Keio University School of Medicine.
Provenance and peer review Not commissioned; externally peer reviewed.
Data availability statement Thetranscriptome data are available at the GEO database. The accession codes are GSE113156 and GSE118829. All custom computer codes in the generation or processing of the described data are available upon reasonable request.