Article Text

Abstract
Objectives Understanding the molecular mechanisms underlying human cartilage degeneration and regeneration is helpful for improving therapeutic strategies for treating osteoarthritis (OA). Here, we report the molecular programmes and lineage progression patterns controlling human OA pathogenesis using single-cell RNA sequencing (scRNA-seq).
Methods We performed unbiased transcriptome-wide scRNA-seq analysis, computational analysis and histological assays on 1464 chondrocytes from 10 patients with OA undergoing knee arthroplasty surgery. We investigated the relationship between transcriptional programmes of the OA landscape and clinical outcome using severity index and correspondence analysis.
Results We identified seven molecularly defined populations of chondrocytes in the human OA cartilage, including three novel phenotypes with distinct functions. We presented gene expression profiles at different OA stages at single-cell resolution. We found a potential transition among proliferative chondrocytes, prehypertrophic chondrocytes and hypertrophic chondrocytes (HTCs) and defined a new subdivision within HTCs. We revealed novel markers for cartilage progenitor cells (CPCs) and demonstrated a relationship between CPCs and fibrocartilage chondrocytes using computational analysis. Notably, we derived predictive targets with respect to clinical outcomes and clarified the role of different cell types for the early diagnosis and treatment of OA.
Conclusions Our results provide new insights into chondrocyte taxonomy and present potential clues for effective and functional manipulation of human OA cartilage regeneration that could lead to improved health.
- osteoarthritis
- knee osteoarthritis
- chondrocytes
This is an open access article distributed in accordance with the Creative Commons Attribution Non Commercial (CC BY-NC 4.0) license, which permits others to distribute, remix, adapt, build upon this work non-commercially, and license their derivative works on different terms, provided the original work is properly cited and the use is non-commercial. See: http://creativecommons.org/licenses/by-nc/4.0/
Statistics from Altmetric.com
Introduction
Osteoarthritis (OA) is the most common chronic condition associated with ageing and progressive joint dysfunction and the one with the greatest socioeconomic cost. OA is primarily characterised by disordered articular cartilage homeostasis with subsequent inflammation and degradation.1–4 Cartilage is a physiologically non-self-renewing avascular tissue and consists of chondrocytes.5 Despite accumulating reports on chondrocytes that have identified strategies to predict and modify OA progression, effective measures of disease-modifying OA diagnoses and outcomes are still lacking. A better understanding of the pathophysiology of inflammation and the mechanisms underlying the role of chondrocytes in the process leading to OA is of critical importance. Nevertheless, intense efforts have focused on the transplantation of tissue-engineered cartilage derived from stem cells and chondrocytes for cartilage regeneration in treating OA.6–8 However, OA cartilage cell-type composition, biochemical markers that can effectively predict OA and the cellular heterogeneity leading to OA progression remain largely unknown.
Articular cartilage is derived from condensed mesenchymal stem cells (MSCs), which subsequently differentiate into chondrocytes.9 10 Following this chondrogenesis, cells produce a collagenous extracellular matrix, a ground substance containing abundant collagen and proteoglycans. Studies have shown that the chondrocyte subtypes in articular cartilage include proliferative chondrocytes (ProCs), prehypertrophic chondrocytes (preHTCs) and hypertrophic chondrocytes (HTCs).11–13 ProCs are mainly found in the proliferative zone of growth plates, preHTCs have the capacity to modulate the onset of hypertrophic differentiation, while HTCs could regulate the mineralisation of the surrounding matrix in cartilage. Recently, senescent cells (SNCs) and cartilage progenitor cells (CPCs) were identified.2 5 14–17 SNCs assembled in OA cartilage were found to be cell-cycle-arrested and to exhibit features of a senescence-associated secretory phenotype.14 Selective elimination of SNCs attenuates OA development,14 15 whereas CPCs, which are specialised in their capacity for self-renewal, have the ability to differentiate along multiple lineages, express stem-cell-related surface markers and contribute to the maintenance of OA cartilage repair and homeostasis.5 17 These different chondrocyte subtypes were historically defined by a combination of their developmental origin, localisation, physical properties, morphology and molecular functions. However, because of their phenotypic heterogeneity and the limited number of available markers to identify, isolate and manipulate these cells, how to define the types of articular cartilage chondrocytes in human OA has still not been fully determined. These unknown parameters affect the ontogeny and function of each chondrocyte population in OA pathogenesis.
To study the molecular programmes involved in the relationships among cell populations, we performed single-cell RNA sequencing (scRNA-seq). This allowed us to better elucidate the endogenous heterogeneity of chondrocytes in human OA cartilage, uncover novel phenotypes of OA chondrocytes with defined markers and refine existing classifications. Notably, using computational analysis, we identified the relationship between the transcriptional programmes of OA landscapes and clinical outcomes. Therefore, our results offer an unbiased atlas of cartilage chondrocytes and shed light on diagnostic and therapeutic options for human OA.
Materials and methods
Single-cell RNA-seq library construction and sequencing
Sequencing libraries were generated following a modified single-cell tagged reverse transcription (STRT) protocol as previously reported.18–20 Briefly, after chondrocyte isolation, a single chondrocyte was put into the lysis buffer using a mouth pipette. Reverse transcription reactions were performed using a 25 nt oligo(dT) primer anchored with an 8 nt cell-specific barcode and 8 nt unique molecular identifiers.21–23 First-strand synthesis was performed and second-strand cDNAs were then synthesised, followed by 16 cycles of amplification. The amplified cDNAs of single cells were then pooled together. Biotinylated preindexed primers were applied for further amplification of the products by 4-cycle PCR to introduce biotin tags to the 3ʹ ends of the amplified cDNAs. Approximately 300 ng cDNA was then sheared to 300 bp using Covaris S2 (Covaris). The 3ʹ terminals of amplified cDNAs were purified using Dynabeads MyOne Streptavidin C1 beads (Thermo Fisher Scientific). Libraries were constructed using a Kapa Hyper Prep Kit (Kapa Biosystems) and were then submitted to 150 bp paired-end sequencing on an Illumina HiSeq 4000 platform (Novogene).
Correspondence analysis
Correspondence analysis (CA) was performed with the R package ca.24 The input data were from a frequency table (a 49×7 matrix) in which each row corresponded to each sample, and each column corresponded to the frequency of each cluster in the specific sample. We classified samples into two groups: samples with high CA1 coordinates and samples with low CA1 coordinates, using the same method for separating samples described as online supplementary materials and methods. The classification cut-off value for CA1 was 0.27 and the corresponding log rank p value was 1, meaning that CA1 was not significant for classifying samples. We then classified samples based on their CA2 coordinates; the cut-off value was −0.23 and the log rank p value was 0.00026, indicating that CA2 was significant for classifying samples. If the CA2 coordinate of the sample was higher than the cut-off (−0.23), this sample was defined as a high-CA2 sample; otherwise, the sample was defined as a low-CA2 sample.
Other detailed experimental procedures and specific materials are described in online supplementary materials and methods, including patients, isolation of human articular cartilage chondrocytes, RT-qPCR, immunohistochemical assays, processing of single-cell RNA-seq data, identification of cell types, transcription factor (TF) analysis, identification of differentially expressed genes (DEGs) among clusters, cell cycle analysis, identification of favourable and unfavourable genes, and statistical analysis.
Results
Single-cell profiling of human OA cartilage chondrocytes
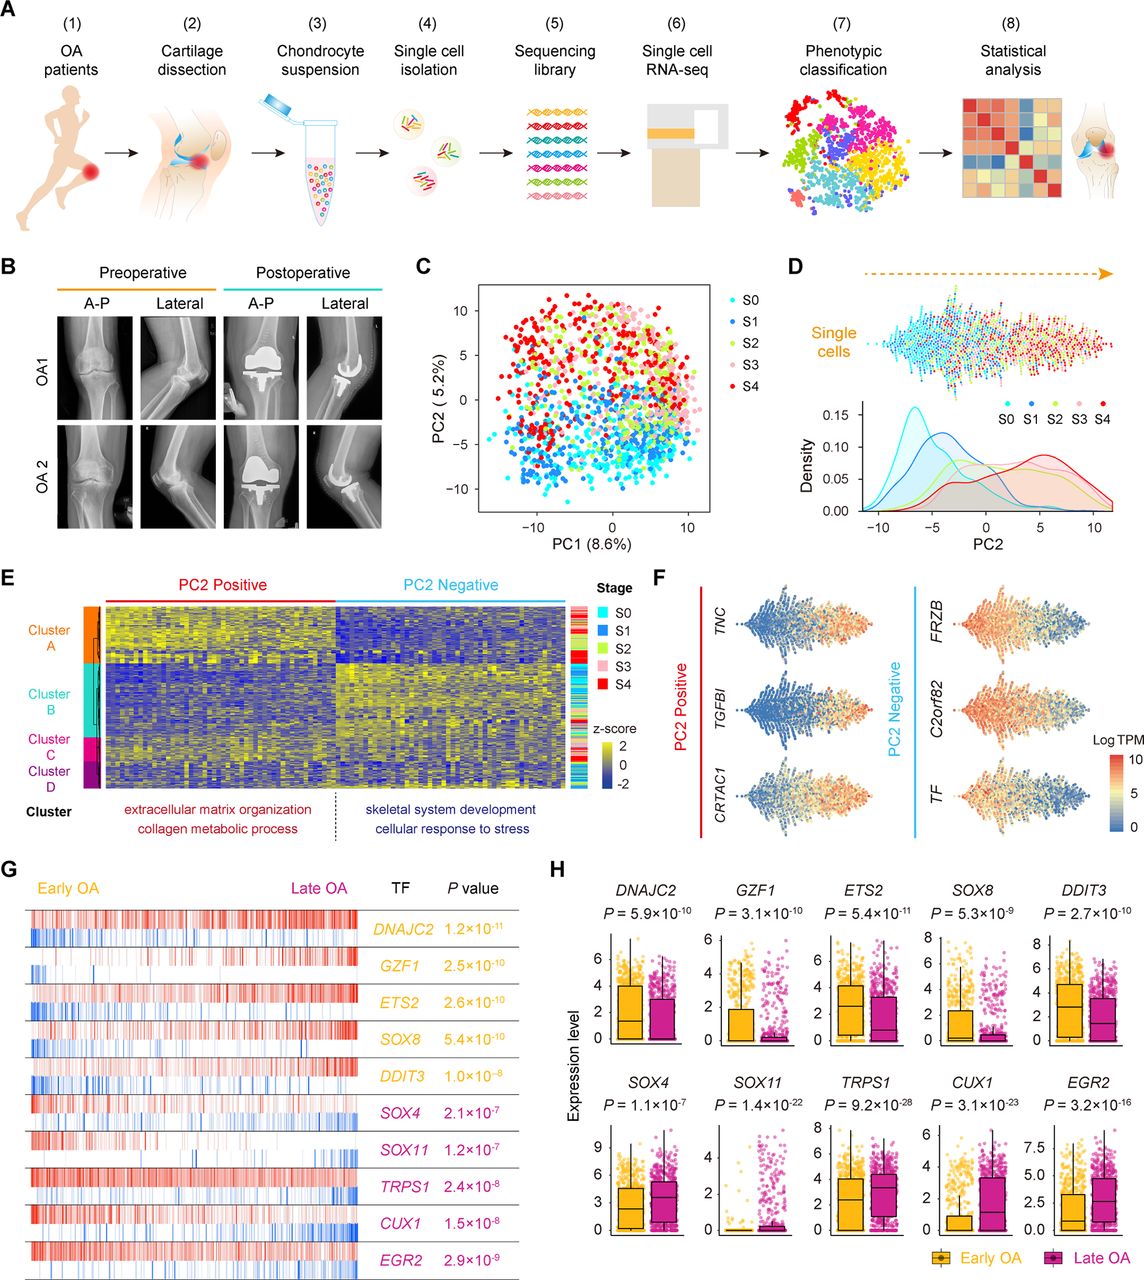
To define populations and identify genome-wide gene expression patterns, we isolated human OA chondrocytes at different stages obtained from the articular cartilage of 10 patients undergoing knee arthroplasty surgery according to the standard instructions by OARSI and ICRS and performed scRNA-seq using a modified STRT strategy25 ,26 (figure 1A,B; online Supplementary figure S1 and supplementary table S1). In total, we sequenced 1600 individual chondrocytes and retained 1464 chondrocytes for subsequent analysis after rigorous filtration (online supplementary figure S2A–C and supplementary table S2).
Supplementary file 1
Supplementary file 2
Supplementary file 3

Single-cell RNA-seq of human OA cartilage chondrocytes. (A) Schematic workflow of the experimental strategy. (B) Representative preoperative and postoperative radiographs of patients with knee OA undergoing arthroplasty. (C) PCA plot of single-cell transcriptomes based on the 500 most variable genes. S0 to S4, stage 0 to 4. (D) Beeswarm plot showing all filtered cells according to their coordinates along PC2 and coloured according to the OA stage of the cartilage sample. The cell density distribution of each stage along PC2 is shown below. (E) Hierarchical clustering of cells (rows) using the 50 most positively correlated and 50 most negatively correlated genes (columns) along PC2. Cells are classified into four clusters (left sidebar). The enriched GO terms for the genes showing the greatest correlation along PC2 are shown below. (F) The expression levels of three representative genes showing positive and negative correlations along PC2. (G) The top 10 candidate transcription factors for early-stage (S0 and S1, yellow) and late-stage (S3 and S4, purple) OA identified by the master regulator analysis algorithm (MARINa). Genes are rank-sorted according to their expression levels on the x-axis for regulators, with the p value depicting the enrichment significance. (H) Boxplots showing the expression levels of early-stage and late-stage OA candidate transcription factors and p values representing the significance of expression levels. GO, gene ontology; PCA, principal component analysis; OA, osteoarthritis.
To reveal transcriptional states during direct conversion between stages of OA progression, we analysed OA chondrocytes using principal component analysis (PCA) and identified a strong disease-stage progression along PC2 (figure 1C,D and online supplementary figure S2D). OA chondrocytes at all stages were spread out along PC2 and followed an expected timing, with chondrocytes at the OA early stages (0 and 1) occupying the negative region of the axis and chondrocytes at the OA late stages (3 and 4) occupying the positive region (figure 1D). Since then, genes in PC2 reflected the enrichment of OA chondrocyte disease associated genes. We then analysed the top 50 positively correlated genes and top 50 negatively correlated genes along PC2 and PC1 in these 1464 chondrocytes using hierarchical clustering. We identified four clusters (A, B, C and D) along PC2 and three clusters (1, 2 and 3) along PC1 (figure 1E and online supplementary figure S2E). Cluster 1 highly expressed genes showing a negative correlation along PC1 (ID3, HES1, JUN and others) which are mainly involved in protein binding and RNA metabolic process (online supplementary figure S2E and supplementary table S3), while cluster 2 highly expressed genes revealing a positive correlation along PC1 (KLHL21, SGMS2, ITGA5ID3 and others) which are associated with angiogenesis and cell motility. Moreover, clusters along PC2 were correlated with OA stages. Cluster A mainly consisted of stage 3 and 4 chondrocytes and highly expressed genes showing a positive correlation along PC2 (TNC, TGFBI, CRTAC1 and others) which are mainly involved in extracellular matrix organisation and collagen catabolism. Cluster B was mainly characterised by stage 0 and 1 chondrocytes and highly expressed genes showing a negative correlation along PC2 (FRZB, C2orf82, TF and others) which are mainly involved in skeletal system development and cellular responses to stress (figure 1E,F and online supplementary table S3), suggesting the early changes that occur during OA pathogenesis.
Supplementary file 4
We also performed an adjacency network analysis and identified the relationships among the OA chondrocytes on the basis of the pairwise correlation between cells, and the results were consistent with the PCA results for PC2 presented above (figure 1C,D and online supplementary figure S2F).
To identify changes in the expression of key genes with OA progression, we performed a volcano plot visualisation of gene expression between the cells in early (stages 0 and 1) and late (stages 3 and 4) stages of OA. We identified a group of stage-specific signature genes that have a potential capacity to promote OA, including S100A4 27 and HTRA1 28, whereas the other set of signature genes showed potential protective characteristics, including FZRB 29 and CHRDL2 30 (online supplementary figure S2G). To identify the critical candidate TFs involved in modulating OA pathogenesis, we next employed a TF analysis algorithm and found TFs (including DNAJC2, GZF1 and ETS2) that showed higher expression towards the later stages of OA, while other TFs, including SOX4, TRPS1 and EGR2, showed higher expression towards the early stages of OA (figure 1G,H). Taken together, these results reveal the overall pattern of transcriptome states during OA pathogenesis at a single-cell level.
Identification of human OA cartilage chondrocyte populations
To investigate chondrocyte heterogeneity in human OA cartilage, we used selected PC loadings as input and clustered cells with t-distributed stochastic neighbour embedding (t-SNE), resulting in a total of seven putative cell clusters (figure 2A, online supplementary figure S3A,B), including four empirically defined populations: ProCs, preHTCs, HTCs, fibrocartilage chondrocytes (FCs) and three novel populations, named as following: effector chondrocytes (ECs), regulatory chondrocytes (RegCs) and homeostatic chondrocytes (HomCs). ECs preferentially used metabolism, RegCs preferred signalling pathways and HomCs were enriched mainly for modulating cellular homeostasis and highly expressed human circadian clock rhythm markers. Besides, we found that ECs and ProCs were abundant, while FCs were relatively rare (online supplementary figure S3C). To explore the relationship among these chondrocytes, we used the Monocle method based on the single-cell data. We found that the pseudospace trajectory axis derived from Monocle matched well with cell types and the cell arrangement in the pseudospace trajectory corresponded to spatial relationships of the cells, suggesting the pseudospace trajectory demonstrates cells’ similarity in space (figure 2B and online supplementary figure S3D). ECs were distributed in the start of the trajectory, and RegCs and HomCs existed along trajectory. ProCs occupied in the front of preHTCs and HTCs, and FCs were mainly distributed in the end.

Identification of chondrocyte populations and gene signatures during human OA progression. (A) Visualisation of t-SNE coloured according to cell types for human OA cartilage single-cell transcriptomes. (B) Monocle pseudospace trajectory revealing the OA chondrocyte lineage progression coloured according to cell types. (C) Dot plots showing the stage distribution in each cluster. Heatmap showing the pairwise correlations. (D) Heatmap revealing the scaled expression of differentially expressed genes for each cluster defined in (A). Specific representative genes in each chondrocyte subsets are highlighted along the right margin. The colour scheme is based on z-scores. (E) Dot plots showing the expression of indicated markers for each cell cluster on the t-SNE map. (F) Representative immunohistochemistry assay of indicated genes in cartilage tissues. Scale bar, left, 500 µm; right, 50 µm. The scores of different areas (up, middle, down) in cartilage tissues based on the immunohistochemistry assay are shown. *p<0.05, otherwise, not significant. EC, effector chondrocyte; RegC, regulatory chondrocyte; ProC, proliferative chondrocyte; preHTC, prehypertrophic chondrocyte; FC, fibrocartilage chondrocyte; HTC, hypertrophic chondrocyte; HomC, homeostatic chondrocyte; OA, osteoarthritis; t-SNE, t-distributed stochastic neighbour embedding.
We next analysed the OA stage distributions of the cell populations. ECs and RegCs were mainly early-stage OA chondrocytes, while preHTCs, HTCs and FCs were mainly late-stage OA chondrocytes. Moreover, the pairwise correlation analysis revealed close relationships between ECs and ProCs, RegCs and ProCs, preHTCs and FCs as well as HomCs and HTCs (figure 2C and online supplementary figure S3E). We found 792 DEGs that best classified chondrocytes into the seven clusters (figure 2D). Representative markers for ECs, RegCs, ProCs, preHTCs, FCs, HTCs and HomCs were revealed (figure 2D,E and online supplementary table S4), representing new combinations of genes to distinguish OA chondrocyte populations. We then performed the immunohistochemistry assay to validate these markers for each chondrocytes population (figure 2F). The results revealed that most of ECs and RegCs were distributed in the superficial zone and ProCs were distributed in the proliferative zone. While preHTCs and HTCs were distributed in the hypertrophic zone. FCs were mainly late-stage OA chondrocytes and HomCs were distributed in each layer, which were consistent with the findings above. Overall, these results identified a set of novel markers that can be applied in combination to classify chondrocyte phenotypes and reconstructed the cell-type lineage that recapitulates factors contributing to OA progression.
Supplementary file 5
Identification of ECs and RegCs
Two OA chondrocyte clusters, ECs and RegCs, represent newly defined populations that decrease in abundance during OA progression (figure 2A,C). Comparing these two clusters showed that ECs can be distinguished by the signature which includes genes related to alcohol biosynthesis, skeletal system development and cholesterol biosynthesis, including C2orf82, CLEC3A and CYTL1, whereas RegCs were enriched in genes related to responses to endogenous stimuli and cellular responses to oxygen-containing compounds, such as CHI3L2, CRTAC1 and CHI3L1 (figure 3A,B and online supplementary table S5).

Definition of ECs and RegCs. (A) Heatmap showing scaled expression of differentially expressed genes defining the EC and RegC subsets. (B) Violin plots showing the expression levels of representative candidate marker genes for ECs and RegCs. (C) GSEA showing enrichment of pathways between ECs and RegCs. (D) The expression levels of genes associated with the TCA (p=1.4×10⁻²⁵) and with glucose (p=1.5×10⁻¹⁵), lipid (p=2.7×10–182) and amino acid (p=3.2×10–58) metabolism in ECs and RegCs. (E) The cells are coloured according to the expression levels of the indicated markers for antigen processing and presentation on the t-SNE map. Cells are shown enlarged in the section outlined in green. ECs, effector chondrocytes; RegCs, regulatory chondrocytes; GSEA, gene set enrichment analysis; TCA, tricarboxylic acid cycle; t-SNE, t-distributed stochastic neighbour embedding.
To decipher the specified characteristics of these two new populations of OA chondrocytes, we analysed the differences by gene set enrichment analysis (GSEA) and Kyoto Encyclopedia of Genes and Genomes (KEGG) analysis. Notably, ECs preferentially used metabolic processes consisting of steroid biosynthesis and fatty acid metabolism, whereas RegCs were enriched for signalling pathway regulation, such as Toll-like receptor, mTOR, TGF-β, p53, JAK/STAT, WNT and chemokine signalling (figure 3C). Consistent with the results above, ECs show a catabolic metabolic programme and exhibit a high level of nutrient uptake related to the canonical tricarboxylic acid cycle and a high level of amino acid metabolism (figure 3D). RegCs, by contrast, primarily use a programme of regulation and responses. The GSEA revealed that RegCs possess gene expression related to antigen-processing and antigen-presenting, and we detected the expression of the major histocompatibility complex class of genes. We found that the genes CD74, CD80, CD86 and HLA-DPA1 were expressed at higher levels in a small proportion of RegCs (figure 3E), indicating that these cells might possess immune cell functions during OA progression. Taken together, these data expand our understanding of the novel function of these new chondrocyte subsets in OA.
Determining the relationships among ProCs, preHTCs and HTCs
ProC, preHTC and HTC populations are the three empirically defined populations in human OA articular cartilage, and we next analysed the relationships among ProCs, preHTCs and HTCs and identified distinctive cluster markers (figure 4A; online supplementary figure S4A and Supplementary file 6), including some TFs (figure 4B and online supplementary figure S4B). ProCs express a unique combination of genes that have the potential to affect RNA metabolic processes and RNA stabilisation; preHTCs distinctively express a biological adhesion and multicellular organismal process gene signature; and HTCs were found to be enriched in the expression of genes related to transmembrane transporter activity and catabolic metabolism (online Supplementary file 6). We next used the Monocle method to investigate the potential transition between cell types to determine a pseudotemporal ordering for delineating differentiation paths. The pseudotime trajectory axis derived from Monocle indicated that preHTCs represent a state between ProCs and HTCs (figure 4C and online supplementary figure S4C,D). Pseudotemporal expression dynamics of specific representative genes also marked the progression from ProCs to preHTCs to HTCs (figure 4D and online supplementary figure S4E). Taken together, these data reveal the relationships among ProCs, preHTCs and HTCs and the potential transition between these cell types.
Supplementary file 6

Characterisation of ProCs, preHTCs and HTCs, and the definition of HTC subsets. (A) Heatmap showing the scaled expression of the top 20 differentially expressed genes defining the ProC, preHTC and HTC populations. (B) Boxplots showing the expression levels of transcription factors specifically expressed in different cell types. (C) Monocle pseudotime trajectory revealing the progression of ProCs, preHTCs and HTCs. (D) Pseudotemporal expression dynamics of specific representative genes (corresponding to (A)) marking ProCs, preHTCs and HTCs. All single cells in the ProC, preHTC and HTC cell lineage are ordered based on pseudotime. (E) t-SNE visualisation of the HTC-A and HTC-B subpopulations. (F) Heatmap showing the scaled expression of the top 10 differentially expressed genes defining the HTC-A and HTC-B subsets. HTCs, hypertrophic chondrocytes; preHTCs, prehypertrophic chondrocytes; ProCs, proliferative chondrocytes; t-SNE, t- distributed stochastic neighbour embedding.
Two subpopulations within HTCs
As HTCs were distributed with specific discriminative markers across two subpopulations (figure 2E), we next classified HTCs into transcriptionally distinct clusters, HTC-A and HTC-B, and identified DEGs for these two subclusters (figure 4E,F and online supplementary figure S5A,B). The HTC-A cluster expressed unique markers that were enriched for genes related to cartilage development, connective tissue development and negative growth regulation. In contrast, the HTC-B subset was enriched for genes related to extracellular matrix organisation, ossification and mineralisation (online Supplementary file 7). In addition, the Monocle pseudotime trajectory revealed the progression of the HTC-A and HTC-B subsets (online supplementary figure S5C). Taken together, these results reveal two subpopulations of HTCs and contribute to a deeper understanding of the role of HTCs during OA pathogenesis.
Supplementary file 7
Identification of potential functions of FCs and CPCs
Genes related to one population of late-stage OA chondrocytes were enriched for genes related to collagen fibril organisation, vasculature development, catabolism and cell migration (online supplementary table S4). We validated these cells with fibroblast phenotype markers (COL1A1, COL3A1, COL5A1, S100A4), stem-cell-related surface markers (CD29, CD44, CD73, CD90, CD105), haematopoietic markers (CD34, CD45, CD133) and MSC-specific surface markers (CD106, CD146, ITGA11)5 (figure 5A and online supplementary figure S5D) and found that these cells expressed high levels of fibroblast-phenotype markers but low levels of MSC-specific surface markers and hematopoietic markers. Therefore, we defined these OA chondrocytes as FCs. To help clarify the process of cartilage regeneration in OA, we next analysed cell proliferation related to developmental programmes and assessed the existence of CPCs in cartilage. Each chondrocyte was scored for the expression of G1/S and G2/M phase signatures. We found a small proportion of chondrocytes that were proliferating and that were actively progressing through the cell cycle in OA cartilage (figure 5B). We next identified stable markers of CPCs, including BIRC5, CENPU, UNE2C, DHFR and STMN1, which will be useful for investigating the role of CPCs in human OA cartilage regeneration (figure 5C; online supplementary figure S5E and Supplementary file 8).
Supplementary file 8

Identification of FCs and CPCs. (A) Cells are coloured according to the expression levels of the indicated markers on the t-SNE map. (B) Classification of cells categorised as proliferative cells (coloured according to their approximate phase) and quiescent cells (coloured in grey) based on the relative expression of genes associated with the G1/S stage and G2/M stage. (C) Violin plots showing the gene expression of representative candidate marker genes of CPCs. (D) Heatmap showing the scaled expression of differentially expressed genes defining the CPC and FC subsets. The top 20 markers for CPCs and FCs are shown in the right. (E) Boxplots showing the expression levels of PER1 and SIRT1 in seven OA chondrocyte populations. (F) Representative immunohistochemical staining of the indicated markers in OA cartilage tissues (stage 0). Scale bar: left, 500 µm; right, 50 µm. CPCs, cartilage progenitor cells; ECs, effector chondrocytes; RegCs, regulatory chondrocytes; ProCs, proliferative chondrocytes; preHTCs, prehypertrophic chondrocytes; FCs, fibrocartilage chondrocytes; HTCs, hypertrophic chondrocytes; HomCs, homeostatic chondrocytes; OA, osteoarthritis; t-SNE, t-distributed stochastic neighbour embedding.
We then assessed the gene expression and functional characteristics of these two cell types. We found that genes specifically expressed by CPCs, but not by FCs, showed specific features related to the known biological properties of CPCs, including the cell cycle, chromosome organisation, and DNA replication. In contrast, FCs expressed genes enriched for vasculature development and extracellular matrix (ECM) organisation (figure 5D and online Supplementary file 9). Taken together, these data reveal discriminative markers for CPCs and identify FCs, which have implications for cartilage repair in OA.
Supplementary file 9
Characterisation of HomCs
We found that the gene expression of one cluster was enriched mainly for processes related to modulating cellular homeostasis, including regulation of the cell cycle, development, RNA metabolism and biosynthesis, and the proportion of cells from this cluster was relatively stable at each stage of OA (online supplementary table S4). We refer to this population as HomCs. As the circadian clock system plays an important role in maintaining rhythmic behaviours and daily cycles of metabolism during OA cartilage degeneration,31 32 we hypothesised that HomCs might exhibit abilities related to the circadian clock system. Interestingly, this population of OA chondrocytes revealed a high level of expression of human circadian clock markers, such as PER1 and SIRT1 32 (figure 5E). We then investigated the expression of PER1 and SIRT1 in cartilage using immunohistochemistry assays and validated the existence of HomCs in OA cartilage (figure 5F). Therefore, this population of chondrocytes might play an important role in the circadian clock system in OA cartilage, which presents a new dimension for identifying novel therapeutic targets for OA cartilage regeneration.
Clinical outcomes based on the structure of the OA landscape
To investigate the relationships between all types of OA cartilage chondrocytes and the available clinical data, we referred to the new definition for the sample severity index of OA articular cartilage that combines the Hospital for Special Surgery (HSS) knee scoring system and the OA stage of the samples (online supplementary table S1); this definition reflects the severity signature of OA progression. Based on 19 566 human protein-coding genes across the OA chondrocyte types, the patient samples were stratified into two groups: those with expression levels either above (high) or below (low) the determined cut-off values based on each individual gene profile. We identified 336 predictive genes, making them potential candidates for future studies of OA. These predictive genes were classified into two types that contributed to OA progression: 199 predictive genes related to favourable outcomes (favourable genes) and 137 related to unfavourable outcomes (unfavourable genes) (online supplementary figure S6A). Favourable genes and unfavourable genes found to be significant yielded predictive panels for clinical OA outcomes (figure 6A; online supplementary figure S6B,C and Supplementary file 10). Based on average differences in expression, we assessed the distribution of predictive genes in each cell type. We found that the distribution of favourable and unfavourable predictive genes varied among chondrocyte populations in human OA. Favourable genes were mainly expressed in ECs, RegCs and HomCs, while unfavourable genes were expressed in a large proportion of ProCs, preHTCs and FCs (figure 6B), suggesting ECs, RegCs and HomCs might protect cartilage from developing OA, while ProCs, PreHTCs and FCs might promote OA progression.
Supplementary file 10

Clinical outcome in relation to the structure of the OA landscape. (A) Examples of the relationship between the severity index and predictive genes. Orange and purple boxplots corresponding to two groups of samples with high and low levels of gene expression, respectively. (B) Favourable and unfavourable predictive gene distributions in different OA chondrocyte types. (C–F) Representative immunohistochemistry assay of ADRM1 (C), HSPA2 (D), RPS29 (E) and COL5A1 (F) in cartilage tissues of OA stage 0 and stage 3. Scale bar, 50 µm. The scores of the indicated genes in cartilage tissues based on the immunohistochemistry assay are shown. *p<0.05. (G) ROC curve for the individual ADRM1 (RT<0.6569, sensitivity 0.762, specificity 0.875), HSPA2 (RT<0.7473, sensitivity 0.901, specificity 0.813), RPS29 (RT>1.186, sensitivity 0.810, specificity 0.875) and COL5A1 (RT>1.352, sensitivity 0.857, specificity 0.938) to separate patients with OA from health controls. AUC, area under curve; ECs, effector chondrocytes; RegCs, regulatory chondrocytes; ProCs, proliferative chondrocytes; preHTCs, prehypertrophic chondrocytes; FCs, fibrocartilage chondrocytes; HTCs, hypertrophic chondrocytes; HomCs, homeostatic chondrocytes; OA, osteoarthritis; ROC, receiver-operating characteristic; RT, ratio threshold.
To evaluate the usefulness of the favourable genes (ADRM1 and HSPA2) and unfavourable genes (RPS29 and COL5A1) in discriminating patients with OA from health controls, we performed RT-qPCR assay to analyse the expression of the genes in cartilage tissues of stage 0, 16 health controls (cartilage from knee without OA) and 16 other controls (cartilage from knee of patients with rheumatoid arthritis). We found that there were no significant differences (online supplementary figure S7A–D). Then we analysed the expression of the candidate biomarkers using RT-qPCR and immunohistochemistry in cartilage samples of patients with OA (figure 6C–F). The results revealed that ADRM1 and HSPA2 were downregulated, while RPS29 and COL5A1 were upregulated in stage 3 cartilage samples (figure 6C–F). We next validated the gene expression in a new cohort of 21 patients with OA using RT-qPCR and found that the results were in line with the predictive findings from the first cohort (online supplementary figure S7E–H). To further evaluate the diagnostic value of the candidate biomarkers, we performed receiver-operating characteristic (ROC) curve analysis in a prospective cohort of 16 health controls and 21 patients with OA. ROC curve analysis indicated that four genes (ADRM1, HSPA2, RPS29 and COL5A1) could serve as valuable biomarkers, with the area under curve being 0.878, 0.896, 0.899 and 0.936, respectively (figure 6G).
To extend the clinical outcome analysis and determine the contribution of these OA chondrocyte populations in clinical therapeutic treatments, we next applied CA based on the cell-type frequency table derived from all OA samples (online supplementary figure S8A). We found that CA component 1 (CA1) mainly captures the tendency of high levels of FCs to co-occur with HTCs, while CA component 2 (CA2) shows a different ordering of OA chondrocyte types and OA samples driven by the high co-occurrence of samples containing HTCs, preHTCs and FCs (online supplementary figure S8B). The CA indicated that these subsets might be associated with clinical OA outcomes. To find the role of these cell types in OA progression, we grouped OA chondrocyte samples based on their CA coordinates (online supplementary figure S8C). We next evaluated CA1 and CA2 to investigate the relationship between CA dimensions and severity index values and found that CA2 was significantly associated with clinical OA outcomes (log rank p value=2.6×10⁻⁴). Moreover, we found that higher CA2 values were correlated with worse clinical OA outcomes (online supplementary figure S8D). The CA results show that FCs, PreHTCs and ProCs had high CA2 values, suggesting that these three cell types were correlated with worse clinical outcomes in the OA, which is consistent with the results presented above (figure 6B). Collectively, these data show that the single-cell transcriptional programmes can present potential clues for treating OA.
Discussion
Knee replacement surgery is a cost-effective procedure undertaken to relieve pain and restore joint function for symptomatic OA.33 An increasingly ageing society, economic pressure and the obesity epidemic all emphasise the demand for new strategies for the diagnosis and treatment of early-stage OA, ultimately to reduce the need for joint replacement surgery.33–36 Because the cartilage lacks an intrinsic capacity for self-repair and because there are not enough specific cell markers, a detailed understanding of the internal state of chondrocytes in OA pathogenesis is urgently needed. Here, we investigated OA chondrocytes at different stages at single-cell resolution using comprehensive gene expression profiling. We identified novel cell markers and signatures for verifying each hypothesised chondrocyte cluster. Notably, in addition to the empirically inferred chondrocyte subtypes, we identified new subtypes of chondrocytes, new markers of chondrocyte populations and signalling pathways involved in OA pathogenesis based on scRNA-seq analysis. Importantly, we identified the relationship between transcriptional programmes of the OA progression landscape and clinical outcomes, with the aim of contributing to the early diagnosis and therapeutic treatment of human OA.
Phenotypic changes in chondrocyte behaviour, such as hypertrophy and matrix calcification, can lead to the occurrence of cartilage destruction in OA.37 38 ProCs are flat and columnar chondrocytes mainly found in the proliferative zone of growth plates.39 40 The top layer of ProCs have the potential to prevent hypertrophic differentiation and the lower layers close to preHTCs and HTCs allow hypertrophic differentiation.40–42 preHTC populations control the onset of hypertrophic differentiation.43 HTCs, chondrocytes characterised by their size and absence of cell division, modulate mineralisation of the surrounding matrix.43–45 In addition, HTCs attract vascular and bone-cell invasion and then undergo apoptosis and calcium deposition, ultimately triggering the progression of human OA.13 46 The lack of effective discriminative markers for ProCs, preHTCs and HTCs leads to an incomplete picture of their functions and roles during OA progression. Our study revealed different functions and specific markers among ProCs, preHTCs and HTCs and the critical TFs involved in each population. Moreover, we demonstrated that preHTCs represent the state between ProCs and HTCs. We also identified HTC-A and HTC-B populations within HTCs that possess different ontologies which has therapeutic implications for OA treatment options.
Metabolism, including anabolic and catabolic activities, is important for the maintenance of optimal cartilage function and the capacity for self-repair.47 During OA progression, metabolism is drastically altered and metabolic pathways switch towards glycolysis, which contributes to impaired extracellular matrix synthesis and anabolic processes.47–49 Therefore, a deeper mechanistic understanding of metabolic pathways is necessary. In this study, we identified a new population of ECs that shows a high metabolic rate, including processes related to the TCA cycle, glycolysis and lipid and amino acid metabolism, suggesting that ECs are active in energy supply. RegCs are characterised by many signalling pathways, indicating that the RegC phenotype may play the role of master regulator during OA progression. Moreover, a metabolic imbalance associated with OA leads to dysfunction in inflammatory pathways and immune responses, activation of the innate immune system and abnormal expression of complement components in human OA, which is intriguing.50 51 RegCs are characterised by an antigen-presenting function and B cell and T cell receptor signalling, and we found that a small proportion of RegCs possess a high level of markers specific for the immune system, indicating that these cells might have capacities similar to immune cells. In addition, ECs and RegCs have a high expression level of favourable genes, which was associated with their protective panels in relation to OA clinical outcomes. The characterisation of these two new populations improves our understanding of the role of chondrocytes in OA.
CPCs are characterised by multilineage differentiation ability, function as reparative cells for the maintenance of cartilage homeostasis and possess capacities for responding to injury and migrating.5 17 52 In early-stage OA, most CPCs were found in the cartilage middle zone and near the fissures.5 The functional roles of CPCs in late-stage OA have not yet been elucidated. Moreover, the definitive identification of CPCs to track cell lineage has remained elusive. Our study identified well-defined markers for CPCs. In addition, we found another cell population, FCs, that was mainly found in the late stages of OA and possessed a high ratio of genes related to unfavourable OA outcomes and a capacity for vascularisation, indicating that FCs promote OA progression, which was supported by the CA result. Therefore, based on their characteristics and functions, comparisons of CPCs and FCs might offer clues for OA cartilage regeneration. During early OA, targeting CPCs to enhance joint resurfacing, extracellular matrix production and their intrinsic chondroprotective ability would preserve cartilage structure and function and could play an important role in OA therapy. In late-stage OA, structural changes in channel formation enable cell passage between cartilage and subchondral bone.5
Recently, multiple reports have revealed that cartilage homeostasis is under a pattern of peripheral circadian clock control.32 53 54 The rhythmic clock-controlled genes include genes involved in cartilage metabolism and remodeling.32 The rhythmic nature of joint cartilage suggests that drug targets might be rhythmically active,55 which should be taken into account in future clinical OA drug trials. In this study, we identified a HomC population that exhibited high expression levels of human circadian clock rhythm markers and favourable genes, which are enriched for cell cycle regulation, metabolic processes and development, suggesting that these cells might act as the main controllers of the circadian clock in OA progression. In addition, we revealed more targets specific to HomCs, which may have new implications for effective OA drug delivery and development .
In conclusion, our single-cell analysis allowed for the separation and identification of admixtures of OA cartilage chondrocyte populations at single-cell resolution and at the whole-transcriptome scale. Our analysis identified paths of transition, discriminative markers and TFs in relation to specific cell subsets and identified close relationships between cell types and clinical outcomes, opening new possibilities for providing important diagnostic and therapeutic strategies for OA-related lifestyle modifications and healthcare.
Supplementary file 11
Acknowledgments
The authors would like to thank Dr Jiying Chen, Dr Wei Chai, Dr Qiang Zhang, Dr Ming Ni, Dr Xiang Li and Yun Gao, Jingyi Li, Ji Dong, Qingqing Li, Jie Ren for valuable comments and sample provision.
References
Footnotes
QJ and YZ contributed equally.
Handling editor Josef S Smolen
Contributors QJ, YZ, YW and FT conceived the project. QJ designed the experiments. YZ designed and performed bioinformatics analyses. QJ, LL and YX performed cell and molecular experiments. QJ performed single-cell RNA-seq and histological analysis. YQH, XF, YH and YX contributed reagents, materials and analysis tools. GZ recruited patients. LW provided comments.
Funding The work was financially supported through grants from the National Programs for High Technology Research and Development (2015AA033701) and the National Natural Science Foundation (81672195, 81630067, 81672602 and 81371976).
Competing interests None declared.
Patient consent Obtained.
Ethics approval General Hospital of the People’s Liberation Arm, Beijing, China.
Provenance and peer review Not commissioned; externally peer reviewed.
Data sharing statement The single-cell RNA-seq data, quality control information and cluster information are available at the NCBI’s Gene Expression Omnibus (GEO) data repository with the accession ID GSE104782.