Article Text

Abstract
Background The Disease Activity Index for Psoriatic Arthritis (DAPSA) is a valid and discriminative tool. Definitions of disease activity states and therapeutic response are still missing. We derived such criteria for the DAPSA.
Methods We retrieved 30 patient profiles from an observational database including joint counts, patient pain and global activity ratings and C-reactive protein (CRP) and carried out a survey among experts to classify patients into remission (REM), low (LDA), moderate (MDA) or high (HDA) disease activity. Based on the distributions of DAPSA in each of these expert-assigned states we defined the cutpoints between groups. We performed similar analyses evaluating a clinical score (cDAPSA), omitting CRP. To define minor, moderate and major treatment response, we used Cohen's Kappa statistics and analysed agreement of DAPSA percentage change with ACR20/50/70-response in three randomised controlled trials.
Results Our survey yielded a response rate of 75% (n=33). Mean DAPSA differed significantly between patients classified as REM, LDA, MDA or HDA (p<0.001). Based on the distributions of DAPSA in these groups, we propose cut-off values of ≤4 for REM, >4 and ≤14 for LDA, >14 and ≤28 for MDA and >28 for HDA. We observed best agreement with ACR20/50/70-response at DAPSA changes of 50/75/85%, reflecting minor, moderate and major improvement.
Conclusions The DAPSA constitutes a disease-specific, validated and feasible tool for PsA assessment. In this study, we provide criteria for disease activity states and treatment response. They are based on an international expert survey, and show good performance in clinical trials and observational data.
- Psoriatic Arthritis
- Outcomes research
- Arthritis
Statistics from Altmetric.com
Introduction
Assessment of disease activity in psoriatic arthritis (PsA) is instrumental to following therapeutic response in clinical practice and clinical trials. Many scores used in PsA, such as the Disease Activity Score using 28 joint counts (DAS28), have been originally developed for patients with rheumatoid arthritis (RA).1 Although the DAS28 may be valid also in patients with PsA,2–5 the 28 joint count does not necessarily capture all joints commonly affected in PsA, including distal interphalangeal joints (DIPs) of the hand and joints of the ankle and foot. Therefore, it may not be accurate and lack the sensitivity to change in patients with PsA presenting with joint patterns that are not polyarticular or RA like.6
Among available response scores, the American College for Rheumatology (ACR) criteria7 are frequently used in PsA trials. Similarly to the European League against Rheumatism (EULAR) criteria8 that are based on DAS28 improvement, they were originally developed for RA, and later transferred to PsA.2–5 The disease-specific Psoriatic Arthritis Response Criteria (PsARC)9 include 66/68 swollen and tender joint counts as well as evaluator global assessment and patient global assessment (PtGA), both on a 0–5 Likert rating scale. However, limitations of the PsARC include the lack of consideration of acute-phase reactants or pain, a predominant symptom in many patients with PsA.10 PsARC performed worse than EULAR response criteria and ACR20 in subanalyses of trial data,2 a fact that further suggests the necessity of new disease-specific response criteria.
In a principal component analysis that evaluated disease activity measures for PsA,11 the following components were identified that characterised disease activity best: patient pain assessment (PP) and PtGA; joint involvement assessed with 66 swollen and 68 tender joint counts (SJC66, TJC68); and, lastly, serum acute-phase response, represented best by C-reactive protein (CRP). Four of these variables (with the exception of CRP) were also promoted to be key outcomes in publications of the Outcome Measures in Rheumatology group (OMERACT).3 ,12 ,13 The Disease Activity Index for Psoriatic Arthritis (DAPSA) encompasses exactly these parameters; it is based on the summation of five variables: tender and swollen joints (TJC68, SJC66), PtGA and PP on a 10 cm visual analogue scale (VAS), as well as CRP. The DAPSA score was originally developed for reactive arthritis,14 another seronegative spondylarthropathy with a mostly oligoarticular joint pattern that also affects the DIPs. It has been validated for use in PsA, where it showed correlational, discriminatory and criterion validity; furthermore, it was sensitive to change in trial and observational data alike.15 In a recently published study, it also showed good correlation with ultrasound-assessed synovitis.16 The major limitation of the DAPSA for its use in trials and clinical practice to date was the lack of definitions of disease activity states and of established response criteria. In the present study, we have addressed these deficiencies and derived criteria for both disease activity states and treatment response.
Methods
Survey on the assessment of disease activity states
We extracted 30 patient profiles from an observational dataset. In the selection process of these profiles, we aimed at representing a broad range of disease activity as well as different constitutions of the components for similar DAPSA scores. In November 2014, we performed an email-based survey among 44 international rheumatology experts. We asked them to classify the disease activity state of each patient based on their SJC66 and TJC68, patient global activity and pain ratings on VAS, and CRP values. We compared the collected ratings of this expert panel and used Kruskal–Wallis test to analyse differences between group means of DAPSA among patients classified as remission (REM), low disease activity (LDA), moderate disease activity (MDA) and high disease activity (HDA) in the expert rating.
We then adjudicated each patient a disease activity state based on the expert ratings. To take into account all individual opinions, we included all patients who had been assigned to a particular disease activity state by at least one of the experts in the main analysis. For example, for the analysis of REM, all patient profiles (and their DAPSA scores) which were found to reflect a state of REM by one or more rheumatologists were included. Thus, some patients were analysed in more than one disease activity state.
From the data of all patients assigned to a specific disease activity category, we analysed the distributions of DAPSA within each state by calculating the respective 25th and 75th percentiles of DAPSA. These were then used to define the DAPSA thresholds between REM, LDA, MDA and HDA. Thus, two values were available for each cutpoint of interest. We reconciled numerical differences between the 75th percentile of the lower, and the 25th percentile of the adjacent higher disease activity state, where necessary, by calculating their mean.
In a sensitivity analysis, we modified the adjudication process and assigned patient profiles to a particular disease activity state only if a majority (>50%) of experts had assigned that state.
In a next step, we also derived cutpoints for a clinical version of the DAPSA (cDAPSA) that incorporates joint counts, PP and PtGA, but excludes CRP, in analogy to the development of the Clinical Disease Activity Index (CDAI) out of the Simplified Disease Activity Index (SDAI) in RA,17 where serological inflammation markers were omitted to attain a fully clinical score.
Derivation of cutpoints for response levels
We analysed patient-level data of three large randomised controlled clinical trials (RCTs): the ADEPT,18 IMPACT4 ,5 and GO-REVEAL19 studies. In these RCTs, the effectiveness of tumour necrosis factor inhibitors (TNFi), namely adalimumab (ADA),18 infliximab (IFX)4 ,5 and golimumab (GOL),19 had been investigated in patients with PsA with prior non-response to DMARDs or non-steroidal anti-inflammatory drugs.
In analyses of the ADEPT trial data, we used Cohen’s Kappa statistics to identify the level of best agreement between ACR response and DAPSA change after 3 and 6 months, in analogy to the definition of response criteria for RA.20 The percentage change of DAPSA that showed highest agreement with ACR20 was defined as ‘DAPSA minor response’. Similarly, the percentage change of DAPSA agreeing best with ACR50 and ACR70 were defined as ‘DAPSA moderate-’ and ‘DAPSA major response’, respectively.
We assessed discriminative validity by performing χ2 tests between response rates of active drug versus comparator arm in the trial, for each of the derived response levels (minor, moderate and major). As a next step, we carried out the analogous calculations using data of the IMPACT and GO-REVEAL datasets to validate the newly derived cutpoints. Additionally, we used an observational outpatient dataset to analyse DAPSA response during follow-up to further substantiate our results for use in clinical practice.
Results
Definition of DAPSA disease activity states
The response rate of our survey was 75% (n=33). Among the responding international experts, 97% described their work place as ‘primarily hospital based’, and 86% stated to be practising for more than 10 years. The characteristics of the 30 patients used for the evaluation of disease activity states represented a broad spectrum of disease activity. As expected, no patient was adjudicated to only one disease activity state by all experts. Table 1 lists disease activity variables of all patients and specifies their medians and ranges within the disease activity states as categorised by experts; the details of all ratings are shown in online supplementary table S1 and the detailed patient characteristics are shown in online supplementary table S1 and figure S1.
Disease activity parameters of 30 patients presented in our survey
The expert-based adjudications to REM, LDA, MDA or HDA were used to derive DAPSA cutpoints for the four disease activity states. Initial Kruskal–Wallis testing of mean DAPSA values showed significant differences across the different disease activity states (p<0.001, figure 1). Based on the 25th and 75th percentiles of DAPSA values in each expert-assigned disease activity state, we then derived thresholds for REM, LDA, MDA and HDA. We calculated arithmetic means, if the numerical thresholds, that is, the respective 25th and 75th DAPSA percentiles of two adjacent disease activity states, did not result in the exact same numbers—this was the case between REM and LDA (75th REM-percentile: 4.2 and 25th LDA-percentile: 4.1), as well as between LDA and MDA (75th percentile of LDA: 12.7 and 25th percentile of MDA: 14.7). This procedure resulted in the following preliminary cutpoints: for REM, DAPSA ≤4.2 (rounded mean of 75th percentile of the REM group of 4.2 and 25th LDA percentile of 4.1); for LDA, >4.2 and ≤13.7 (mean of 75th LDA percentile of 12.7 and 25th MDA percentile of 14.7); for MDA, >13.7 and ≤28.3; for HDA, >28.3. For ease of use, and in analogy of the development of other indices,21 we propose to set thresholds at the rounded values of 4, 14 and 28.
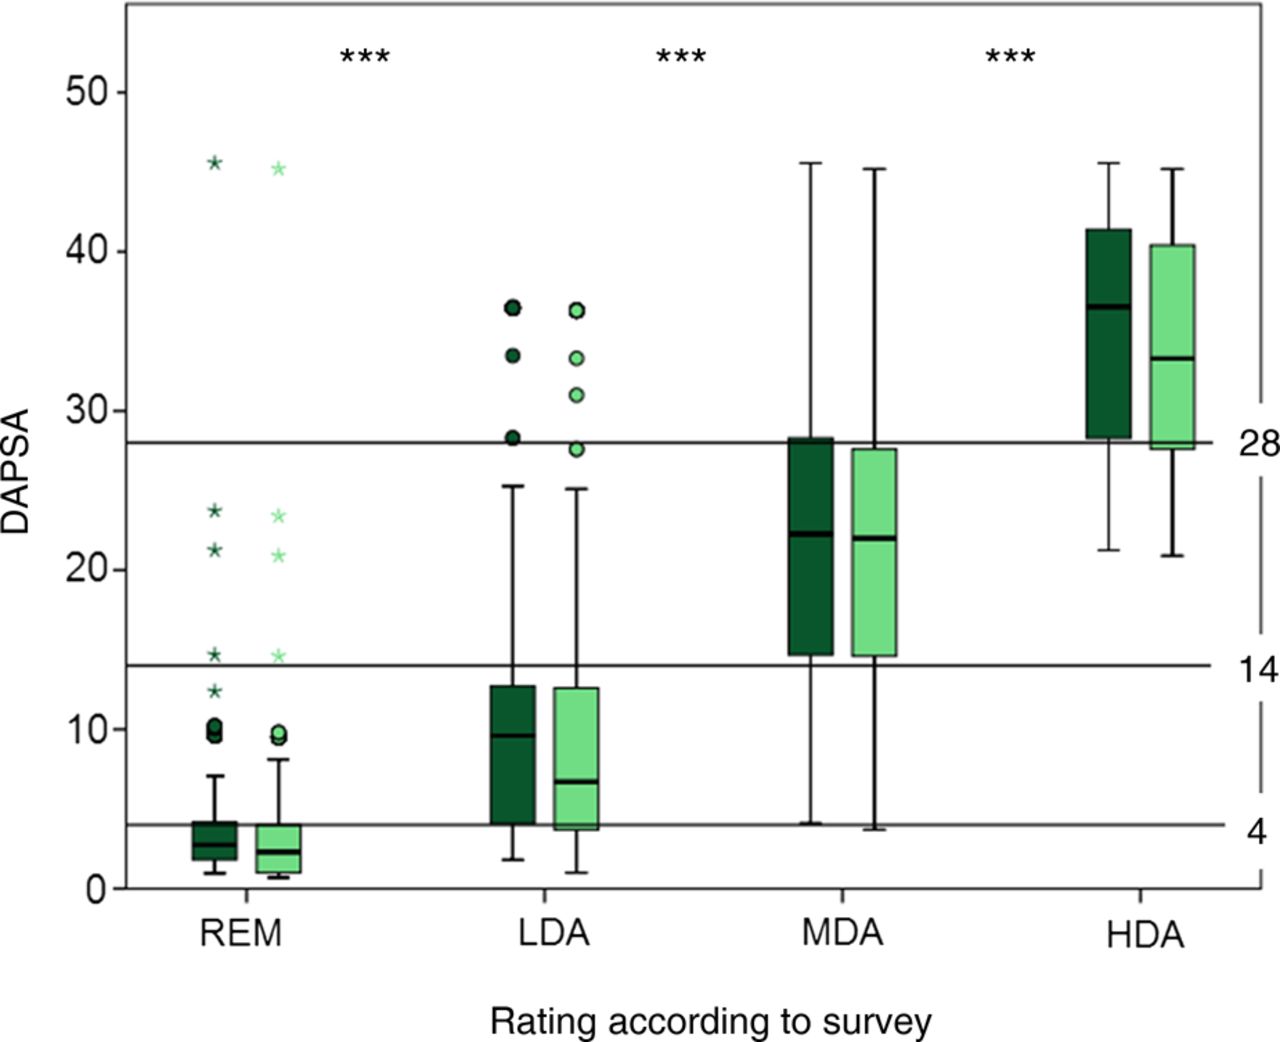
Definition of DAPSA disease activity states; survey results: x-axis shows the experts’ classification of disease activity, y-axis shows mean DAPSA. Horizontal thresholds at DAPSA 4, 14 and 28 are indicated. Box-plots display median and 25th and 75th percentiles of the full DAPSA (dark green) and the clinical cDAPSA, excluding CRP (light green); Medians of DAPSA (and cDAPSA) in the different states were as follows: REM, 2.7 (2.3); LDA, 9.6 (6.7); MDA, 22.3 (22.0) and HDA, 36.5 (33.3). ***p<0.001 in Kruskal–Wallis test. CRP, C-reactive protein; DAPSA, Disease Activity Index for Psoriatic Arthritis; HDA, high disease activity; LDA, low disease activity; MDA, moderate disease activity; REM, remission.
We then performed a sensitivity analysis by using a majority rating approach: we classified patients the way they had been adjudicated by a majority (>50%) of experts: All patients were assigned to one disease activity state by this majority definition: that way, 8 (26.7%) patients were classified as REM, 12 (40%) as LDA, 5 (16.7%) as MDA and 5 (16.7%) as HDA. In 24 of the 30 patients, this majority classification was in line with the classification achieved by use of DAPSA quartiles, as described above. In six patients, the two approaches led to different classifications: two patients in REM according to the derived cutpoint were categorised as LDA by majority rating, two patients in LDA as REM, one patient in MDA as LDA and one patient in HDA would have been rated as LDA by a majority and as MDA or HDA by the remainder (table 1 and see online supplementary table S1). Importantly, the medians and IQRs of the majority rating led to very similar cutpoints between the disease activity states (data not shown) with the exception of the cutpoint between low and moderate disease activity, which amounted to 16 rather than 14. Thus, the previously described inclusive analysis in which no expert opinion was neglected by deriving cutpoints from 25th/75th percentiles was essentially validated by the sensitivity analysis using experts’ majority opinions.
For the clinical DAPSA, which omits CRP, Kruskal–Wallis testing was significant as well (p<0.001), and thresholds between REM, LDA, MDA and HDA were 3.9, 13.6 and 27.6. Similar to the full DAPSA, we rounded cutpoints (arbitrarily rounding the two upper ones down) and propose to use 4, 13 and 27 for the differentiation of disease activity states based on clinical parameters only. Results are displayed in figure 1.
Definition of DAPSA response levels
For the main analysis, we used the ADEPT dataset to evaluate relevant DAPSA treatment response levels at follow-up. By assessing peak values of Cohen's Kappa agreement (κ) we detected the highest agreement between DAPSA percentage response and ACR20/50/70 after 3 months follow-up at 55% (κ 0.56), 74% (κ 0.63) and 84% (κ 0.66) DAPSA relative change. After 6 months, the respective DAPSA response levels were 39% (κ 0.43), 78% (κ 0.64) and 90% (κ 0.67). We carried out analogous analyses with two different datasets from the IMPACT and the GO-REVEAL trials and found similar results. Figure 2 displays the group-wise analyses of patients in TNFi-arms of all three trials. We then performed subgroup analyses in patients who had MDA (n=85; 20.5%) or HDA (n=320; 77.3%) at baseline. The results showed that there were no major differences and that the cutpoints derived from the complete cohort were applicable to patients irrespective of their baseline disease activity levels (figure 3). Furthermore, the cutpoints were applicable to response at 3 and 6 months after treatment initiation. We performed similar analyses to derive response levels for cDAPSA and provide these results as online supplementary figure S2.

Definition of response levels; Cohen’s Kappa analysis. Agreement of DAPSA percentage change (x-axis) with ACR20% (blue lines), ACR50% (red lines), ACR70% (green lines) and PsARC (brown lines). Upper panels show response after 3 months, lower panels: response after 6 months. Left panels display analyses of separate trials: ADEPT (patients on adalimumab, N=127), GO-REVEAL (patients on golimumab, N=255) and IMPACT (patients on infliximab; N=43). Right panels show pooled results of all treatment groups in three trials (N=425). Placebo groups were excluded in all analyses. X-axis: relative change of DAPSA from baseline in percentage; y-axis: Cohen's Kappa in comparison with the respective comparator. The table specifies the respective peak agreement between percentage DAPSA change from baseline (% change) on the one hand, and ACR20/50/70, or PsARC on the other. κ, Cohen's Kappa; BL, baseline; DAPSA, Disease Activity Index for Psoriatic Arthritis; PsARC, Psoriatic Arthritis Response Criteria.

Response criteria: Subgroup analysis by baseline disease activity state. Comparison of patients who had moderate versus HDA at baseline (pooled analysis of treatment groups in ADEPT, IMPACT and GO-REVEAL; N=405). Left panels: patients with moderate disease activity (MDA) at baseline; right panels: patients with HDA at baseline. Upper panels show response after 3 months follow-up, lower panels show response after 6 months follow-up: kappa agreement between DAPSA and ACR20% (blue lines), ACR50% (red lines), ACR70% (green lines) and PsARC (brown lines). X-axis: relative change of DAPSA from baseline in per cent; y-axis: Cohen's Kappa. The table specifies the respective peak agreement between per cent DAPSA change from baseline (% change) on the one hand and ACR20/50/70, or PsARC on the other. κ, Cohen's Kappa; BL, baseline; DAPSA, Disease Activity Index for Psoriatic Arthritis; HAD, high disease activity; MDA, moderate disease activity; PsARC, Psoriatic Arthritis Response Criteria.
In synopsis of all analyses, and after rounding to full integers, we propose the following cutpoints for the definition of DAPSA response: minor response, 50% change in DAPSA; moderate response, 75% change; major response, 85% change. In online supplementary table S2, we compiled an overview of the percentages of patients included in the ADEPT, IMPACT and GO-REVEAL studies who achieved DAPSA50/75/85 response and who would also classify as PsARC, EULAR or ACR20/50/70 response and /or who would achieve DAS SDAI, CDAI or Boolean REM.
Discriminant validity of established response levels
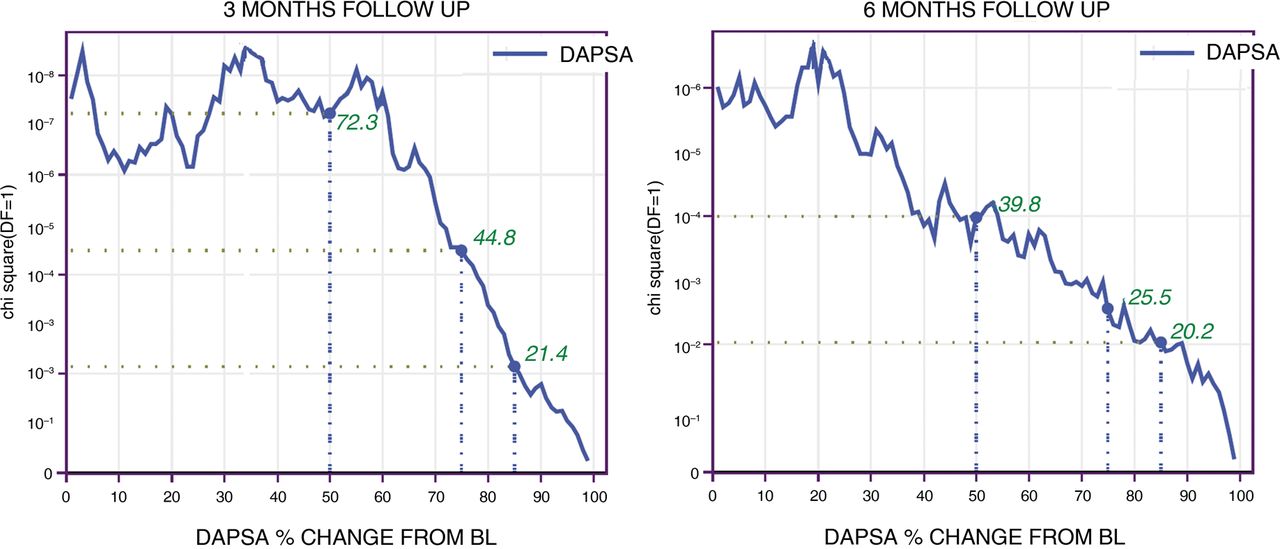
χ2 testing for response in the active versus the placebo groups of clinical trials resulted in p values of <0.001 for 50% DAPSA response (χ parameter: 72.3), p<0.001 for 75% response (χ: 44.8) and p<0.01 for 85% response (χ: 21.4) after 3 months, and p<0.001 for 50% (χ: 39.8), p<0.01 for 75% (χ: 25.5) and p<0.01 for 85% (χ: 20.2) after 6 months, indicating high discriminative validity. Figure 4 displays pooled results of χ2 tests. Detailed χ2 values of ACR, PsARC, EULAR and DAPSA response rates are presented for the ADEPT trial, as an example, in online supplementary table S3 and reveal that DAPSA response rates led to higher χ2 values than the other instruments, suggesting (but not proving) a potentially higher discriminatory capacity.
Discriminant validity of cutpoints in χ2 analysis. χ2 for each DAPSA cutpoint as a measure of strength of discrimination between response in treatment and placebo arms (pooled analyses of ADEPT, GO-REVEAL and IMPACT). X-axis displays DAPSA percentage change from baseline. Y-axis indicates p values of χ2 analyses. Vertical lines indicate newly established cutpoints at DAPSA thresholds of 50/75/85 percentage change from baseline: Results of χ2 tests (green numbers) for our suggested thresholds were 72.3 (p<0.001) for a DAPSA change of 50%, 44.8 (p<0.001) for 75%, and 21.4 (p<0.01) for 85% after 3 months, and 39.8 (p<0.001) for 50%, 25.5 (p<0.01) for 75% and 20.2 (p<0.01) for 85% after 6 months; corresponding p values: see y-axis. BL, baseline; DAPSA, Disease Activity Index for Psoriatic Arthritis.
Validation analyses
As delineated earlier, we used data of GO-REVEAL and IMPACT, and carried out χ2 analysis to validate the data obtained from the ADEPT trial. For additional cross-validation of our results, we also used a small observational dataset of patients with PsA that were followed for two (n=32) or three visits (n=26). Table 2 shows their baseline and follow-up characteristics. Their mean (SD) age and disease duration was 59 (11) and 10 (6) years, and 64% of them were women. Mean (SD) visit intervals were 13.2 (4.4) weeks between baseline and visit 2, and 12.5 (3.9) weeks between visit 2 and visit 3. According to the derived cutpoints, 41.7%, 30.6%, 25% and 2.8% of patients were in HDA, MDA, LDA and REM at baseline, respectively. Mean (SD) values of DAPSA during follow-up: 24.8 (18.7) at baseline, 17.5 (11.6) at visit 2 and 14.4 (14.1) at visit 3. In paired t tests, comparisons between mean DAPSA at baseline and visit 2 were close to being statistically significant (p=0.056), with a standardised response mean (SRM) of 0.50. The difference between baseline and visit 3 (after a mean follow-up of 23.6 weeks) was statistically significant (p=0.019; SRM 0.55). When looking at disease activity states in the course of therapies provided in clinical trials, there was an increase of DAPSA REM rates and a dramatic decrease of HDA states with active therapy, but only little changes with placebo (see online supplementary table S4).
Patient characteristics at baseline and follow-up in the observational database
Discussion
PsA evaluation and the development of meaningful outcomes and composite scores that reflect overall disease activity is challenging due to the diversity of clinical presentations. While peripheral joint affection is highly variable, there is also the possibility of spinal and entheseal involvement.6 Therefore, even when excluding skin affections, the assessment of musculoskeletal problems in these patients poses some difficulties. However, given the relatively low frequency of entheseal involvement and the availability of separate tools for both entheseal and spinal involvement, it seems reasonable to focus on joint activity and systemic levels of inflammation. Patient and physician global scales include the ‘general impact of disease’ and will therefore inherently also consider, to some extent, these other musculoskeletal manifestations.
Among available scores, DAS28 and DAPSA focus on the assessment of peripheral joint activity, whereas other compound scores implement additional disease manifestations. The Psoriatic Arthritis Disease Activity Score22 covers physician and patient global VAS assessment and the physical component score of the Medical Outcomes Survey-Short Form-36 (SF-36), in addition to 66/68 joint counts, enthesitis, dactylitis and CRP.
The Composite Psoriatic Disease Activity Index (CPDAI)23 includes—among others—dactylitis, physical function, enthesitis, axial disease (Bath Ankylosing Spondylitis Disease Activity Index)24 and Ankylosing Spondylitis Quality of Life25 in one score. Furthermore, it incorporates skin affection and its effect on quality of life. Interestingly, the CPDAI failed to discriminate between patients with sonographic synovitis and those without.16 Moreover, given the fact that therapies may have different efficacy for different disease manifestations,26 a highly inclusive score may potentially decrease responsiveness and discriminatory capacity for drugs that may show excellent effects for one but not other manifestations. Importantly, the DAPSA has recently also been shown to perform very well with respect to discriminative and construct validity when compared with other measures of PsA that include or do not include other disease aspects.27 For these reasons we have developed a composite instrument that focuses on peripheral joint involvement—other existing and well-validated measures should be employed to capture additional disease manifestations, which may also be highly relevant for the overall disease assessment as well as patients’ perception of the disease in general and the response of other than joint manifestations to therapy.
In this study, we provide important metrics for the DAPSA to enable its effective use in clinical practice. Based on expert survey analyses and data from clinical trials and routine practice, we derived thresholds for DAPSA disease activity categories as well as definitions of minor, moderate and major DAPSA response. We employed two methods to derive our results, one that included the opinion of all experts on all patients (with some patients being therefore rated in more than just one disease activity category), and another, more common one, that employed majority opinions on disease activity states of individual patients (thus assigning every patient just one activity category); both these methods arrived at very similar results. According to these analyses, the states of REM, LDA, MDA and HDA can be effectively separated by DAPSA cutpoints of 4, 14 and 28.
Similar to previous analyses in RA, where the CDAI as a modification of the SDAI has been derived by the exclusion of CRP,17 we took an analogous approach to specify a cDAPSA. The calculated thresholds for the cDAPSA were very similar to those found for the (full) DAPSA; nevertheless, we suggest decreasing the cutpoint for MDA and HDA by one point compared with the DAPSA, to account for the putative higher levels of CRP in patients with these levels of disease activity. The cDAPSA allows immediate use in patients without the need for serum analyses and there is no delay in therapeutic decision-making. However, it is important to mention that the relevance of systemic inflammation markers, such as CRP, as well as the axial and entheseal affections is not by any means discounted by using the cDAPSA or the DAPSA, but that a special assessment and longitudinal follow-up of these disease manifestations should be done in every patient.
The minor, moderate and major response of DAPSA was set at 50%, 75% and 85%. These thresholds were relatively consistent for patients starting treatment in HDA or MDA, and proved to be useful 3 or 6 months after treatment initiation, alike. In explorative analyses, we also evaluated a ‘minimal response’ cutpoint at a DAPSA relative change of 35% from baseline. This threshold would correspond to the PsARC response (data not shown). However, we refrained from formally defining this additional cutpoint to the core set of response measures to conform with the commonly accepted three-level assessment as defined in the ACR response scheme. It should be borne in mind that response criteria permit only a relative assessment of change from baseline and, therefore, are primarily useful in clinical trials, but less so in clinical practice where reaching a particular state appears to be the main focus. Indeed, it has been shown at least in RA that physical function and radiographic outcome are rather related to disease activity states reached than to response levels.28 ,29 However, with 85% improvement from baseline, as is requested for a DAPSA major response, patients will most likely achieve at least LDA.
In the decision process for the currently suggested cutpoints, we made an effort to find a balance between the exact numerical outcomes of our analyses on the one hand and clinical practicability on the other hand. We believe that the actual use of composite disease activity measures and response criteria in daily practice is highly dependent on their feasibility. The newly defined thresholds can be calculated easily in every patient even in clinical settings with limited time resources. This will hopefully enable widespread use of the tool in clinical decision-making and timely change of therapy, where needed.
The main strength of our analyses lies in the accessibility of a large dataset derived from three RCTs that allowed validation of the cutpoints and response levels. A limitation is the low patient number in the observational dataset. However, the observational analyses served mainly as cross-validation of prior analyses to prove the usefulness of the DAPSA score also in real-life patients. As such, it showed responsiveness and validity also in this small set of patients. Certainly, use and validation in large-scale observational PsA data should be encouraged. Furthermore, it would be of interest to compare the performance of DAPSA with scores used in axial disease, such as the ASDAS. Lastly, there is need for further research on possible influence of entheseal involvement on the DAPSA beyond the mere peripheral arthritis components. We were not able to tackle these questions with the dataset available to us.
In summary, the DAPSA constitutes a validated and easy to calculate compound measure that is derivable by simple numerical summation and allows quantification of disease activity. With the data provided here, we enable the definition of treatment targets, such as REM or LDA for a treat-to-target approach, as well as the definition of inclusion criteria for clinical trials for patients in MDA and HDA. The new response levels will help assess treatment in many settings.
Acknowledgments
We thank all rheumatologists who participated in our survey. We are also grateful to Abbvie and Janssen for providing us with the data of the clinical trials used in this study and to Professor Helmuth Haslacher (Department of Laboratory Medicine, Medical University of Vienna, Austria) who kindly provided laboratory results of our observational cohort.
References
Supplementary materials
Supplementary Data
This web only file has been produced by the BMJ Publishing Group from an electronic file supplied by the author(s) and has not been edited for content.
- Data supplement 1 - Online figures
- Data supplement 2 - Online tables
Lay summary
This web only file has been produced by the BMJ Publishing Group from an electronic file supplied by the author(s) and has not been edited for content.
Footnotes
Handling editor Tore K Kvien
Contributors MMS, FA, DA and JSS carried out analyses and interpretation of data. MMS, DA, JSS contributed to the drafting and revising of the manuscript. All authors have approved of the final version of the manuscript.
Competing interests None declared.
Patient consent Obtained.
Provenance and peer review Not commissioned; externally peer reviewed.