Article Text

Abstract
Objective To investigate cross-sectional and longitudinal associations between serum leptin levels and knee cartilage thickness in older adults.
Methods A prospective cohort of 163 randomly selected subjects (mean 63 years, range 52–78, 46% women) was studied. Knee cartilage thickness at medial tibial, lateral tibial, femoral and patellar sites was determined using T1-weighted fat-suppressed MRI. Serum leptin levels were measured by radioimmunoassay. Radiographic osteoarthritis, body fat (%), trunk fat (%), weight and height were measured, and body mass index (BMI) was calculated.
Results Cross-sectionally, serum levels of leptin were negatively associated with femoral (β: −0.013, 95% CI −0.022 to −0.003), medial tibial (β: −0.009, 95% CI −0.018 to −0.001), lateral tibial (β: −0.012, 95% CI −0.021 to −0.003) and patellar (β: −0.014, 95% CI −0.026 to −0.002) cartilage thickness after adjustment for covariates. Moreover, BMI, trunk fat and total body fat were negatively associated with cartilage thickness, and the significant associations disappeared after further adjustment for leptin. Longitudinally, both baseline leptin and change in leptin were associated with greater changes in medial tibial cartilage thickness (β: −0.004, 95% CI −0.007 to −0.001 and β: −0.009, 95% CI −0.018 to −0.001, respectively) in multivariable analyses.
Conclusions Serum levels of leptin are independently and consistently associated with reduced cartilage thickness cross-sectionally and longitudinally. In addition, the associations between adiposity measures and cartilage thickness are mediated by leptin, suggesting leptin may play a key role in cartilage thinning.
- Osteoarthritis
- Magnetic Resonance Imaging
- Knee Osteoarthritis
Statistics from Altmetric.com
Introduction
Osteoarthritis (OA) is a slowly progressive disease characterised by gradual loss of articular cartilage. Obesity is a well-known risk factor for knee OA, and obesity-related metabolic and inflammatory factors may play roles in the aetiology of OA.1
Adipose tissue, once considered a passive storage portal of energy, is now regarded as a highly metabolic endocrine organ with the capacity to secrete inflammation-related adipocytokines. Of these, leptin has received particular interest due to its role not only in influencing body weight homeostasis but also in regulating immune and inflammatory processes.2 Leptin is a small (16 kd) non-glycosylated protein encoded by the gene ob (obese). Leptin and its receptor have been identified in human chondrocytes, osteophytes, synovium and infrapatellar fat pad,3 thus its expression may be directly associated with the degree of local cartilage degradation.4
Leptin is generally higher in obese individuals. Body mass index (BMI) and body weight are consistently associated with leptin levels in OA patients.5 ,6 However, not all obese persons develop knee OA, nor are all individuals with OA obese. The exact function of leptin in OA is undetermined, although it is proposed to have a biphasic effect,7 with low levels possibly facilitating cartilage synthesis and high levels contributing to cartilage degradation. Interestingly, in an experimental study, Griffin suggested that body fat, in itself, may not be a risk factor for joint degradation, because adiposity in the absence of leptin signalling is insufficient to induce systemic inflammation and knee OA in female mice.8
Our cross-sectional data have already highlighted the pathological role of leptin in OA. Using MRI, we have demonstrated that serum levels of leptin are associated with reduced knee cartilage volume, and the associations between obesity measures, female sex and cartilage volume are largely mediated by leptin.9 In another study on hip OA, we have reported that positive associations between body composition and hip joint space narrowing (JSN) are also mediated by leptin, particularly in women.10
As causal inference cannot be obtained from cross-sectional studies, a prospective design is needed to test if leptin plays a role in cartilage degradation. Cartilage thickness assessed from MRI over the total area of subchondral bone is a potential morphologic biomarker suggested by an international panel of experts and has been recognised in recent years as an important quantitative measurement of knee osteoarthritic status.11 ,12 Reichenbach reported that in all subregions and both genders, reduced knee cartilage thickness was observed in patients with radiographic OA of Kellgren/Lawrence (K/L) grade ≥2, while reduced knee cartilage volume was only observed in those with K/L grade of 4 13 indicating cartilage thickness is possibly more sensitive in detecting early OA although other studies suggest volume may be sensitive to the early stages of OA as assessed by JSN alone rather than a composite score.14 It is thus worthwhile examining thickness as well as volume. The aim of this study, therefore, was to determine the cross-sectional and longitudinal associations between serum leptin levels and knee cartilage thickness in older adults.
Materials and methods
Study design and subjects
This study was conducted as part of the Tasmanian Older Adult Cohort study, a prospective epidemiological study of 1100 persons aged 50–79 years, with a goal of identifying the environmental, genetic and biochemical factors associated with the development and progression of OA and osteoporosis (the overall response rate was 57%). Participants were selected randomly using computer-generated random numbers from the electoral roll in Southern Tasmania (population 229 000), a comprehensive population listing, with an equal number of men and women. Institutionalised persons were excluded. The study was approved by the Southern Tasmanian Health and Medical human research ethics committee, and written informed consent was obtained from all participants. The first 172 subjects were selected to perform the measurements of leptin at baseline and follow-up. Of these, 163 had MRI images at baseline and follow-up. Follow-up leptin measurements were not performed in six of these subjects due to insufficient serum sample, leaving 157 subjects for longitudinal analysis. Self-reports of smoking status and disease status such as rheumatoid arthritis (RA), asthma, cardiovascular disease and diabetes were recorded by questionnaire. Baseline measurements were conducted from April 2002 to September 2004, and the follow-up was from September 2004 to February 2007.
Anthropometrics
Weight was measured to the nearest 0.1 kg (with shoes, socks and bulky clothing removed) using a single pair of electronic scales (Seca Delta Model 707, Bradford, Massachusetts, USA) that were calibrated using a known weight at the beginning of each clinic. Height was measured to the nearest 0.1 cm by using a stadiometer with shoes, socks and headgear removed. BMI (weight (kg)/height2 (m2)) was calculated. Fat mass and lean mass (kg) were measured using a Hologic dual-energy X-ray absorptiometry (DXA) scanner (Hologic Corp., Waltham, Massachusetts, USA). Percentage total body or trunk fat mass is the ratio of total body or trunk fat mass divided by total body or trunk mass.
Knee cartilage thickness measurement
MRI of the right knee was performed at baseline and follow-up with a 1.5 T whole-body magnetic resonance unit (Picker), using a commercial transmit/receive extremity coil. The following sequence and parameters were used: a T1-weighted fat suppression 3D gradient-recalled acquisition in the steady state, flip angle 30°, repetition time 31 ms, echo time 6.71 ms, field of view 16 cm, 60 partitions, 512×512 pixel matrix, acquisition time 5 min 58s, 1 acquisition and sagittal images obtained at a partition thickness of 1.5 mm without a between-slice gap. Images were checked for image noise and structural abnormalities interfering with segmentation.
Segmentation was performed by one of us (OS) using custom semiautomated segmentation software written in MATLAB. All baseline and follow-up images were grouped together and segmented in randomised order, with the user blinded to subject information and baseline/follow-up status. The semiautomated segmentation approach used the following method. First, the user selected start and end sagittal images for each major cartilage region (femoral, medial tibial, lateral tibial and patellar). Seed points within the subchondral bone were manually selected on the slice midway between the start and end to approximate a point roughly equidistant from all cartilage being considered. Initial boundary finding for the bone–cartilage interface was performed by an active contour approach. The contour was seeded as a thin cylindrical mesh along the sagittal axis and grew outwards, where the user was able to adjust coefficients relating to internal and image forces to find a good fit. After fine adjustment of this inner contour by greyscale smoothing and thresholding, a 2D greyscale image was presented representing the mean signal intensity over several pixels outwards from the subchondral bone–cartilage interface. The user was able to delineate the edges (boundary where inner and outer surfaces meet) of the cartilage region. A second active contour projected outwards, controlled by the user, was used to find the outer surface of the cartilage. The final stage involved checking and manual adjustment of contours in individual slices to correct any errors.
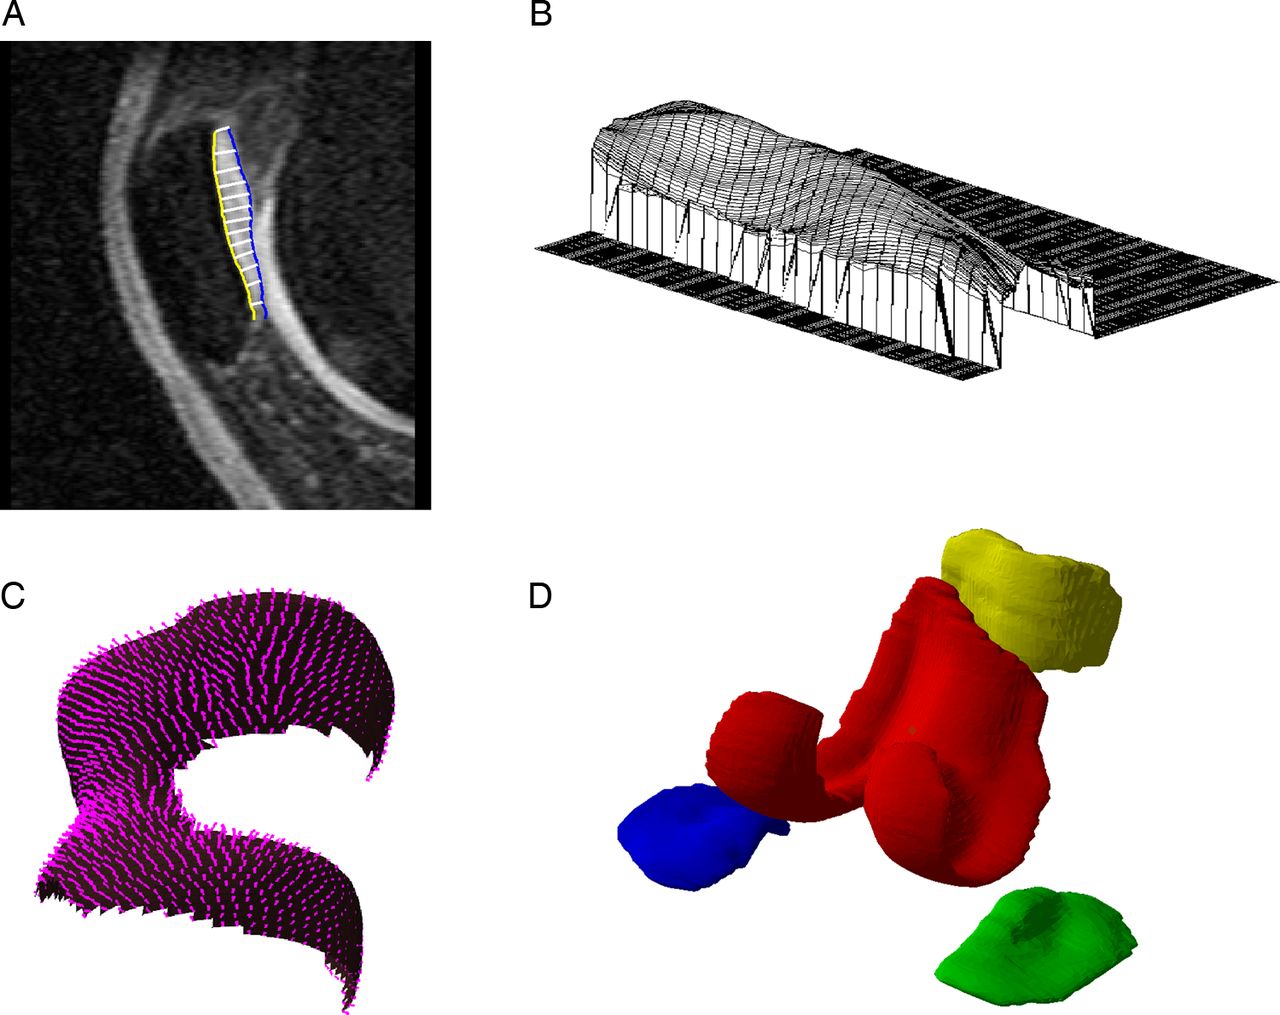
This method allowed for non-contiguous portions of cartilage to be grouped together and was sensitive to portions of cartilage unconnected in the same slice (figure 1). For our analysis, femoral cartilage was considered as a single region, as was patellar cartilage. Medial and lateral tibial portions of cartilage were considered as separate whole regions. Analysis was also performed using all knee cartilage combined. Mean thickness for a region of cartilage was calculated from a sample of uniformly spaced points over the entire bone–cartilage interface as the mean distance to the outer surface measured at each point in the direction towards the closest part of the outer surface. Intraobserver reproducibility (measured in 20 subjects) for mean cartilage thickness, as measured by coefficients of variation (CVs), was 1.9–2.9%. This is similar to that for cartilage volume in our hands.14

(A) One slice in segmentation of patellar cartilage with cartilage–bone interface in yellow and cartilage outer surface in blue. (B) Thickness profile over flattened patellar cartilage. (C) Unflattened femoral cartilage–bone interface with vectors denoting regularly sampled thickness vectors (measurement spacing downsampled for clarity). (D) 3D reconstruction of major cartilage regions, separated visually—red: femoral; blue: medial tibial; green: lateral tibial; yellow: patellar.
Other knee structures measurements
Knee cartilage volume was measured as previously described14 ,15 by manually drawing contours around the cartilage in each slice, for the medial tibial, lateral tibial and patellar cartilage. The volume of the particular cartilage plate was then determined by multiplying the count of voxels inside each plate by the voxel volume. The CVs for these measures were 2.1–2.6%.
Bone marrow lesions, meniscal tears and extrusion were assessed as previously described.16–18
Serum leptin measurement
Serum was separated and aliquoted into plastic storage tubes. Aliquots were stored at –80°C till analysis. The levels of leptin were measured by radioimmunoassay (LINCO Research; now part of Millipore, Missouri, USA). Samples with undetectable leptin concentration were assigned a value corresponding to the lower limit of detection of the assay (0.5 μg/L). The CV in our hands was 4.6% for leptin, as previously published.9 ,10
Radiographic OA assessment
According to the Osteoarthritis Research Society International atlas19 and as we previously reported,15 a standing anteroposterior semiflexed view of the right knee with 15° of fixed knee flexion was performed in all subjects at baseline and scored individually for JSN and osteophytes on a scale of 0–3 (0=normal and 3=severe). The presence of radiographic OA was defined as any JSN or osteophyte score of ≥1 in individual compartment.
Data analysis
Student t tests or χ2 tests were used to compare means or proportions, respectively. Scatter plots were used to depict the cross-sectional associations between leptin levels and knee cartilage thickness in different components. Changes in cartilage thickness, cartilage volume and leptin levels were calculated by subtracting the baseline level from the follow-up level divided by the interval between measures. Univariable and multivariable linear regression analyses were used to examine the associations between leptin or change in leptin (the independent variables) and both baseline and change in knee cartilage thickness (or volume) (the dependent variables) before and after adjustment for covariates, which were age, sex, BMI, lean mass, smoking status, radiographic OA and disease status (RA, cardiovascular disease, asthma and diabetes). The associations between the dependent variable knee cartilage thickness and the independent predictor BMI (or body fat mass) were also investigated by linear regression before and after adjustment for leptin, to test if leptin mediated these associations. Standard diagnostic checks of model fit and residuals were routinely made, and data points with large residuals and/or high influence were investigated for data errors. Observations with missing data in any variables were excluded from models. A p value <0.05 (two-tailed) or a 95% CI not including the null point (for linear regression) was regarded as statistically significant. All statistical analyses were performed on SPSS V.19.0 for Windows (SPSS, Chicago, Illinois, USA) or Stata statistical software, V.9.2 (Stata Corp., College Station, Texas, USA).
Results
Of 163 subjects (46% women) included in the analysis, the average age at baseline was 62.6 years. The mean BMI was 27.5 kg/m2. The median leptin level was 8.65 pg/mL. The mean (SD) leptin level was 12.69 (10.97) pg/mL.
There were no significant differences in demographic factors between the current cohort and the subjects who did not have leptin measured (data not shown). As shown in table 1, subjects with higher and lower levels of leptin (split at the median level) were similar in terms of age, smoking status, diabetes, heart diseases, radiographic JSN and osteophytes. However, subjects with higher levels of leptin had a higher proportion of women, greater BMI, total and trunk fat percentage and lower cartilage thickness.
Characteristics of participants (split by median level of leptin)
In cross-sectional analyses, leptin levels were significantly associated with knee cartilage thickness at all sites before and after adjustment for age, sex, BMI, radiographic OA, lean mass, having smoked and disease status (figure 2, table 2). BMI was not associated with cartilage thickness in unadjusted analyses, but was significantly associated with thickness at femoral and patellar sites after adjustment for the covariates as mentioned above. However, these negative associations became non-significant after further adjustment for leptin (table 3). Baseline percentage total body and trunk fat were negatively associated with cartilage thickness at all sites but only remained significant at the lateral tibial site after adjustment for the covariates. These significant associations also disappeared after further adjustment for leptin (table 3).
Cross-sectional associations between leptin and cartilage thickness
Cross-sectional associations between measures of adiposity and cartilage thickness: mediating roles of leptin

Scatter plot for the linear associations between baseline serum levels of leptin and cartilage thickness. Leptin was significantly associated with knee cartilage thickness in all the components of knee (R2=0.18, 0.15, 0.19 and 0.17 for cartilage thickness in femoral, lateral tibia, media tibia and patella, respectively, all p<0.05) in adjusted analysis.
Longitudinally, as shown in table 4, baseline leptin was negatively associated with change in cartilage thickness at the femoral, medial tibial and lateral tibial sites, and the association with change in medial tibial cartilage thickness remained significant after adjustment for age, sex, BMI, radiographic OA, lean mass, having smoked and disease status. Change in serum leptin was negatively associated with change in medial tibial cartilage thickness and this association remained unchanged after adjustment for the covariates as mentioned above.
Longitudinal associations between leptin and cartilage thickness change
In unadjusted analyses, baseline percentage total fat was negatively associated with change in femoral cartilage thickness (β: −0.007, p=0.045) or change in lateral tibial cartilage thickness (β: −0.008, p=0.018), and these became non-significant after adjustment for leptin (β: −0.006, p=0.159, and β: −0.007, p=0.073, respectively). Similarly, the significant associations between baseline percentage trunk fat and change in femoral cartilage thickness (β: −0.004, p=0.022) also became non-significant after adjustment for leptin (β: −0.001, p=0.615). The unadjusted significant associations between fat measures and change in cartilage thickness did not remain after adjustment for covariates, including age, sex, height, radiographic OA, lean mass, having smoked and other diseases (data not shown).
When changes in cartilage volume were used as outcome measures, in multivariable analyses, we did not find significant associations between baseline leptin and loss of cartilage volume at the medial tibial, lateral tibial or patellar sites (p=0.44, 0.96, 0.90, respectively), nor change in leptin and cartilage volume loss (p=0.69, 0.95, 0.87 respectively). After further adjustment for meniscal tears and extrusion or bone marrow lesions, the results remained largely unchanged (data not shown).
Discussion
This is the first study to examine the cross-sectional and longitudinal associations between serum levels of leptin and cartilage thickness in older adults. In multivariable analyses, leptin was significantly associated with decreased cartilage thickness cross-sectionally; and longitudinally, both baseline and changes of leptin were negatively associated with changes in medial tibial cartilage thickness over 2.7 years. Moreover, significant cross-sectional associations between body adiposity measures and cartilage thickness disappeared after adjustment for leptin suggesting the association between obesity and cartilage thickness is most likely mediated by leptin.
Leptin may act in a biphasic manner7 ,20: leptin physiologically may have a beneficial effect on cartilage synthesis and induce anabolic activity of chondrocytes, but an excess of leptin may play a catabolic role which may contribute to the pathological process of OA.21 ,22 Leptin appears to be an important local and systemic factor influencing cartilage degradation in animal study.6 ,23 It has been shown that leptin may display pro-inflammatory or anti-inflammatory effects in the joints depending on the immune response.24 ,25 In a recent in vitro study, leptin, either alone or in synergy with interleukin 1, significantly induced collagen release from cartilage by upregulating collagenolytic and gelatinolytic activity.26
Some preliminary epidemiological studies have suggested a potential role of circulating leptin in OA. While Iwamoto reported that serum leptin concentration might be related to increases in body weight and total fat mass in postmenopausal women with knee OA,27 Miller reported that decreases in serum leptin could explain why weight loss improved physical function and symptoms in patients with knee OA.28 de Boer documented a distinctly higher serum leptin level in end-stage knee OA patients as compared with controls,5 and we also reported that hip JSN was associated with serum levels of leptin in older adults.10 In contrast, Yusuf reported that serum leptin level was positively correlated with BMI but was not associated with progression of hand OA, while serum adiponectin was associated with reduced progression of hand OA over time.29 Massengale reported that serum leptin was not cross-sectionally associated with hand OA in US adults of the Third National Health and Nutrition Examination Survey,30 and serum adipokines, including leptin, adiponectin and resistin, were not associated with hand OA radiographic severity.31 Berry et al reported that serum leptin was not associated with changes in cartilage volume and cartilage defects over time.32 Furthermore, some data rather suggested other adipokines, for example, adiponectin, to be associated with cartilage degradation.33 Most of these were cross-sectional studies, thus the temporal relationship between leptin and OA could not be determined.
Assessment of cartilage thickness by MRI, with fat-suppressed gradient echo sequences, and appropriate image analysis techniques has been used with high accuracy and adequate precision for detecting early OA14 and quantitative measurement of cartilage damage34 in healthy subjects and patients with OA.35–37 Using this technique, we reported the cross-sectionally negative associations between leptin and cartilage thickness at all four sites of whole knee in the current study, which is consistent with our previous findings for the associations between leptin and knee cartilage volume. Most importantly, we found that baseline leptin was negatively associated with change in medial tibial cartilage thickness independently of potential confounders, including BMI. This is the first study to suggest a causal relationship between leptin and loss of cartilage thickness in older adults with or without knee OA. In contrast, we did not find significant associations between leptin and change in cartilage volume. The reasons for this are unknown, but it may reflect a comparative higher sensitivity of thickness than volume measures to early changes in cartilage.13 While the two are closely related (cartilage volume is a function of cartilage thickness and the size of the contacting area with subchondral bone), cartilage thinning is largely not confounded by changes in subchondral bone area. As higher serum leptin was associated with increased levels of bone formation biomarkers over 2 years,32 effects of leptin on cartilage volume loss may be affected by its effects on bone.
Our results further demonstrated two features of leptin in OA. First, adiposity status as a risk factor for OA may be mediated by leptin. In our baseline data, those with higher levels of leptin had higher BMI, body total fat, trunk fat and lower cartilage thickness than those with lower levels of leptin. We also found significant associations between adiposity measures and cartilage thickness, the magnitude of which decreased substantially at all sites after adjustment for leptin, providing support for this hypothesis of mediation. Moreover, the unadjusted longitudinal associations between adiposity measures and changes in cartilage thickness became non-significant after adjustment for leptin, further suggesting a mediating role of leptin. These results coincide with findings of our previous studies9 ,38 and the findings in a bench study in mice, which suggested that leptin could be independently involved in OA as obesity did not predispose to OA in the absence of leptin.8
Second, our longitudinal results documented that loss of media tibial cartilage thickness is most strongly associated with leptin. The reasons for this are unclear, but it may reflect the fact that cartilage degradation in the medial compartment is more common.39 Similarly, a recent study suggested that weight loss in obese people has structure-modifying effects on medial but not on lateral knee compartment.40 It is possible that obesity loads can be perceived by mechanoreceptors on chondrocyte surfaces triggering leptin signalling cascades, and thus induces more cartilage loss in the medial compartment. A study in mice illustrated that leptin receptor signalling is a negative modulator of bone mechanosensitivity,41 which supports this assumption.
There are a number of potential limitations in this study. First, the response rate at baseline was 57%, possibly due to the demands on study participants in that each visit took 3 h. This did leave the possibility open for selection bias. However, there were no significant differences in age and gender between those responded and those did not. We also had high rates of retention (82%) to offset this. Second, although we studied a well-characterised population of older adults with a high level of knee pain (46%), this randomly selected sample unavoidably included subjects with other diseases, which may have affected the associations. Nevertheless, the results were largely unchanged when the analyses were adjusted for disease status or the subjects with other diseases were excluded. Third, we have selected cartilage thickness as our outcome measure, as loss of cartilage thickness may reflect the change in early phase which is more suitable for our cohort with a lower JSN and osteophyte rate than many OA cohorts. Further work is required to determine the role of leptin in established OA using loss of cartilage volume as the outcome. Fourth, the sample size was modest. It is possible that with a larger sample we may have been able to detect more significant associations. Fifth, the levels of leptin were measured in serum, as opposed to synovial fluid, which do not allow us to detect local autocrine or paracrine effects. However, leptin levels from serum were highly correlated with those from synovial fluid in patients with knee OA.3 Last, measurement error may influence results. However, given all measures (eg, cartilage thickness and leptin) were highly reproducible, this is considered unlikely.
In conclusion, serum levels of leptin are independently and consistently associated with reduced cartilage thickness cross-sectionally and longitudinally. In addition, the associations between adiposity measures and cartilage thickness are mediated by leptin suggesting leptin may play a key role in cartilage loss.
Acknowledgments
Special thanks go to the subjects who made this study possible. The role of Catrina Boon and Pip Boon in collecting the data is gratefully acknowledged. We also thank Drs V Srikanth and H Cooley for radiographic assessment.
References
Footnotes
Handling editor Tore K Kvien
OPS and YC contributed equally to this work.
Contributors OPS had full access to all the data in the study and takes responsibility for the integrity of the data and the accuracy of the data analysis. Study design: CD and GJ. Acquisition of data: OPS and CD. Analysis and interpretation of data: OPS, YC and GJ, LB, BA, FC and CD. Manuscript preparation and approval: OPS, YC, GJ, LB, BA, FC and CD.
Funding Funding was received from the National Health and Medical Research Council of Australia (302204), the Tasmanian Community Fund (D0015018), the Arthritis Foundation of Australia (MRI06161) and the University of Tasmania Grant–Institutional Research Scheme (D0015019).
Competing interests None.
Patient consent Obtained.
Ethics approval The study was approved by the Southern Tasmanian Health and Medical human research ethics committee, and written informed consent was obtained from all participants.
Provenance and peer review Not commissioned; externally peer reviewed.